1. וייסלר חנניה
סיום פרויקטGIS
1.
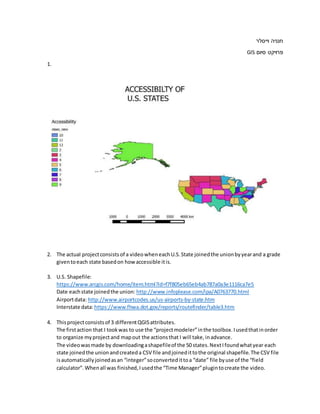
2. The actual projectconsistsof a videowheneachU.S.State joinedthe unionbyyearand a grade
giventoeach state basedon how accessible itis.
3. U.S. Shapefile:
https://www.arcgis.com/home/item.html?id=f7f805eb65eb4ab787a0a3e1116ca7e5
Date eachstate joinedthe union: http://www.infoplease.com/ipa/A0763770.html
Airportdata: http://www.airportcodes.us/us-airports-by-state.htm
Interstate data:https://www.fhwa.dot.gov/reports/routefinder/table3.htm
4. Thisprojectconsistsof 3 differentQGISattributes.
The firstaction that I tookwas to use the “projectmodeler”inthe toolbox.Iusedthatinorder
to organize myprojectand mapout the actionsthat I will take,inadvance.
The videowasmade by downloadingashapefileof the 50 states.NextIfoundwhatyear each
state joinedthe unionandcreateda CSV file andjoinedittothe original shapefile.The CSV file
isautomaticallyjoinedasan “integer”soconvertedittoa “date” file byuse of the “field
calculator”.Whenall was finished,Iusedthe “Time Manager”plugintocreate the video.
2. The grade of accessibilitywascreatedbasedonafew aspectsof the state.I took the
informationof howmanyinternational airports,domesticairports,andinterstatesare ineach
state to determine the accessibilityof eachstate.Basedonthe amountof each factor found,
each state wasgiventhree separate grades(one foreachfactor).Atthe end,the three grades
were addedupinorder to determinethe final grade anddetermine whichstate ismost
accessible basedonthe factors.