1. Imaging Fourier Transform Spectrometer
For Nadir Atmospheric Measurement
G. Singh, C.T. McElroy, D.V Barton, Z. Vaziri, C. Zheng
York University, Toronto, Canada
Gurpreet Singh
LARSS, Lassonde School of Engineering, York University
Email: GurpreetSingh.YorkU@Gmail.com
Website: http://larss.science.yorku.ca/• http://www.gurpreetsingh.space/
Phone: +1 416.736.2100 ext 21093
Contact
1. Buijs, H.L., & McKinnon, J. (2007). Patent No. US 7, 480, 055 B2. United States
2. Lachance, R. L., McConnell, J. C., McElroy, C. T., O'Neill, N., Nassar, R., Buijs, H., et al. (2012). PCW/PHEOS-WCA: quasi-geostationary Arctic
measurements for weather, climate, and air quality from highly eccentric orbits. Proc. SPIE 8533, Sensors, Systems, and Next-Generation Satellites
XVI.
3. NSIDC. (n.d.). National Snow & Ice Data Center. Retrieved 2016, from http://nsidc.org/soac
4. Trishchenko et al. (2011, November). Three-Apogee 16-h Highly Elliptical Orbit as Optimal Choice for Continuous Meteorological Imaging of Polar
Regions. Journal of Atmospheric and Oceanic Technology, 28, 1407 - 1422.
5. STDP: imaging FTS Requirements Review Meeting. ABB, April 26th , 2016 (ABBCABOM- 03673 C)
References
The Arctic shows faster and more severe signs of climate change than the rest of
the world. The melting of sea ice as a result of global warming has made the
existence of life even more vulnerable on planet Earth.
Until now, permafrost and the sea ice have acted as a seal, preventing heat from
penetrating the methane hydrates and causing further destabilization. Methane
hydrate has a positive feedback, thus the melt of hydrates and their transfer into
the atmosphere, will result in further warming and hydrate melting.
The IFTS is intended to provide a geo-stationary like view over the Arctic region.
The proposed mission will provide pressure, temperature and constituent profiles.
Introduction
Space Mission
The instrument is based on a commercial Michelson interferometer design. The
core of the spectrometer is being built by ABB Inc. of Quebec City and includes two
corner cube reflectors and a zinc selenide beam splitter. A temperature-controlled,
diode laser is mounted on the base plate to control the scan speed of the
interferometer and a white light source is used to find the zero path difference
(ZPD). The instrument looks at two different wavelength channels centred at 762
nm to measure O2 concentrations in the A band and at 1600 nm to measure CH4
and CO2 concentrations. An inexpensive double axis mirror pointing system has
been developed and tested by the same research group to map the field of regard
and compensate for the scene motion during data acquisition. The interferogram
will be collected at a rate of ~100 fps and at a spectral resolution of 0.25 cm-1.
Imaging FTS
Technological Readiness
• Improve estimates of GHSs & sources, CO2 and CH4
• Meteorological data: Temperature and Pressure
• Improve our understanding of air quality in the Arctic.
IFTS Science Goals
A stratospheric balloon mission to test and increase the technology readiness level
(TRL) at Fort Sumner’s Scientific Balloon Facility, New Mexico in collaboration with
the Jet Propulsion Laboratory, NASA. This station has been chosen due to its close
proximity with the methane “Hotspot” at the ‘four corners’ in the western US.
A highly elliptical three – apogee orbit with a 16-h period is proposed for
continuous meteorological imaging of polar regions from a two-satellite
constellation.
Figure 1. Final core design. Figure 2. Interference image Figure 3. Pointing system
Simulated Spectra
Instrument Core
The mirror pointing system has shown successful demonstration in an operational
environment (TRL 7), during the PARABLE mission at Timmins Ontario in September
2015.
The IFTS core is a Commercially Off The Shelf (COTS) component and has been
validated in a relevant environment.
Other computers and electronics are also COTS that are qualified through test and
a demonstration in the space environment.
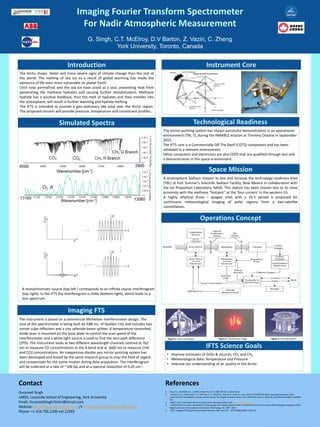
Operations Concept
A monochromatic source (top left ) corresponds to an infinite cosine interferogram
(top right). In the IFTS the interferogram is finite (bottom right), which leads to a
Sinc spectrum.