SlideShare a Scribd company logo
This is just an example and you should not copy any parts of it
in your initial post. Doing so will result in an automatic 0.
Your initial post does not need to be this long, but you have to
follow the same format. Avoid being tempted to copy this
written argument; the author has made little mistakes and there
are some errors in stated data.
Question 1
My Texas state House representative is Representative Thresa
"Terry" Meza. She is female, and her party affiliation is
Democrat. Her race is unknown, but her district number is 105
(Texas House of Representatives). My Texas state senator is
Senator Kelly Hancock. He is male, and his party affiliation is
Republican. His race is also unknown. His district number is 9
(The Texas Tribune).
Question 2
It looks like the legislature is unrepresentative of the people of
Texas. Before I begin, I would like to share the research I found
about my Representative and Senator of my district.
Representative Thresa Meza from District 105 looks like she
represents the Hispanic communities. In a way, she is also
representing the minority group. In the “Biography” section, it
says that “she also worked as a nonprofit director overseeing
programs in small & minority business assistance” (Texas
House of Representatives). It may not sound like it, but we see
some representation towards the minority groups. I clicked on
the “District Profile Reports”. In that link, it showed a profile
of the district, titled “Texas House District 105: ACS 2014-
2018 Estimates”. According to the report, the population of
District 105 is about 189,119. There are 49,738 non-Hispanic
Anglos or Caucasians out of the total population. As for non-
Anglo groups, there are 139,381 (Texas Legislative Council).
Here, we can see larger numbers of minorities than the majority
in this district. I mentioned that she might be representing the
Hispanic communities. According to the analysis, there are
96,503 Hispanics in that district (Texas Legislative Council). At
the same time, she is a minority, so she is also representing the
non-Anglos community. Next would be the Texas Senate.
Senator Kelly Hancock is from District 9. According to the
District Profile, titled “Texas Senate District 9: ACS 2014-2018
Estimates”, the population of District 9 totaled up to about
902,387. There are about 388,926 non-Hispanic Anglos and
513,461 non-Anglos in District 9 of Texas (Texas Legislative
Council). Looking at the non-Anglos race separately, we see
that the majority of the population in this district are
Caucasians. Therefore, Senator Kelly Hancock is representing
them. By comparison, we can see that Representative Thresa
Meza is more representative of the people of Texas than Senator
Kelly Hancock based on race. Simultaneously, the Senate and
House of Representatives represent the whole population of
their district and not a specific racial group. As I mentioned
earlier, I feel the legislature is not representative of the people
of Texas. There are different district analyses to each of the
districts than what I shared. We will find out why, using the
population size of Texas of 2019, along with the population of
each race and gender of Texas.
A presentation from Texas Demographic Center,
titled Demographic Trends and Population Projections for Texas
and the North Texas Region, presented to Leadership North
Texas, provided a chart, titled “Population Growth of Select
States, 2000-2019”. The chart shows that the population was
25,145,561 in the year 2010. In 2019, the population increased
to a total of 28,995,881. The presentatio n also pointed out, “As
Texas grows, it ages and continues to diversify” (Texas
Demographic Center). They provided another chart, titled
“Race/Ethnicity Composition, Texas, 2010-2019”. The chart
revealed that non-Hispanic White is the largest estimated
population of 2019. The Hispanic race is the second-largest
population, and they are also the largest minority group. The
remaining groups were non-Hispanic (NH) African-American,
Asian, American Indian and Alaska Native, and Native
Hawaiian and Other Pacific Islander. They also included “NH
Two or More Races”. The population of the remaining groups
was 3.5 million or below (Texas Demographic Center). This
result shows that there are smaller populations in the minority
groups, excluding the Hispanics.
Another piece of information I want to point out is gender.
Legislative consists of two bodies, which are the Senate and the
House of Representatives. According to The State of Texas:
Government, Politics, and Policy, written by Sherri Mora, she
provided a table chart, titled “Background of Members of the
Texas Legislature, 2018” (Mora). According to the chart, the
members of the house consist of 121 males and 29 females. As
for the senate, there are 23 males and eight females (Mora).
Mora also wrote that “cultural changes in the state over recent
decades have increased the diversity of the Texas legislature”
(Mora). "The number of officeholders who are members of
ethnic minority groups has grown, both in Texas and across the
nation” (Mora). The reason was partly due to "reapportionment
and redistricting" (Mora). Still, “women and people of color are
underrepresented in the Texas legislature when compared with
their proportions of the state population” (Mora). In the 85th
Texas Legislature of the year 2017, the people of color formed
57.1 percent of the population of Texas. However, they only
accounted for “35.9 percent of the legislative seats” (Mora).
The same situation applies to women. While women accounted
for 50.4 percent of Texas's population, “women hold only 20.4
percent of the seats in the Texas legislature” (Mora). As of now,
we have 112 males and 38 females in the House of
Representatives. There are also various members of different
races. However, a majority of the members are Caucasians and
males. If we were counting members of a particular race, there
would be fewer of them. Instead, we would count the members
based on how many minorities there are in the House. From the
list, there are about 20-25 female members. There are more
males than females in the House. However, looking at the
female members, there are more minority females than
Caucasian females. As for the males, we see mostly Caucasians.
Then again, it seems like more minorities are participating in
state politics (Texas House of Representatives). As for the
Texas Senate, there are about eight minorities out of 31
members. Of the 31 members, there are nine female members in
total. Not only that, only one female representative is not
Caucasian (The Texas Senate). Even though there are more
Caucasians in both the Senate and House of Representatives,
that does not mean we should start adding more females and
people of color. This information shows that each minority race
has a fewer population than the other. Once you have more
representatives who are either females or minorities, each
district population will not feel underrepresented.
Based on the statistics that each one has provided, we can see
how the legislature is not representative of the people of Texas.
Not only that, Mora pointed out that women and people of color
are underrepresented, which means they did not provide enough
representation to the people of Texas.
Representation can be defined by what the U.S. Supreme Court
stated when they “rejected the analogy to the U.S. Senate,
which is based on geographic units'' (Mora). They explained,
“Legislators represent people, not trees or acres. Legislators are
elected by voters, not farms or cities or economic interests''
(Mora). Not only that, “legislative apportionment most often
resulted in equity” of representation during most of the 19th
century (Mora). What this means is that each representative
represents an equal number of citizens. With that information
provided, we can define representation as
legislators fairly representing an equal number of citizens of
Texas. Mora also provided other information that supports what
I said: “In April 2016, the Supreme Court unanimously rejected
this challenge, asserting that ‘total-population apportionment
promotes equitable and effective representation'” (Mora). By
“this challenge”, she was referring to a case in Evenwel v.
Abbott. The plaintiffs of the case argued that the “one person,
one vote” rule would become violated if the practice of making
legislative districts were to become equal in terms of total
populations (Mora). Instead, they argued that there should be
“an equal number of eligible voters in each district” (Mora).
This challenge got rejected, and they stated that “total -
population apportionment” encourages fair representation.
I suppose the only reform necessary to make the legislature
more representative would be to add more seats to the House of
Representatives of Texas. This way, we will likely have more
females and people of color representing each citizen of Texas.
There are large numbers of representatives who are Caucasians
and male, according to the statistics. With the increase of
females and people of color, it might make the legislature more
representative. In Texas, there are 31 state senators. Therefore,
there are 31 single-member state senate districts. There are also
150 members in the House of Representatives. Hence, there are
150 single-member, state house districts (Mora). The only
reform that would be necessary and acceptable would be the
Texas House of Representatives. In Texas, the constitution
prohibits any county from having more than one senator, no
matter how large the population is (Mora). With that
information in mind, we can see why increasing the House of
Representatives of Texas would be an alternate solution in
making the legislature more representative.
There is another piece of information I would like to share.
Mora wrote, “From 1876 until the 1920s, the Texas legislature
made an effort to reapportion the seats after each census. This
process was made easier by the addition of one seat for each
increase of 50,000 in the population” (Mora). However, there
were no seats added because the legislature failed “to
reapportion legislative seats” (Mora). By 1948, “Texas
legislative seats had not changed since 1921” even though a
large population shifted from rural to urban areas. Because of
this, “most urban counties were vastly underrepresented”
(Mora). The creation of the Legislative Redistricting Board
forced the legislature to act in 1951 and 1961. Representation
shifted from rural to urban areas, but large urban counties were
still underrepresented. Part of this was because of the 1936
amendment to the Texas Constitution. It limited “the number of
representatives any county could have to seven until the
population reached 700,000” (Mora).
The county could add one extra representative for each 100,000
population. The problem with this is that each county would
have more representatives. Which means each county would not
have an equal number of representatives. It may not work well
if we try to add a seat to each district since each county has a
different population size. If we use the method from 1876-
1920s, where one seat gets added for every increase of 50,000,
we can see that we would have had about 579 representatives
total in 2019, with a population of 28,995,881. It may not be
accurate, but it is the estimation of what it would be if they
began to add seats for every population increase of 50,000. We
see it has more than 150 members, including the Texas counties.
There are 254 counties in Texas. However, they can change it to
where two representatives will represent a county. The problem
with this solution is that there will be additional members,
which would be 71. For that reason, instead of 579, it should be
508. That way, each county would have two representatives
representing their county. Another issue with this would be
having 508 state house districts, which sounds impossible since
we have 254 counties. Also, representatives are representing an
equal number of populations in each district and not each
county. Redistricting the state to 508 house districts would be
ridiculous, and it will be small in size. Another reform I thought
of was keeping the 150 state house districts but doubling the
members of the House of Representatives. Again, the issue with
this would be to change the Texas Constitution, which is not
happening. There is only one solution that might work: 300
Texas House members and 300 state house districts. It might be
a better solution to the legislature. With a total number of 300
members in the House, there might be an increase in females
and people of color who will represent the citizens of their
district. With 150 members of the Texas House, they each
represented about 193,306 people. However, with 300 members,
it will reduce it down to 96,653 people. Each citizen might
become delighted to see diversity in the legislature. Some
citizens may feel relieved to see a member of the same color
representing their race, including women representing the
female community. Each member of the representatives may
have a small district size, but the point is to see the legislatures
being more representative of the people of Texas. Not only that,
each representative needs to represent an equal number of
citizens of the total population. For that reason, increasing the
number of members of the House of Representatives in Texas by
a double would make sense. Increasing the number of members
and districts would also mean redistricting the state.
Of course, that idea may have drawbacks in some ways. Sherri
Mora explained that “the size of legislatures raises several
issues” (Mora). One reason is “statewide interests might go
unrepresented” (Mora). Another reason is that “they can become
inefficient at decision making or, in part because of that
inefficiency, be dominated by a few members, especially
legislative leaders” (Mora). These are just possibilities of what
would happen if we have larger legislatures. Again, the benefit
would be to become more representative of Texas. After all,
when you look at the members of the House of Texas, a large
number of them are male and Caucasians. Doubling the seats
and districts might be a way of keeping the citizens at ease and
content. Hopefully, the drawbacks do not become too severe.
Question 3
I believe smaller constituencies might allow a large number of
people to participate in state politics. The reason for this is
because I previously mentioned that the solution to making the
legislature more representative is to add more seats, which
means doubling the members of the Texas House of
Representatives to 300 members. In The State of Texas:
Government, Politics, and Policy, Sherri Mora wrote that
“…larger bodies would ensure that the senate and especially the
house would be more democratic and closer to the people
because each state legislator would represent fewer constituents
and a smaller geographic area” (Mora). For that reason, we can
see why larger bodies, meaning more members for the Texas
House of Representatives, may become a better solution to not
only become more representative but also have fewer
constituencies for each member to represent. In 2010, the
population was 25,145,561, and each House member represents
167,637 people. Not only that, there are 167,637 constituents
per legislative district (Mora). I mentioned before that we
should double the members of representatives to 300. With that
idea, we would be able to reduce that number down to about
83,818 people. This number would apply only in the year 2010.
However, this idea shows that there will be fewer constituencies
when we add more members to the Texas House of
Representatives. This reform will allow larger bodies to ensure
that the Senate and the House are closer to the people they
represent.
Mora also pointed out, “one member of the United States’
founding generation noted, smaller constituencies might also
allow a wider array of people to participate in state politics,
rather than just the ‘rich’ or ‘well born’” (Mora). It may be
outdated since they said this around the 1700s, and they did not
have as many populations as we currently do. However, they are
still members of the United States’ founding generation, and
one member agrees that smaller constituencies might allow a
wide variety of people to participate in state politics. Who
knows, with fewer constituencies, we might have someone
participating in state politics who is not “rich” or “well -born”. I
feel like the reason why the “rich” or “well-born” participate in
state politics is that they have enough funds for traveling,
campaigning, and advertising. As for those who may not have
enough funds, they may still participate in state politics with
the help of their supporters, who would be considered their
campaign team. With enough funds, the person participating in
state politics will run well and possibly win. It all depends on
how they plan it.
There is also another reason why larger bodies would be a better
idea. Mora said that “large bodies might better promote the
representation of local concerns and diverse interests within the
state” (Mora). This statement reveals that this might encourage
the Representatives to become more representative towards
local concerns. Not only that, there will be a variety of interests
within the state, which would also include state politics.
Question 4
I feel like race should be taken into consideration whenever
they redistrict Texas. Looking back at the presentation
from Texas Demographic Center, there is a chart, titled
“Race/Ethnicity Composition, Texas, 2010-2019”. There, we see
a big difference in the number of races/ethnicities of each
population group. In the year 2019, the estimated population of
non-Hispanic (NH) Whites was 11,950,774. As I mentioned
before, Hispanics are the largest minority population of Texas,
totaling 11,525,578. As we go on, we see that NH African-
American is 3,501,610, which is about 8 million less than what
whites and Hispanics have. We also see that NH Asians are at a
population of 1,457,549. The chart also included “NH Two or
More Races”, which is at 425,866. Lastly, we see that NH
American Indian and Alaska Native and NH Native Hawaiian
and Other Pacific Islander are at about 94,000 or less for
population size (Texas Demographic Center). Based on the
estimated population size of 2019, we see that certain
races/ethnicities are far less than the others. The minority
groups are underrepresented because of this issue. For this
reason, they should take race/ethnicity into consideration for
redistricting. It will help in not only representing the minority
but also gaining trust and support from them.
I want to point out information about redistricting and
gerrymandering. According to an article from The Texas
Tribune, written by Yasmeen Khalifa, the census is a way to
count every resident in the United States every ten years
(Khalifa). "After that, state and local governments use the new
population data to draw new congressional and state legislative
maps” (Khalifa). She said, “The point is to draw roughly
equally populated districts to reflect population growth and
guarantee equal voter representation” (Khalifa). Even though
they are drawn “roughly equally” for each representative to
represent, the people of color might feel as if they are not
receiving enough representation. Gerrymandering might be the
reason behind this issue. According to a video from KSAT
Explains, titled “Episode 23: Redrawing the Maps”, Nina
Perales, who works for the Mexican American Legal Defense
and Educational Fund organization, said that “Gerrymandering
is a term that people came up with to describe when district
lines are drawn in a way that somebody considers to be unfair”
(KSAT Explains).
According to what Sherri Mora wrote in The State of Texas:
Government, Politics, and Policy, she said that in the case
of Bush v. Vera, the Supreme Court “did not object to states’
considering race when drawing district lines or to their
intentionally creating majority-minority districts; however,
using race as the predominant factor in drawing districts, while
subordinating other considerations, was found to be
unconstitutional” (Mora). This means that using gerrymandering
tactics only for racial matters would be wrong and
unconstitutional. She also wrote that “the U.S. Supreme Court,
in Hunt v. Cromartie, allowed the use of political
gerrymandering in drawing legislative districts in April 1999”
(Mora). The Court discovered that “drawing district boundaries
based on political affiliation or partisan makeup was justifiable
and constitutional. Therefore, creating a ‘safe’ Democratic or
Republican seat was permissible” (Mora). Mora also said that
creating legislative districts based only on “racial
considerations” is prohibited, even though “political party
affiliation and race” are often matched up (Mora). Using
gerrymandering only towards race is unconstitutional. However,
we also found out what Mora wrote. She wrote that the Supreme
Court did not oppose the states’ consideration of race when they
drew district lines or intentionally created majority-minority
districts. It looks like they will find ways to use gerrymandering
for not only political party advantage but for racial matters as
well.
Another piece of information I found in the KSAT
Explain video was from a UTSA Associate Professor of
Political Science named Walter Wilson, PhD. He said, “In an
ideal world, I think that we would see congressional districts
that attempt to represent communities of interest and the idea
that regions and cities would all be represented by a voice in
Congress. But instead, what we frequently see is an effort to
either group certain kinds of voters together or divide them”
(KSAT Explain). Even though they divided them into groups
based on political party advantage, there is a possibility that
race is also a factor in this tactic. In the same video, Nina
Perales explains the issue with unfair redistricting: “When you
have unfair redistricting, anybody can be hurt by that. It could
be that lines are drawn to disadvantage rural voters or
disadvantage urban voters. Sometimes lines can be drawn to
disadvantage racial minorities” (KSAT Explain). That last
statement reveals how minorities are at a disadvantage for this
tactic. For that reason, they are underrepresented.
Going back to The Texas Tribune article, Khalifa also
mentioned another piece of informa tion involving the people of
color for voting. She said, “The state has been dealing with the
legal implications of the 2011 redistricting maps that ended up
being rejected by the federal government. Following explosive
population growth in Texas, particularly among Hispanic
residents, the state gained four seats in Congress that cycle”
(Khalifa). Instead of creating a district with “a Black and
Hispanic majority that could have made their seats safer in a
Democratic wave election”, the Republicans chose to keep
“their numbers in Dallas County and purposefully diluted the
voting strength of voters of color in the Texas House map and
in several congressional districts” (Khalifa). This temporarily
sparked. The replacement maps were considered
"discriminatory" in some ways (Khalifa). She also said that the
state Republicans positioned themselves to establish their power
further because "they held onto their 20-year majority in the
recent election” (Khalifa). However, the voting rights groups
will likely raise concerns “that the cost of the retrenchment will
be the continued disenfranchisement of voters of color”
(Khalifa). As we can see, this issue has led to the denial of the
rights that the voters of color have, which would be the right to
vote. Overall, I feel like race needs consideration when
redistricting because it would be fair to the people of color,
especially their voting rights. Furthermore, it would allow the
legislatures to become more representative of the people of
Texas.
After reading and providing the evidence to support my view, I
believe that redistricting is an appropriate tool in representing
the minority or underserved populations, only if gerrymandering
is unused against minorities. As I mentioned before, even
though gerrymandering is effective for political party
advantages, there is a possibility that the people of color will
not be taken into consideration and represented. We see the
concerns that the voting rights groups have for what the
Republicans have done. Nina Perales mentioned that lines can
sometimes be drawn to disadvantage racial minorities. In
the Bush v. Vera case, Sherri Mora said that the Supreme Court
did not oppose the states’ consideration of race when they drew
district lines or intentionally created majority-minority districts.
The Court said it was unconstitutional to use race as a primary
factor in drawing the districts. Then again, they can still use
gerrymandering for not only political party advantage but for
racial advantage. It may get approved for drawing districts that
are at a political party advantage. However, each house district
has a different population for certain minorities. That is why I
agree redistricting is an appropriate tool to provide
representations for minority or underserved populations.
Minorities have worked hard in having equal rights, which
means they also deserve to have equal representation. However,
if gerrymandering is involved, especially when it goes against
minorities, then redistricting will become an issue for that
matter. I should also point out that it is considered unfair for
some citizens since gerrymandering will always lead to a
political party over another. If that is the case, then
gerrymandering should not be used or involved in the
redistricting process.
Student Name:
One of the best ways to deepen mathematical understanding is
by writing. When you try to articulate the process, your mind
connects the concepts at a higher level.
For many of the projects or assignments in this class, you will
submit a write-up based on discussion questions and your
mathematical thinking process. Because this write-up includes
writing and math, it is called a WAM. Your WAM can be fun
and creative, and must be in complete sentences.
What To Do:
In this project, you will be analyzing patterns from an
input/output machine to find a pattern and function rule.
Instructions
View the rubric below to see how this Assignment will be
graded. Then follow the instructions below to complete and
submit this Assignment.
1. Open the “Function Machine” game at this website.
2. Click on “Advanced”. Start at Activity Level 1. You will
enter your input by clicking on “You Decide the Input” and the
machine will provide an output.
3. Enter five inputs and share your table below:
Input (x)
Output (y)
2
1
4
3
6
5
8
7
10
70
4. Share the rule for your function above:
5. Start a new function! Change the Activity Level to 2.
6. Enter five inputs and share your table below:
Input (x)
Output (y)
2
-1
4
3
6
7
8
11
10
15
7. Share the rule for your function above:
8. Start a new function! Change the Activity Level to 3.
9. Enter five inputs and share your table below:
Input (x)
Output (y)
2
72
4
82
6
92
8
102
10
112
10. Share the rule for your function above:
11. WAM Write-up: In your slides, write a paragraph describing
your mathematical thinking. Please use the following questions
as prompts to guide your answer:
a. What strategies did you use in your mathematical thought
process?
b. What new knowledge did you gain?
c. What caused you to think about mathematics at a deeper
level?
d. How was your curiosity sparked by this assignment?
e. How does this connect to what we've learned in class/before?
f. How did you determine the answer?
g. What mathematical questions are you still curious about?
Demographic Trends and Population Projections
for Texas and the North Texas Region
Presented to
January 15, 2021
Texas is
experiencing
significant and
substantial
growth.
3
U.S. Estimated Population 2020:
329,484,123
Texas Estimated Population 2020:
29,360,759
Texas makes up 8.9% of the total U.S. population but 32.4% of
the
total growth between 2019 and 2020.
Source: U.S. Census Bureau, 2020 Vintage population estimates
Note: These data are not from the 2020 Census, rather estimates
based on the 2010 Census
4
Population Growth of Select States, 2000-2019
2000
Population
2010
Population
2019
Population
Numeric
Change
2010‐ 2019
Percent
Change
2010‐ 2019
United States 281,421,906 308,745,538 32,823,9523 19,481,418
6.3%
Texas 20,851,820 25,145,561 28,995,881 3,849,790 15.3%
California 33,871,648 37,253,956 39,512,223 2,257,704 6.1%
Florida 15,982,378 18,801,310 21,477,737 2,673,173 14.2%
Georgia 8,186,453 9,687,653 10,617,423 928,694 9.6%
North Carolina 8,049,313 9,535,483 10,488,084 952,333 10.0%
Washington 5,894,121 6,724,540 7,614,893 890,353 13.2%
Arizona 5,130,632 6,392,017 7,278,717 886,429 13.9%
Colorado 5,029,196 5,029,196 5,758,736 729,417 14.5%
Texas adds more population than any other state and at a fast
rate.
Source: U.S. Census Bureau, 2000 and 2010 Decennial Census;
2019 Vintage population estimates
Top 15 Metros in Numeric Growth, 2010‐ 2019
Rank Name April 1, 2010 July 1, 2018 July 1, 2019
Numeric
Change
Percent
Change
1 Dallas‐ Fort Worth‐ Arlington, TX 6,366,537 7,455,756
7,573,136 1,206,599 19.0
2 Houston‐ The Woodlands‐ Sugar Land, TX 5,920,487
4,849,209 7,066,141 1,145,654 19.4
3 Phoenix‐ Mesa‐ Chandler, AZ 4,193,129 4,849,209 4,948,203
755,074 18.0
4 Atlanta‐ Sandy Springs‐ Alpharetta, GA 5,286,718 6,976,147
6,020,364 733,646 13.9
5 Washington‐ Arlington‐ Alexandria, DC‐ VA‐ MD‐ WV
5,649,688 5,945,303 6,280,487 630,799 11.2
6 Miami‐ Fort Lauderdale‐ Pompano Beach, FL 5,566,274
6,143,837 6,166,488 600,214 10.8
7 Seattle‐ Tacoma‐ Bellevue, WA 3,439,808 3,935,179
3,979,845 540,037 15.7
8 Austin‐ Round Rock‐ Georgetown, TX 1,716,323 2,165,497
2,227,083 510,760 29.8
9 Orlando‐ Kissimmee‐ Sanford, FL 2,134,399 2,574,838
2,608,147 473,748 22.2
10 Riverside‐ San Bernardino‐ Ontario, CA 4,224,948
4,612,542 4,650,631 425,683 10.1
11 Denver‐ Aurora‐ Lakewood, CO 2,543,608 2,931,665
2,967,239 423,631 16.7
12 Tampa‐ St. Petersburg‐ Clearwater, FL 2,783,485 3,154,649
3,194,831 411,346 14.8
13 San Antonio‐ New Braunfels, TX 2,142,520 2,512,379
2,550,960 408,440 19.1
14 San Francisco‐ Oakland‐ Berkeley, CA 4,335,593 4,726,314
4,731,803 396,210 9.1
15 Charlotte‐ Concord‐ Gastonia, NC‐ SC 2,243,963 2,592,950
2,636,883 392,920 17.5
5
Source: U.S. Census Bureau, 2019 Vintage Population Estimates
DFW leads nation in metro growth for the 4th year in a row.
Five of the 15 largest U.S. cities are in Texas.
Rank Place Census 2010 2011 2012 2013 2014 2015 2016 2017
2018 2019
1 New York, NY 8,175,133 8,272,948 8,346,693 8,396,091
8,433,806 8,463,049 8,469,153 8,437,478 8,390,081 8,336,817
2 Los Angeles, CA 3,792,621 3,820,876 3,851,202 3,881,622
3,909,901 3,938,568 3,963,226 3,975,788 3,977,596 3,979,576
3 Chicago, IL 2,695,598 2,708,114 2,719,141 2,725,731
2,727,066 2,724,344 2,716,723 2,711,069 2,701,423 2,693,976
4 Houston, TX 2,099,451 2,126,032 2,161,593 2,199,391
2,241,826 2,286,908 2,309,544 2,316,750 2,318,573 2,320,268
5 Phoenix, AZ 1,445,632 1,469,796 1,499,274 1,526,491
1,555,445 1,583,690 1,612,199 1,633,560 1,654,675 1,680,992
6 Philadelphia, PA 1,526,006 1,540,466 1,551,824 1,558,313
1,565,460 1,571,065 1,576,051 1,580,601 1,583,592 1,584,064
7 San Antonio, TX 1,327,407 1,357,120 1,383,075 1,408,339
1,435,456 1,464,043 1,487,843 1,511,154 1,530,016 1,547,253
8 San Diego, CA 1,307,402 1,319,592 1,336,776 1,355,320
1,375,831 1,387,323 1,402,089 1,412,621 1,421,917 1,423,851
9 Dallas, TX 1,197,816 1,218,282 1,242,115 1,258,835
1,279,098 1,301,329 1,323,916 1,342,479 1,341,802 1,343,573
10 San Jose, CA 945,942 970,369 983,530 1,001,279 1,014,273
1,025,980 1,030,242 1,032,335 1,028,020 1,021,795
11 Austin, TX 790,390 828,459 854,482 875,003 901,170
921,114 939,447 951,553 962,469 978,908
12 Jacksonville, FL 821,784 829,609 837,013 842,735 852,494
865,836 880,520 892,025 902,437 911,507
13 Fort Worth, TX 741,206 764,142 781,046 796,073 815,057
835,356 856,177 874,809 893,216 909,585
14 Columbus, OH 787,033 800,607 812,740 827,797 841,673
854,950 866,894 881,694 890,869 898,553
15 Charlotte, NC 731,424 754,829 773,264 792,047 807,400
825,668 843,117 860,002 872,514 885,708
Source: U.S. Census Bureau, 2019 Vintage Population Estimates
6
Rank Geographic Area
Population Estimate Change, 2018 to 2019
July 1, 2018 July 1, 2019 Number Percent
1 Phoenix, AZ 1,654,675 1,680,992 26,317 1.6
2 San Antonio, TX 1,530,016 1,547,253 17,237 1.1
3 Austin, TX 962,469 978,908 16,439 1.7
4 Fort Worth, TX 893,216 909,585 16,369 1.8
5 Charlotte, NC 872,514 885,708 13,194 1.5
6 Frisco, TX 188,452 200,490 12,038 6.4
7 Seattle, WA 742,235 753,675 11,440 1.5
8 Denver, CO 716,265 727,211 10,946 1.5
9 Henderson, NV 309,518 320,189 10,671 3.4
10 Mesa, AZ 507,945 518,012 10,067 2.0
11 Jacksonville, FL 902,437 911,507 9,070 1.0
12 Chico, CA 94,342 103,301 8,959 9.5
13 Atlanta, GA 498,183 506,811 8,628 1.7
14 Las Vegas, NV 643,228 651,319 8,091 1.3
15 Meridian, ID 106,464 114,161 7,697 7.2
7
Source: U.S. Census
Bureau, 2019 Vintage Population Estimates; Note: among places
with populations of 50,000 or more in 2018
Texas cities among top 15 US cities with largest numeric
increase
between 2018 and 2019.
Rank Geographic Area
Population Estimate Change, 2018 to 2019
July 1, 2018 July 1, 2019 Number Percent
1 Leander, TX 55,924 62,608 6,684 12.0
2 Apex, NC 53,859 59,300 5,441 10.1
3 Chico, CA 94,342 103,301 8,959 9.5
4 Doral, FL 60,762 65,741 4,979 8.2
5 Bentonville, AR 51,103 54,909 3,806 7.4
6 Meridian, ID 106,464 114,161 7,697 7.2
7 Georgetown, TX 74,275 79,604 5,329 7.2
8 Buckeye, AZ 74,339 79,620 5,281 7.1
9 New Braunfels, TX 84,495 90,209 5,714 6.8
10 Redmond, WA 67,436 71,929 4,493 6.7
11 Frisco, TX 188,452 200,490 12,038 6.4
12 Fort Myers, FL 82,229 87,103 4,874 5.9
13 Lehi, UT 65,958 69,724 3,766 5.7
14 Castle Rock, CO 65,000 68,484 3,484 5.4
15 Milpitas, CA 80,208 84,196 3,988 5.0
8
Source: U.S. Census
Bureau, 2019 Vintage Population Estimates; Note: among places
with populations of 50,000 or more in 2018
Nearly a third of the 15 fastest-growing large cities and towns
in
the country are in Texas.
Population and
population growth
in Texas are not
evenly
geographically
distributed.
10,000 or less
10,001 - 50,000
50,001 - 100,000
100,001 - 500,000
500,001 - 1,000,000
1,000,001 - 6,000,000 plus
Cartogram of Texas County Populations
in 2010
10
Pecos
Brewster
Webb
Hudspeth
Presidio
Terrell
Reeves
Val Verde
Crockett
Duval
Harris
Hill
Frio
Bell
Kenedy
Kerr
Starr
Polk
Clay
Jeff Davis
Irion
Uvalde
Sutton
Hall
Ellis
Dallam
Gaines
Bexar
Hidalgo
Leon
Hale
Bee
Hartley
Upton
Kinney
Erath
Brazoria
King
Oldham
Zavala
Dimmit
Jack Kent
Gray
Cass
Kimble
Lynn Wise
Lamb Floyd
Andrews
Terry
Coke
Llano
Milam
Travis
Ector
Knox
Falls
Collin
Nueces
Ward
Bowie
Kleberg
Foard
Culberson
Edwards
La Salle
Tyler
Medina
Hunt
Rusk
Liberty
Smith
Mills
Lee
Matagorda
Jones
Burnet
Nolan
Potter
Zapata
Cottle
Taylor
Coryell Reagan Houston
Motley
Brown
Young
Maverick
Lamar
Real
Martin
Coleman
Garza
Dallas
Jasper
Fisher
Tom Green
Moore
Cameron
Baylor
Deaf Smith
Archer
Scurry
Mason
Cooke
Navarro
Parker
Castro
Brooks
Atascosa
Hardin
DeWitt
Lavaca
Bailey
Donley
Bosque El Paso
Denton
Goliad
Wharton
Fannin
Runnels
Concho
Tarrant
Hays
Fayette
Carson
Schleicher
Crosby
Crane
Borden
Calhoun
Gillespie
Haskell
Newton
Live Oak
Jefferson
McMullen
Jim Hogg
Randall
Sterling
Briscoe
Shelby
Mitchell
Parmer
Victoria
Wilson
Roberts
Menard
San Saba
Howard
Wood
Panola
Grayson
Trinity
Bastrop
Walker
Midland
Gonzales
Hockley
Anderson
Dickens
Swisher
Winkler
Dawson
Cherokee
Wheeler
Willacy
Grimes
Harrison
Colorado
Red River
Eastland
Lubbock
Williamson
Hemphill
Refugio
Karnes
Jackson
McCulloch
Ochiltree
Wilbarger
Austin
Sherman
McLennan
Hansford
Blanco
Callahan
Loving
Yoakum
Angelina
Lipscomb
Stephens
Hopkins
Palo Pinto
Stonewall
Montague
Hamilton
Bandera
Jim Wells
Cochran
Limestone
Fort Bend
Kaufman
Armstrong
Freestone
Comanche
Montgomery
Glasscock
Kendall
Henderson
Galveston
Comal
Johnson
Van Zandt
Wichita
Chambers
Titus
Robertson
Brazos
Hutchinson
Sabine
Upshur
Waller
Shackelford
Hood
Childress
Burleson
Nacogdoches
Collingsworth
Lampasas
Throckmorton
Hardeman
Guadalupe
Caldwell
Aransas
Marion
San Patricio
Madison
San Jacinto
Delta
Orange
Rains
Gregg
San Augustine
Morris
Franklin
Somervell
Rockwall
169 - 10,000
10,001 - 100,000
100,001 - 500,000
5000,001 - 2,000,000
2,000,001 - 4,713,325
Approximately 86% of the total Texas population is located in
counties along and to the east of I-35.
Source: U.S. Census Bureau, 2019 Population Estimates
Total Estimated Population by
County, 2019
11
Of Texas’ 254 counties, 104 lost population between 2010 and
2019.
Source: U.S. Census Bureau, 2019 Population Estimates
-3,663 - 0
1 - 5,000
5,001 - 25,000
25,001 - 100,000
100,001 - 620,149
Pecos
Brewster
Webb
Hudspeth
Presidio
Terrell
Reeves
Val Verde
Crockett
Duval
Harris
Hill
Frio
Bell
Kenedy
Kerr
Starr
Polk
Clay
Jeff Davis
Irion
Uvalde
Sutton
Hall
Ellis
Dallam
Gaines
Bexar
Hidalgo
Leon
Hale
Bee
Hartley
Upton
Kinney
Erath
Brazoria
King
Oldham
Zavala
Dimmit
Jack Kent
Gray
Cass
Kimble
Lynn Wise
Lamb Floyd
Andrews
Terry
Coke
Llano
Milam
Travis
Ector
Knox
Falls
Collin
Nueces
Ward
Bowie
Kleberg
Foard
Culberson
Edwards
La Salle
Tyler
Medina
Hunt
Rusk
Liberty
Smith
Mills
Lee
Matagorda
Jones
Burnet
Nolan
Potter
Zapata
Cottle
Taylor
Coryell Reagan Houston
Motley
Brown
Young
Maverick
Lamar
Real
Martin
Coleman
Garza
Dallas
Jasper
Fisher
Tom Green
Moore
Cameron
Baylor
Deaf Smith
Archer
Scurry
Mason
Cooke
Navarro
Parker
Castro
Brooks
Atascosa
Hardin
DeWitt
Lavaca
Bailey
Donley
Bosque El Paso
Denton
Goliad
Wharton
Fannin
Runnels
Concho
Tarrant
Hays
Fayette
Carson
Schleicher
Crosby
Crane
Borden
Calhoun
Gillespie
Haskell
Newton
Live Oak
Jefferson
McMullen
Jim Hogg
Randall
Sterling
Briscoe
Shelby
Mitchell
Parmer
Victoria
Wilson
Roberts
Menard
San Saba
Howard
Wood
Panola
Grayson
Trinity
Bastrop
Walker
Midland
Gonzales
Hockley
Anderson
Dickens
Swisher
Winkler
Dawson
Cherokee
Wheeler
Willacy
Grimes
Harrison
Colorado
Red River
Eastland
Lubbock
Williamson
Hemphill
Refugio
Karnes
Jackson
McCulloch
Ochiltree
Wilbarger
Austin
Sherman
McLennan
Hansford
Blanco
Callahan
Loving
Yoakum
Angelina
Lipscomb
Stephens
Hopkins
Palo Pinto
Stonewall
Montague
Hamilton
Bandera
Jim Wells
Cochran
Limestone
Fort Bend
Kaufman
Armstrong
Freestone
Comanche
Montgomery
Glasscock
Kendall
Henderson
Galveston
Comal
Johnson
Van Zandt
Wichita
Chambers
Titus
Robertson
Brazos
Hutchinson
Sabine
Upshur
Waller
Shackelford
Hood
Childress
Burleson
Nacogdoches
Collingsworth
Lampasas
Throckmorton
Hardeman
Guadalupe
Caldwell
Aransas
Marion
San Patricio
Madison
San Jacinto
Delta
Orange
Rains
Gregg
San Augustine
Morris
Franklin
Somervell
Rockwall
Estimated Numeric Change by County,
2010‐ 2019
Pecos
Brewster
Webb
Hudspeth
Presidio
Culberson
Terrell
Reeves
Val Verde
Crockett
Duval
Harris
Hill
Frio
Bell
Kenedy
Kerr
Edwards
Starr
Polk
Clay
Jeff Davis
Irion
Uvalde
Sutton
Hall
Ellis
Dallam
Gaines
Bexar
Hidalgo
Leon
Hale
Bee
Hartley
Upton
Kinney
Erath
Brazoria
King
Oldham
Zavala
Dimmit
Jack Kent
La Salle
Tyler
Gray
Cass
Medina
Kimble
Lynn Wise Hunt
Rusk
Lamb Floyd
Andrews
Liberty
Terry
Coke
Llano
Milam
Travis
Ector
Smith
Knox
Mills
Lee
Falls
Collin
Nueces
Jones
Ward
Burnet
Nolan
Potter
Cottle
Taylor
Coryell
Bowie
Motley
Young
Lamar
Real
Martin
Garza
Dallas Fisher
Moore
Kleberg
Cameron
Baylor
Deaf Smith
Archer
Scurry
Mason
Cooke
Navarro
Parker
Castro
Hardin
Donley
El Paso
Denton
Goliad
Fannin
Schleicher
Gillespie
Shelby
Menard
Foard
Wood
Panola
Harrison
Eastland
Bandera
Matagorda
Zapata
Reagan Houston
Brown
Maverick
Coleman
Jasper
Tom Green
Brooks
Atascosa
DeWitt
Lavaca
Bailey
Bosque
Wharton
Runnels
Concho
Tarrant
Hays
Fayette
Carson
Crosby
Crane
Borden
Calhoun
Haskell
Newton
Live Oak
Jefferson
McMullen
Jim Hogg
Randall
Sterling
Briscoe
Mitchell
Parmer
Victoria
Wilson
Roberts
San Saba
Howard
Grayson
Trinity
Bastrop
Walker
Midland
Gonzales
Hockley
Anderson
Dickens
Swisher
Winkler
Dawson
Cherokee
Wheeler
Willacy
Grimes
Colorado
Red River
Lubbock
Williamson
Hemphill
Refugio
Karnes
Jackson
McCulloch
Ochiltree
Wilbarger
Austin
Sherman
McLennan
Hansford
Blanco
Callahan
Loving
Yoakum
Angelina
Lipscomb
Stephens
Hopkins
Palo Pinto
Stonewall
Montague
Hamilton
Jim Wells
Cochran
Limestone
Fort Bend
Kaufman
Armstrong
Freestone
Comanche
Montgomery
Glasscock
Kendall
Henderson
Galveston
Comal
Johnson
Van Zandt
Wichita
Chambers
Titus
Robertson
Brazos
Hutchinson
Sabine
Upshur
Waller
Shackelford
Hood
Childress
Burleson
Nacogdoches
Collingsworth
Lampasas
Throckmorton
Hardeman
Guadalupe
Caldwell
Aransas
Marion
San Patricio
Madison
San Jacinto
Washington
Delta
Orange
Rains
Gregg
San Augustine
Morris
Franklin
Camp
Somervell
Rockwall
12
The suburban ring counties are among the fastest growing, even
faster than the Texas population as a whole.
Source: U.S. Census Bureau, 2019 Population Estimates
-33% - -5%
-4% - 0%
1% - 15%
16% - 31%
32% - 106%
Estimated Percent Change by County,
2010‐ 2019
What is driving
population growth
in Texas?
14
About 1,006 people per day added to our population.
• About 483 persons per day from natural increase
(more births than deaths)
• About 523 per day from net migration (178
international and 345 domestic migrants per
day).
Natural
Increase
48%Domestic
Migration
34%
International
Migration
18%
Texas added 367,215 people between July 1, 2018 and July 1,
2019.
Source: U.S. Census Bureau, 2018 Population Estimates.
15
213,651 208,964 205,795 213,541 214,380 212,021 209,690
190,951 175,878
70,535 76,954 82,449
95,661 110,155 111,983 110,417
104,976
65,044
117,615
145,513
110,614
163,160
174,200
125,800
79,163
82,569
125,660
0
50,000
100,000
150,000
200,000
250,000
300,000
350,000
400,000
450,000
500,000
2011 2012 2013 2014 2015 2016 2017 2018 2019
Components of Population Change, 2011‐ 2019
Natural Increase International Migration
Domestic Net Migration
Migration and natural increase contribute about equally to
population growth
in Texas.
Source: U.S. Census Bureau, 2019 Vintage population estimates
16
Top Counties for Numeric Growth in Texas, 2018-2019
County
U.S.
Rank
2019 Population
Estimate
Population Change
2018‐ 2019
Percent of Change
from Natural
Increase
Percent of Change
from Domestic
Migration
Percent of Change
from International
Migration
Harris 3 4,713,325 33,280 116.5% ‐ 91.5% 74.8%
Collin 4 1,034,730 30,423 20.8% 65.6% 13.5%
Denton 5 887,207 28,466 19.8% 74.0% 5.8%
Travis 6 1,273954 27,382 32.7% 51.0% 15.7%
Williamson 9 590,551 24,088 15.3% 81.0% 3.3%
Fort Bend 10 811,688 23,607 24.4% 57.1% 18.5%
Bexar 11 2,003,554 22,367 56.0% 33.5% 10.5%
Tarrant 12 2,102,515 21,069 65.1% 12.1% 23.0%
Montgomery 16 607,391 17,621 18.3% 76.2% 5.3%
Comal 46 156,209 8,068 4.3% 94.2% 1.1%
Kaufman 49 136,154 7,875 9.4% 90.5% ‐ 0.1%
Bell 53 362,924 7,527 48.3% 49.8% 1.5%
Hays 54 230,191 7,485 19.9% 76.8% 2.8%
Hidalgo 74 868,707 6,409 147.6% ‐ 47.4% ‐ 0.3%
Dallas 77 2,635,516 6,166 345.9% ‐ 395.5% 149.9%
Source: U.S. Census Bureau, 2019 Population Estimates
Note: Harris, Dallas, and Hidalgo Counties had negative net mig
ration.
17
Top Counties for Percent Growth* in Texas, 2018-2019
County100 U.S. Rank
2019 Population
Estimate
Population
Change
2018‐ 2019
Percent
Population
Change
2018‐ 2019
Percent of
Population
Change from
Natural
Increase
Percent of
Population
Change from
Domestic
Migration
Percent of
Population
Change from
International
Migration
Kaufman 2 136,154 7,875 6.1% 9.4% 90.5% ‐ 0.1%
Comal 4 156,209 8,068 5.4% 4.3% 94.2% 1.1%
Rockwall 6 104,915 4,369 4.3% 9.8% 88.6% 1.5%
Williamson 9 590,551 24,088 4.3% 15.3% 81.0% 3.3%
Kendall 14 47,431 1,828 4.0% 0.6% 97.9% 1.5%
Andrews 18 18,705 694 3.9% 14.0% 84.0% 2.0%
Chambers 20 43,837 1,610 3.8% 17.8% 80.1% 2.2%
Parker 25 142,878 4,808 3.5% 8.2% 90.9% 0.7%
Hays 28 230,191 7,485 3.4% 19.9% 76.8% 2.8%
Denton 32 887,207 28,466 3.3% 19.8% 74.0% 5.8%
Ellis 34 184,826 5,820 3.3% 16.0% 83.2% 0.7%
Waller 36 55,246 1,734 3.2% 20.0% 78.4% 1.4%
Gaines 37 21,492 672 3.2% 46.0% 43.9% 10.0%
Collin 49 1,034,730 30,423 3.0% 20.8% 65.6% 13.5%
*Among counties with populations of 10,000 or more in 2018.
Source: U.S. Census Bureau, 2019 Population Estimates
Source: U.S. Census Bureau, State to State Migration Flows, 20
19; for infographic: https://demographics.texas.gov/Infographic
s/2020/TexasNetMigration
Texas among the highest in-migration flows states, CA biggest
net
sending state.
18
Estimated County-to-County Migration Flows, Dallas and
Tarrant
Counties, 2014-2018
19
In‐ Flows Net Migration
Tarrant County 15,284 ‐ 3,865
Collin County 13,742 ‐ 3,522
Denton County 9,826 ‐ 8,981
Asia 8,287
Central America 7,263
Harris County 4,589 ‐ 108
Los Angeles County, CA 2,782 1,245
Africa 2,774
Bexar County 2,495 988
Kaufman County 2,263 ‐ 3,033
Travis County 1,934 ‐ 1,071
Ellis County 1,903 ‐ 850
Rockwall County 1,893 ‐ 795
Cook County, IL 1,794 1,187
Source: U.S. Census Bureau, American Community Survey Cou
nty to County Migration Flows, 2014‐ 2018
Dallas County Tarrant County
In‐ Flows Net Migration
Dallas County 19,149 3,865
Asia 5,751
Denton County 5,265 ‐ 2,167
Johnson County 3,887 346
Central America 3,653
Harris County 3,577 963
Africa 2,693
Parker County 2,652 ‐ 953
Collin County 1,906 ‐ 707
Bexar County 1,659 222
Los Angeles County, CA 1,515 859
Travis County 1,352 ‐ 701
Lubbock County 1,333 ‐ 719
Wise County 1,270 ‐ 656
As Texas grows, it
ages and
continues to
diversify.
Race/Ethnicity Composition, Texas, 2010-2019
NH White
41%
NH
Black
12%
Hispanic
40%
NH Asian
5%
NH Other
2%
2019
NH White,
45%
NH
Black,
12%
NH Asian,
4%
NH Other,
2%
Hispanic,
38%
2010
Race/Ethnicity
2019
Population
Estimate
NH White 11,950,774
Hispanic 11,525,578
NH Black 3,501,610
NH Asian 1,457,549
NH Two or More Races 425,866
NH American Indian & Alaska Native 94,168
NH Native Hawaiian & Other Pacific Islander 25,861
Population Change by Race/Ethnicity, 2010-2019
2,064,657 601,726 522,136 497,006 164,795
53.6%
15.6%
13.6% 12.9%
4.3%
0.0%
10.0%
20.0%
30.0%
40.0%
50.0%
60.0%
0
500,000
1,000,000
1,500,000
2,000,000
2,500,000
Hispanic NH Black NH White NH Asian NH Other
Share of Contribution to Total Population Change, 2010‐ 2019
Numeric Change, 2010‐ 2019
Nearly 87% of growth has been from non‐ White
population groups.
Source: U.S. Census Bureau. 2019 Population Estimates
23
Race/Ethnicity Composition, DFW Metro and Its Counties, 2019
NH White
45%
NH Black
16%
NH Other
3%
NH Asian
7%
Hispanic
29%
DFW Metro Area
Source: U.S. Census Bureau, American Community Survey 2019
1‐ Year Estimates
NH White NH Black NH Asian Hispanic NH Other
Dallas 28.3% 22.7% 6.5% 40.8% 1.7%
Collin 55.1% 10.4% 16.1% 15.5% 2.8%
Denton 57.6% 10.5% 9.5% 19.6% 2.7%
Ellis 58.9% 11.6% 0.7% 26.9% 1.9%
Hood 83.5% 1.0% 0.8% 12.8% 1.9%
Hunt 70.4% 7.8% 1.4% 17.6% 2.7%
Johnson 70.1% 3.8% 0.9% 22.6% 2.6%
Kaufman 59.8% 13.3% 1.4% 23.3% 2.3%
Parker 82.6% 1.5% 0.6% 13.0% 2.3%
Rockwall 69.0% 7.1% 3.1% 18.6% 2.3%
Somervell 77.8% 1.0% 0.7% 18.1% 2.4%
Tarrant 45.3% 17.0% 5.6% 29.5% 2.6%
Wise 76.0% 1.3% 0.6% 20.0% 2.1%
Source: U.S. Census Bureau, 2019 Population Estimates
24
Total NH White NH Black NH Asian Hispanic NH Other
Tarrant County 293,481 13,761 94,029 34,131 136,733 14,827
Dallas County 267,377 ‐ 41,646 76,935 53,005 168,255 10,828
Collin County 252,389 75,245 42,600 78,797 45,282 10,465
Denton County 224,593 83,363 38,773 40,766 53,069 8,622
Ellis County 35,216 10,640 8,178 551 14,544 1,303
Kaufman County 32,804 9,003 7,550 948 14,115 1,188
Rockwall County 26,578 14,188 2,987 1,349 7,072 982
Parker County 25,951 18,276 269 248 6,197 961
Johnson County 24,883 7,441 2,807 608 12,444 1,583
Hunt County 12,465 4,997 713 468 5,632 655
Wise County 10,857 6,036 353 167 3,853 448
Hood County 10,461 6,843 395 200 2,664 359
Somervell County 638 478 39 25 27 69
Numeric Change by Race/Ethnicity, DFW Counties, 2010-2019
Source: U.S. Census Bureau, 2019 Population Estimates
Hispanics adding largest numbers in two largest DFW counties
as well as in Ellis, Kaufman, Johnson, and
Hunt Counties; NH Whites adding greatest numbers in Denton,
Rockwall, Parker, Wise, Hood, and
Somervell, but declining in Dallas County; Asians adding larges
t numbers in Collin County.
25
Total NH White NH Black NH Asian Hispanic NH Other
Rockwall County 33.9% 24.4% 67.5% 71.9% 56.7% 70.1%
Denton County 33.9% 19.5% 71.3% 93.2% 43.9% 55.0%
Collin County 32.3% 15.2% 65.4% 89.2% 39.3% 55.6%
Kaufman County 31.7% 12.4% 71.3% 106.0% 80.4% 63.0%
Ellis County 23.5% 10.8% 61.9% 66.6% 41.4% 58.0%
Parker County 22.2% 18.3% 14.6% 39.1% 49.9% 42.5%
Hood County 20.4% 15.3% 172.5% 66.4% 50.9% 45.4%
Wise County 18.4% 12.8% 61.6% 71.4% 38.1% 43.2%
Johnson County 16.5% 6.4% 73.3% 63.1% 45.6% 51.5%
Tarrant County 16.2% 1.5% 35.7% 40.6% 28.3% 38.1%
Hunt County 14.5% 7.8% 10.2% 51.3% 47.9% 32.6%
Dallas County 11.3% ‐ 5.3% 14.8% 44.4% 18.6% 30.9%
Somervell County 7.5% 7.2% 70.9% 61.0% 1.7% 46.6%
Between 2010 and 2019, Rockwall, Denton, Collin, and Kaufma
n grew faster than other DFW
Counties; Asians grew faster than other race groups in most DF
W Counties, except for Johnson and
Somervell Counties, where African Americans grew fastest, and
Parker County, where Hispanics
grew the fastest.
Source: U.S. Census Bureau, 2019 Population Estimates
Percent Chane by Race/Ethnicity Composition, DFW Counties,
2010-2019
26
Percent Hispanic, DFW Census Tracts, 2019
Source: U.S. Census Bureau, 2010 Decennial Census, 2019 Ame
rican Community Survey 5‐ Year Estimates
27
Percent Non-Hispanic Black, DFW Census Tracts, 2019
Source: U.S. Census Bureau, 2010 Decennial Census, 2019 Ame
rican Community Survey 5‐ Year Estimates
28
Percent Non-Hispanic Asian, DFW Census Tracts, 2019
Source: U.S. Census Bureau, 2010 Decennial Census, 2019 Ame
rican Community Survey 5‐ Year Estimates
29
Texas is relatively young but aging.
Source: U.S. Census Bureau, 2010 Decennial Census, 2019 Ame
rican Community Survey 1‐ Year Estimates
35.3
38.5
32.3
35.1
29.0
30.0
31.0
32.0
33.0
34.0
35.0
36.0
37.0
38.0
39.0
Change in Median Age, U.S. and Texas, 2000‐ 2019
U.S. TX
30
0
200,000
400,000
600,000
800,000
1,000,000
1,200,000
< 05 05‐ 09 10‐ 14 15‐ 19 20‐ 24 25‐ 29 30‐ 34 35‐ 39 40‐ 44
45‐ 49 50‐ 54 55‐ 59 60‐ 64 65‐ 69 70‐ 74 75‐ 79 80‐ 84
85‐ 89 90‐ 94 95+
NH White Hispanic
In Texas in 2019, there are more Hispanics than NH Whites
below
age 45; more NH Whites at 45 and older.
Source: Texas Demographic Center, 2019 Population Estimates
31
2018 1.87
2016 2.02
2014 2.09
2012 2.08
2010 2.16
2008 2.36
2006 2.36
Total 1.92
NH White 1.71
NH Black 1.83
Hispanic 2.14
Total Fertility Rates Total Fertility Rate by Race/Ethnicity,
2017
Source: Centers for Disease Control and Prevention, National C
enter for Health Statistics, National Vital Statistics Reports
Total Fertility Rates, Texas
32Source: Centers for Disease Control and Prevention, National
Center for Health Statistics, National Vital Statistics Report; de
nominator
derived from U.S Census Bureau, Intercensal
Estimates, 2010‐ 2019 Population Estimates
Birth Rates by Race/Ethnicity, Texas, 2006-2018
33
‐ 200,000
‐ 100,000
0
100,000
200,000
300,000
400,000
500,000
600,000
700,000
Under 18 18 to 24 25 to 44 45 to 64 65 Plus
NH White NH Black Hispanic NH Asian NH Other
Numeric Change in Age Group by Race/Ethnicity, Texas,
2010-2019
Source: U.S. Census Bureau, 2019 Population Estimates
Period of Entry by Area of Birth for Foreign Born Population in
Texas
34Source: U.S. Census Bureau, 2019 American Community Surv
ey, 1‐ Year PUMS
4.5
3.0
4.2
30.5
21.6
19.1
11.0
6.2
2.8
52.6
68.1
72.5
0.0 10.0 20.0 30.0 40.0 50.0 60.0 70.0 80.0 90.0 100.0
Entered after 2010
Entered 2000 to 2009
Entered before 2000
Percent
A
xi
s
Ti
tl
e
Europe Asia Africa Oceania Latin America Northern America
35
Total Foreign Born Population 4,951,156
Latin America 3,271,403*
Mexico 2,453,126*
Central America Belize, Costa Rica, El Salvador,1 Guatemala,3
Honduras,2 Nicaragua, Panama 510,150
South America Argentina, Bolivia, Brazil, Chile, Colombia,2
Ecuador, Guyana, Peru, Uruguay,
Venezuela1 191,933
Caribbean Bahamas, Barbados, Cuba,1
Dominica, Dominican Republic3, Grenada, Haiti,
Jamaica2, St. Vincent & the Grenadines, Trinidad and Tobago,
West Indies 116,194
Asia 1,126,507
South Central Asia Afghanistan, Bangladesh, India,1
Iran, Kazakhstan, Nepal, Pakistan, Sri Lanka,
Uzbekistan 449,906
South Eastern Asia Cambodia, Indonesia, Laos, Malaysia,
Burma, Philippines,2 Singapore,
Thailand, Vietnam1 360,043
Eastern Asia China,1 Hong Kong, Taiwan,3 Japan, Korea2
227,580
Western Asia Iraq,1
Israel, Jordan, Kuwait, Lebanon, Saudi Arabia2,
Syria, Yemen, Turkey,3
Armenia 82,776
Source: U.S. Census Bureau, 2019 American Community Survey
1‐ Year Estimates
Place of Birth for the Foreign Born Population, Texas, 2019
36
Questions?
What’s ahead for
the population of
Texas?
Projected Population, Texas, 2010-2030
38Source: Texas Demographic Center, 2014 and 2018 Populatio
n Projections
25.1
34.9
20
22
24
26
28
30
32
34
36
38
40
M
ill
io
ns
Zero Migration
0.5 Migration
1.0 Migration
2010‐ 2015 Migration
29.7
39Source: Texas Demographic Center, 2018 Vintage Population
Projections, 2010‐ 2015 Migration Scenario
Population Projections by Race/Ethnicity, Texas, 2010-2030
11.4 12.8
2.9
4.3
9.5
14.5
0.9
2.4
0.5
0.9
0
2
4
6
8
10
12
14
16
2010 2011 2012 2013 2014 2015 2016 2017 2018 2019 2020
2021 2022 2023 2024 2025 2026 2027 2028 2029 2030
M
ill
io
ns
NH White NH Black Hispanic NH Asian NH Other
40
Population Projections, DFW Metro Counties, 2010-2030
Source: Texas Demographic Center, 2018 Population Projection
s
3,106,298
2,507,170
1,391,461
1,234,110
0
500,000
1,000,000
1,500,000
2,000,000
2,500,000
3,000,000
3,500,000
2010 2012 2014 2016 2018 2020 2022 2024 2026 2028 2030
Dallas
Tarrant
Collin
Denton
41
194,098
209,581
157,333
104,802
134,114
71,909
66,206
10,253
0
50,000
100,000
150,000
200,000
250,000
2010 2012 2014 2016 2018 2020 2022 2024 2026 2028 2030
Johnson
Ellis
Parker
Kaufman
Hunt
Rockwall
Wise
Hood
Somervell
Population Projections, DFW Metro Counties, 2010-2030
42
Population Projections by Race/Ethnicity, DFW Metro Area,
2010-
2030
Source: Texas Demographic Center 2018 Population Projections
3,197,326
3,667,178
941,320
1,584,914
1,751,878
2,802,965
337,785
926,493
138,233
282,008
0
500,000
1,000,000
1,500,000
2,000,000
2,500,000
3,000,000
3,500,000
4,000,000
2010 2012 2014 2016 2018 2020 2022 2024 2026 2028 2030
NH White NH Black Hispanic NH Asian NH Other
43
45
Texas’s Most Vulnerable Populations
• Income disparities place African Americans
and Latinos at greater risk during times of
income loss.
• Renters, renters w/low incomes, Blacks, and
households w/children face greater risk of
eviction.
• Persistently low health insurance coverage in
the state increases vulnerability of Texans with
employer based insurance.
Source: Texas Demographic Center, https://demographics.texas.
gov/Resources/publications/2020/20200918_ACS2019Brief_Tex
asMostVulnerablePopulations.pdf
46
Questions?
Lila Valencia, Ph.D.
(512) 936‐ 3542
[email protected]
demographics.texas.gov
@TexasDemography
@TexasDemographics
47
Implications of
population growth
and demographic
shifts on Texas
socio-economic
indicators
Population 25 and Older with High School Diploma and Above,
Texas, 2011-2019
Source: U.S. Census Bureau. American Community Survey, 1‐
Year Estimates
81.1
84.6
92.5
94.4
86.2
91.2
85.7
89.4
60.4
68.3
50
55
60
65
70
75
80
85
90
95
100
2011 2012 2013 2014 2015 2016 2017 2018 2019
Pe
rc
en
t
Total NH White Black Asian Hispanic
50
Population 25 and Older with Bachelors Degree and Above,
Texas, 2011-2019
Source: U.S. Census Bureau. American Community Survey, 1‐
Year Estimates
26.4
30.8
34.8
39.4
20.3
25.7
52.5
60.6
12.0
16.1
0
10
20
30
40
50
60
70
2011 2012 2013 2014 2015 2016 2017 2018 2019
Pe
rc
en
t
Total NH White Black Asian Hispanic
51
84.6
94.4
91.2 89.4
68.3
30.8
39.4
25.7
60.6
16.1
0
10
20
30
40
50
60
70
80
90
100
Total NH White Black Asian Hispanic Total NH White Black
Asian Hispanic
Pe
rc
en
t
Austin DFW Houston San Antonio Texas
Educational Attainment by Race/Ethnicity, Big Four Metros &
Texas, 2019
High School Degree and above
Bachelor’s Degree and above
Educational attainment is slightly higher in the DFW
metro than in Texas overall, except for Hispanics.
However, educational disparities by race/ethnicity are
still evident, especially for Hispanics.
Source: U.S. Census Bureau. American Community Survey, 201
9 1‐ Year Estimates
52
$74,974
$91,706
$70,079
$78,905
$43,482
$52,010
$41,786
$47,428
$0
$10,000
$20,000
$30,000
$40,000
$50,000
$60,000
$70,000
$80,000
$90,000
$100,000
2010 2011 2012 2013 2014 2015 2016 2017 2018 2019
M
ed
ia
n
H
ou
se
ho
ld
In
co
m
e
(A
dj
us
te
d
D
ol
la
rs
)
Asian
NH White
Hispanic
Black
Median Household Income by Race/Ethnicity, Texas, 2010-2019
Source: U.S. Census Bureau. American Community Survey, 1‐
Year Estimates
53
$64,034
$78,905
$52,010
$47,428
$91,706
$0
$20,000
$40,000
$60,000
$80,000
$100,000
$120,000
Total NH White Hispanic Black Asian
M
ed
ia
n
H
ou
se
ho
ld
In
co
m
e
Austin Dallas Houston San Antonio Texas
Median Household Income by Race/Ethnicity, Big Four Metros
&
Texas, 2019
Source: U.S. Census Bureau. American Community Survey, 201
9 1‐ Year Estimates
Median incomes are higher in the DFW metro than in
Texas overall. However, disparities by race/ethnicity
are still evident, especially for Hispanics and Blacks.
54
Median Earnings for Full‐ Time,
Year‐ Round Work DFW Metro Area Texas
Total $50,677 $46,434
Male $53,428 $51,125
Female $45,455 $40,670
Pay Gap $0.85 $0.80
Median Earnings, DFW Metro and Texas, 2019
Source: U.S. Census Bureau. American Community Survey, 201
9 1‐ Year Estimates
Poverty and Uninsured Rates by Race/Ethnicity, Texas, 2019
Texas US
Population Below Poverty Estimate Percent Estimate Percent
Black or African American 634,381 18.6 8,557,464 21.2
Asian 131,705 9.2 1,761,321 9.6
Hispanic or Latino 2,113,153 18.7 10,201,081 17.2
NH White 933,323 8.0 17,352,095 9.0
Texas US
Uninsured Population Estimate Percent Estimate Percent
Black or African American 517,133 15.0 4,124,039 10.1
Asian 161,969 11.3 1,218,462 6.6
Hispanic or Latino 3,258,356 28.6 11,135,068 18.7
NH White 1,240,220 10.6 12,130,924 6.3
Source: U.S. Census Bureau, 2019 American Community Survey
, 1‐ Year Estimates
56
18.4%
10.6%
28.6%
15.0%
11.3%
13.6%
8.0%
18.7% 18.6%
9.2%
0.0%
5.0%
10.0%
15.0%
20.0%
25.0%
30.0%
35.0%
Total NH White Hispanic Black Asian Total NH White Hispanic
Black Asian
Austin Dallas Houston San Antonio Texas
Percent Uninsured, Below Poverty by Race/Ethnicity, Big Four
Metros & Texas, 2019
Source: U.S. Census Bureau. American Community Survey, 201
9 1‐ Year Estimates
Percent Uninsured
Percent Poverty Rate
Uninsurance and poverty rates are lower in the DFW
metro than in Texas overall, except for Hispanics
where their uninsurance rate is higher. However,
disparities by race/ethnicity are still evident, especially
for Hispanics and Blacks.
57
Source: Brookings, https://www.brookings.edu/interactives/metr
o‐ recovery‐ index/

More Related Content

More from GrazynaBroyles24

6 pages which reach all of requiements below hereAn essay inclu.docx
6 pages which reach all of requiements below hereAn essay inclu.docx6 pages which reach all of requiements below hereAn essay inclu.docx
6 pages which reach all of requiements below hereAn essay inclu.docx
GrazynaBroyles24
 
54w9Performing Effective Project Monitoring and Risk Management.docx
54w9Performing Effective Project Monitoring and Risk Management.docx54w9Performing Effective Project Monitoring and Risk Management.docx
54w9Performing Effective Project Monitoring and Risk Management.docx
GrazynaBroyles24
 
5I need a fiive page paper with title page, reference page in APA fo.docx
5I need a fiive page paper with title page, reference page in APA fo.docx5I need a fiive page paper with title page, reference page in APA fo.docx
5I need a fiive page paper with title page, reference page in APA fo.docx
GrazynaBroyles24
 
6 pages paper for International relations class Knowledgeable Econo.docx
6 pages paper for International relations class Knowledgeable Econo.docx6 pages paper for International relations class Knowledgeable Econo.docx
6 pages paper for International relations class Knowledgeable Econo.docx
GrazynaBroyles24
 
50 words minimum This weeks audio is very informative but o.docx
50 words minimum This weeks audio is very informative but o.docx50 words minimum This weeks audio is very informative but o.docx
50 words minimum This weeks audio is very informative but o.docx
GrazynaBroyles24
 
500 word discussion on the passage to answer question at the botto.docx
500 word discussion on the passage to answer question at the botto.docx500 word discussion on the passage to answer question at the botto.docx
500 word discussion on the passage to answer question at the botto.docx
GrazynaBroyles24
 
5. An electric motor accomplishes what task[removed]convert.docx
5. An electric motor accomplishes what task[removed]convert.docx5. An electric motor accomplishes what task[removed]convert.docx
5. An electric motor accomplishes what task[removed]convert.docx
GrazynaBroyles24
 
5.4 - Commercial Air Travel during the 1950’s – 1960’sIn this .docx
5.4 - Commercial Air Travel during the 1950’s – 1960’sIn this .docx5.4 - Commercial Air Travel during the 1950’s – 1960’sIn this .docx
5.4 - Commercial Air Travel during the 1950’s – 1960’sIn this .docx
GrazynaBroyles24
 
500 wordsAPA FormatScenarioYou are a probation officer a.docx
500 wordsAPA FormatScenarioYou are a probation officer a.docx500 wordsAPA FormatScenarioYou are a probation officer a.docx
500 wordsAPA FormatScenarioYou are a probation officer a.docx
GrazynaBroyles24
 
500 words- no references. Must be original, no plagiarism.docx
500 words- no references. Must be original, no plagiarism.docx500 words- no references. Must be original, no plagiarism.docx
500 words- no references. Must be original, no plagiarism.docx
GrazynaBroyles24
 
5.5 - Beginnings of the Space ProgramIn this discussion activi.docx
5.5 - Beginnings of the Space ProgramIn this discussion activi.docx5.5 - Beginnings of the Space ProgramIn this discussion activi.docx
5.5 - Beginnings of the Space ProgramIn this discussion activi.docx
GrazynaBroyles24
 
5.3 - Discussion Ethical issuesReview the pros and cons of glob.docx
5.3 - Discussion Ethical issuesReview the pros and cons of glob.docx5.3 - Discussion Ethical issuesReview the pros and cons of glob.docx
5.3 - Discussion Ethical issuesReview the pros and cons of glob.docx
GrazynaBroyles24
 
500 words APA formatHow much impact do managers actually have on a.docx
500 words APA formatHow much impact do managers actually have on a.docx500 words APA formatHow much impact do managers actually have on a.docx
500 words APA formatHow much impact do managers actually have on a.docx
GrazynaBroyles24
 
5.2Complete one of the following options for your Week 5 Assignm.docx
5.2Complete one of the following options for your Week 5 Assignm.docx5.2Complete one of the following options for your Week 5 Assignm.docx
5.2Complete one of the following options for your Week 5 Assignm.docx
GrazynaBroyles24
 
5.1 DBDisparities exist among racial and ethnic groups with rega.docx
5.1 DBDisparities exist among racial and ethnic groups with rega.docx5.1 DBDisparities exist among racial and ethnic groups with rega.docx
5.1 DBDisparities exist among racial and ethnic groups with rega.docx
GrazynaBroyles24
 
5. What are the most common types of computer-based information syst.docx
5. What are the most common types of computer-based information syst.docx5. What are the most common types of computer-based information syst.docx
5. What are the most common types of computer-based information syst.docx
GrazynaBroyles24
 
5.2 - Postwar Commercial AviationIn this discussion activity, .docx
5.2 - Postwar Commercial AviationIn this discussion activity, .docx5.2 - Postwar Commercial AviationIn this discussion activity, .docx
5.2 - Postwar Commercial AviationIn this discussion activity, .docx
GrazynaBroyles24
 
5-6 paragraphsYou and Officer Landonio are on patrol. Yo.docx
5-6 paragraphsYou and Officer Landonio are on patrol. Yo.docx5-6 paragraphsYou and Officer Landonio are on patrol. Yo.docx
5-6 paragraphsYou and Officer Landonio are on patrol. Yo.docx
GrazynaBroyles24
 
5-6 paragraphs Interagency is relatively recent as a term, y.docx
5-6 paragraphs Interagency is relatively recent as a term, y.docx5-6 paragraphs Interagency is relatively recent as a term, y.docx
5-6 paragraphs Interagency is relatively recent as a term, y.docx
GrazynaBroyles24
 
5-6 paragraphsTerrorism in the United States has a history d.docx
5-6 paragraphsTerrorism in the United States has a history d.docx5-6 paragraphsTerrorism in the United States has a history d.docx
5-6 paragraphsTerrorism in the United States has a history d.docx
GrazynaBroyles24
 

More from GrazynaBroyles24 (20)

6 pages which reach all of requiements below hereAn essay inclu.docx
6 pages which reach all of requiements below hereAn essay inclu.docx6 pages which reach all of requiements below hereAn essay inclu.docx
6 pages which reach all of requiements below hereAn essay inclu.docx
 
54w9Performing Effective Project Monitoring and Risk Management.docx
54w9Performing Effective Project Monitoring and Risk Management.docx54w9Performing Effective Project Monitoring and Risk Management.docx
54w9Performing Effective Project Monitoring and Risk Management.docx
 
5I need a fiive page paper with title page, reference page in APA fo.docx
5I need a fiive page paper with title page, reference page in APA fo.docx5I need a fiive page paper with title page, reference page in APA fo.docx
5I need a fiive page paper with title page, reference page in APA fo.docx
 
6 pages paper for International relations class Knowledgeable Econo.docx
6 pages paper for International relations class Knowledgeable Econo.docx6 pages paper for International relations class Knowledgeable Econo.docx
6 pages paper for International relations class Knowledgeable Econo.docx
 
50 words minimum This weeks audio is very informative but o.docx
50 words minimum This weeks audio is very informative but o.docx50 words minimum This weeks audio is very informative but o.docx
50 words minimum This weeks audio is very informative but o.docx
 
500 word discussion on the passage to answer question at the botto.docx
500 word discussion on the passage to answer question at the botto.docx500 word discussion on the passage to answer question at the botto.docx
500 word discussion on the passage to answer question at the botto.docx
 
5. An electric motor accomplishes what task[removed]convert.docx
5. An electric motor accomplishes what task[removed]convert.docx5. An electric motor accomplishes what task[removed]convert.docx
5. An electric motor accomplishes what task[removed]convert.docx
 
5.4 - Commercial Air Travel during the 1950’s – 1960’sIn this .docx
5.4 - Commercial Air Travel during the 1950’s – 1960’sIn this .docx5.4 - Commercial Air Travel during the 1950’s – 1960’sIn this .docx
5.4 - Commercial Air Travel during the 1950’s – 1960’sIn this .docx
 
500 wordsAPA FormatScenarioYou are a probation officer a.docx
500 wordsAPA FormatScenarioYou are a probation officer a.docx500 wordsAPA FormatScenarioYou are a probation officer a.docx
500 wordsAPA FormatScenarioYou are a probation officer a.docx
 
500 words- no references. Must be original, no plagiarism.docx
500 words- no references. Must be original, no plagiarism.docx500 words- no references. Must be original, no plagiarism.docx
500 words- no references. Must be original, no plagiarism.docx
 
5.5 - Beginnings of the Space ProgramIn this discussion activi.docx
5.5 - Beginnings of the Space ProgramIn this discussion activi.docx5.5 - Beginnings of the Space ProgramIn this discussion activi.docx
5.5 - Beginnings of the Space ProgramIn this discussion activi.docx
 
5.3 - Discussion Ethical issuesReview the pros and cons of glob.docx
5.3 - Discussion Ethical issuesReview the pros and cons of glob.docx5.3 - Discussion Ethical issuesReview the pros and cons of glob.docx
5.3 - Discussion Ethical issuesReview the pros and cons of glob.docx
 
500 words APA formatHow much impact do managers actually have on a.docx
500 words APA formatHow much impact do managers actually have on a.docx500 words APA formatHow much impact do managers actually have on a.docx
500 words APA formatHow much impact do managers actually have on a.docx
 
5.2Complete one of the following options for your Week 5 Assignm.docx
5.2Complete one of the following options for your Week 5 Assignm.docx5.2Complete one of the following options for your Week 5 Assignm.docx
5.2Complete one of the following options for your Week 5 Assignm.docx
 
5.1 DBDisparities exist among racial and ethnic groups with rega.docx
5.1 DBDisparities exist among racial and ethnic groups with rega.docx5.1 DBDisparities exist among racial and ethnic groups with rega.docx
5.1 DBDisparities exist among racial and ethnic groups with rega.docx
 
5. What are the most common types of computer-based information syst.docx
5. What are the most common types of computer-based information syst.docx5. What are the most common types of computer-based information syst.docx
5. What are the most common types of computer-based information syst.docx
 
5.2 - Postwar Commercial AviationIn this discussion activity, .docx
5.2 - Postwar Commercial AviationIn this discussion activity, .docx5.2 - Postwar Commercial AviationIn this discussion activity, .docx
5.2 - Postwar Commercial AviationIn this discussion activity, .docx
 
5-6 paragraphsYou and Officer Landonio are on patrol. Yo.docx
5-6 paragraphsYou and Officer Landonio are on patrol. Yo.docx5-6 paragraphsYou and Officer Landonio are on patrol. Yo.docx
5-6 paragraphsYou and Officer Landonio are on patrol. Yo.docx
 
5-6 paragraphs Interagency is relatively recent as a term, y.docx
5-6 paragraphs Interagency is relatively recent as a term, y.docx5-6 paragraphs Interagency is relatively recent as a term, y.docx
5-6 paragraphs Interagency is relatively recent as a term, y.docx
 
5-6 paragraphsTerrorism in the United States has a history d.docx
5-6 paragraphsTerrorism in the United States has a history d.docx5-6 paragraphsTerrorism in the United States has a history d.docx
5-6 paragraphsTerrorism in the United States has a history d.docx
 

Recently uploaded

Unit 2- Research Aptitude (UGC NET Paper I).pdf
Unit 2- Research Aptitude (UGC NET Paper I).pdfUnit 2- Research Aptitude (UGC NET Paper I).pdf
Unit 2- Research Aptitude (UGC NET Paper I).pdf
Thiyagu K
 
Additional Benefits for Employee Website.pdf
Additional Benefits for Employee Website.pdfAdditional Benefits for Employee Website.pdf
Additional Benefits for Employee Website.pdf
joachimlavalley1
 
TESDA TM1 REVIEWER FOR NATIONAL ASSESSMENT WRITTEN AND ORAL QUESTIONS WITH A...
TESDA TM1 REVIEWER  FOR NATIONAL ASSESSMENT WRITTEN AND ORAL QUESTIONS WITH A...TESDA TM1 REVIEWER  FOR NATIONAL ASSESSMENT WRITTEN AND ORAL QUESTIONS WITH A...
TESDA TM1 REVIEWER FOR NATIONAL ASSESSMENT WRITTEN AND ORAL QUESTIONS WITH A...
EugeneSaldivar
 
Digital Tools and AI for Teaching Learning and Research
Digital Tools and AI for Teaching Learning and ResearchDigital Tools and AI for Teaching Learning and Research
Digital Tools and AI for Teaching Learning and Research
Vikramjit Singh
 
The geography of Taylor Swift - some ideas
The geography of Taylor Swift - some ideasThe geography of Taylor Swift - some ideas
The geography of Taylor Swift - some ideas
GeoBlogs
 
2024.06.01 Introducing a competency framework for languag learning materials ...
2024.06.01 Introducing a competency framework for languag learning materials ...2024.06.01 Introducing a competency framework for languag learning materials ...
2024.06.01 Introducing a competency framework for languag learning materials ...
Sandy Millin
 
Students, digital devices and success - Andreas Schleicher - 27 May 2024..pptx
Students, digital devices and success - Andreas Schleicher - 27 May 2024..pptxStudents, digital devices and success - Andreas Schleicher - 27 May 2024..pptx
Students, digital devices and success - Andreas Schleicher - 27 May 2024..pptx
EduSkills OECD
 
aaaaaaaaaaaaaaaaaaaaaaaaaaaaaaaaaaaaaaaaa
aaaaaaaaaaaaaaaaaaaaaaaaaaaaaaaaaaaaaaaaaaaaaaaaaaaaaaaaaaaaaaaaaaaaaaaaaaaaaaaaaa
aaaaaaaaaaaaaaaaaaaaaaaaaaaaaaaaaaaaaaaaa
siemaillard
 
Chapter 3 - Islamic Banking Products and Services.pptx
Chapter 3 - Islamic Banking Products and Services.pptxChapter 3 - Islamic Banking Products and Services.pptx
Chapter 3 - Islamic Banking Products and Services.pptx
Mohd Adib Abd Muin, Senior Lecturer at Universiti Utara Malaysia
 
GIÁO ÁN DẠY THÊM (KẾ HOẠCH BÀI BUỔI 2) - TIẾNG ANH 8 GLOBAL SUCCESS (2 CỘT) N...
GIÁO ÁN DẠY THÊM (KẾ HOẠCH BÀI BUỔI 2) - TIẾNG ANH 8 GLOBAL SUCCESS (2 CỘT) N...GIÁO ÁN DẠY THÊM (KẾ HOẠCH BÀI BUỔI 2) - TIẾNG ANH 8 GLOBAL SUCCESS (2 CỘT) N...
GIÁO ÁN DẠY THÊM (KẾ HOẠCH BÀI BUỔI 2) - TIẾNG ANH 8 GLOBAL SUCCESS (2 CỘT) N...
Nguyen Thanh Tu Collection
 
The Challenger.pdf DNHS Official Publication
The Challenger.pdf DNHS Official PublicationThe Challenger.pdf DNHS Official Publication
The Challenger.pdf DNHS Official Publication
Delapenabediema
 
Thesis Statement for students diagnonsed withADHD.ppt
Thesis Statement for students diagnonsed withADHD.pptThesis Statement for students diagnonsed withADHD.ppt
Thesis Statement for students diagnonsed withADHD.ppt
EverAndrsGuerraGuerr
 
Sectors of the Indian Economy - Class 10 Study Notes pdf
Sectors of the Indian Economy - Class 10 Study Notes pdfSectors of the Indian Economy - Class 10 Study Notes pdf
Sectors of the Indian Economy - Class 10 Study Notes pdf
Vivekanand Anglo Vedic Academy
 
Introduction to Quality Improvement Essentials
Introduction to Quality Improvement EssentialsIntroduction to Quality Improvement Essentials
Introduction to Quality Improvement Essentials
Excellence Foundation for South Sudan
 
Supporting (UKRI) OA monographs at Salford.pptx
Supporting (UKRI) OA monographs at Salford.pptxSupporting (UKRI) OA monographs at Salford.pptx
Supporting (UKRI) OA monographs at Salford.pptx
Jisc
 
special B.ed 2nd year old paper_20240531.pdf
special B.ed 2nd year old paper_20240531.pdfspecial B.ed 2nd year old paper_20240531.pdf
special B.ed 2nd year old paper_20240531.pdf
Special education needs
 
Synthetic Fiber Construction in lab .pptx
Synthetic Fiber Construction in lab .pptxSynthetic Fiber Construction in lab .pptx
Synthetic Fiber Construction in lab .pptx
Pavel ( NSTU)
 
The Roman Empire A Historical Colossus.pdf
The Roman Empire A Historical Colossus.pdfThe Roman Empire A Historical Colossus.pdf
The Roman Empire A Historical Colossus.pdf
kaushalkr1407
 
The French Revolution Class 9 Study Material pdf free download
The French Revolution Class 9 Study Material pdf free downloadThe French Revolution Class 9 Study Material pdf free download
The French Revolution Class 9 Study Material pdf free download
Vivekanand Anglo Vedic Academy
 
CLASS 11 CBSE B.St Project AIDS TO TRADE - INSURANCE
CLASS 11 CBSE B.St Project AIDS TO TRADE - INSURANCECLASS 11 CBSE B.St Project AIDS TO TRADE - INSURANCE
CLASS 11 CBSE B.St Project AIDS TO TRADE - INSURANCE
BhavyaRajput3
 

Recently uploaded (20)

Unit 2- Research Aptitude (UGC NET Paper I).pdf
Unit 2- Research Aptitude (UGC NET Paper I).pdfUnit 2- Research Aptitude (UGC NET Paper I).pdf
Unit 2- Research Aptitude (UGC NET Paper I).pdf
 
Additional Benefits for Employee Website.pdf
Additional Benefits for Employee Website.pdfAdditional Benefits for Employee Website.pdf
Additional Benefits for Employee Website.pdf
 
TESDA TM1 REVIEWER FOR NATIONAL ASSESSMENT WRITTEN AND ORAL QUESTIONS WITH A...
TESDA TM1 REVIEWER  FOR NATIONAL ASSESSMENT WRITTEN AND ORAL QUESTIONS WITH A...TESDA TM1 REVIEWER  FOR NATIONAL ASSESSMENT WRITTEN AND ORAL QUESTIONS WITH A...
TESDA TM1 REVIEWER FOR NATIONAL ASSESSMENT WRITTEN AND ORAL QUESTIONS WITH A...
 
Digital Tools and AI for Teaching Learning and Research
Digital Tools and AI for Teaching Learning and ResearchDigital Tools and AI for Teaching Learning and Research
Digital Tools and AI for Teaching Learning and Research
 
The geography of Taylor Swift - some ideas
The geography of Taylor Swift - some ideasThe geography of Taylor Swift - some ideas
The geography of Taylor Swift - some ideas
 
2024.06.01 Introducing a competency framework for languag learning materials ...
2024.06.01 Introducing a competency framework for languag learning materials ...2024.06.01 Introducing a competency framework for languag learning materials ...
2024.06.01 Introducing a competency framework for languag learning materials ...
 
Students, digital devices and success - Andreas Schleicher - 27 May 2024..pptx
Students, digital devices and success - Andreas Schleicher - 27 May 2024..pptxStudents, digital devices and success - Andreas Schleicher - 27 May 2024..pptx
Students, digital devices and success - Andreas Schleicher - 27 May 2024..pptx
 
aaaaaaaaaaaaaaaaaaaaaaaaaaaaaaaaaaaaaaaaa
aaaaaaaaaaaaaaaaaaaaaaaaaaaaaaaaaaaaaaaaaaaaaaaaaaaaaaaaaaaaaaaaaaaaaaaaaaaaaaaaaa
aaaaaaaaaaaaaaaaaaaaaaaaaaaaaaaaaaaaaaaaa
 
Chapter 3 - Islamic Banking Products and Services.pptx
Chapter 3 - Islamic Banking Products and Services.pptxChapter 3 - Islamic Banking Products and Services.pptx
Chapter 3 - Islamic Banking Products and Services.pptx
 
GIÁO ÁN DẠY THÊM (KẾ HOẠCH BÀI BUỔI 2) - TIẾNG ANH 8 GLOBAL SUCCESS (2 CỘT) N...
GIÁO ÁN DẠY THÊM (KẾ HOẠCH BÀI BUỔI 2) - TIẾNG ANH 8 GLOBAL SUCCESS (2 CỘT) N...GIÁO ÁN DẠY THÊM (KẾ HOẠCH BÀI BUỔI 2) - TIẾNG ANH 8 GLOBAL SUCCESS (2 CỘT) N...
GIÁO ÁN DẠY THÊM (KẾ HOẠCH BÀI BUỔI 2) - TIẾNG ANH 8 GLOBAL SUCCESS (2 CỘT) N...
 
The Challenger.pdf DNHS Official Publication
The Challenger.pdf DNHS Official PublicationThe Challenger.pdf DNHS Official Publication
The Challenger.pdf DNHS Official Publication
 
Thesis Statement for students diagnonsed withADHD.ppt
Thesis Statement for students diagnonsed withADHD.pptThesis Statement for students diagnonsed withADHD.ppt
Thesis Statement for students diagnonsed withADHD.ppt
 
Sectors of the Indian Economy - Class 10 Study Notes pdf
Sectors of the Indian Economy - Class 10 Study Notes pdfSectors of the Indian Economy - Class 10 Study Notes pdf
Sectors of the Indian Economy - Class 10 Study Notes pdf
 
Introduction to Quality Improvement Essentials
Introduction to Quality Improvement EssentialsIntroduction to Quality Improvement Essentials
Introduction to Quality Improvement Essentials
 
Supporting (UKRI) OA monographs at Salford.pptx
Supporting (UKRI) OA monographs at Salford.pptxSupporting (UKRI) OA monographs at Salford.pptx
Supporting (UKRI) OA monographs at Salford.pptx
 
special B.ed 2nd year old paper_20240531.pdf
special B.ed 2nd year old paper_20240531.pdfspecial B.ed 2nd year old paper_20240531.pdf
special B.ed 2nd year old paper_20240531.pdf
 
Synthetic Fiber Construction in lab .pptx
Synthetic Fiber Construction in lab .pptxSynthetic Fiber Construction in lab .pptx
Synthetic Fiber Construction in lab .pptx
 
The Roman Empire A Historical Colossus.pdf
The Roman Empire A Historical Colossus.pdfThe Roman Empire A Historical Colossus.pdf
The Roman Empire A Historical Colossus.pdf
 
The French Revolution Class 9 Study Material pdf free download
The French Revolution Class 9 Study Material pdf free downloadThe French Revolution Class 9 Study Material pdf free download
The French Revolution Class 9 Study Material pdf free download
 
CLASS 11 CBSE B.St Project AIDS TO TRADE - INSURANCE
CLASS 11 CBSE B.St Project AIDS TO TRADE - INSURANCECLASS 11 CBSE B.St Project AIDS TO TRADE - INSURANCE
CLASS 11 CBSE B.St Project AIDS TO TRADE - INSURANCE
 

This is just an example and you should not copy any parts of it in y

  • 1. This is just an example and you should not copy any parts of it in your initial post. Doing so will result in an automatic 0. Your initial post does not need to be this long, but you have to follow the same format. Avoid being tempted to copy this written argument; the author has made little mistakes and there are some errors in stated data. Question 1 My Texas state House representative is Representative Thresa "Terry" Meza. She is female, and her party affiliation is Democrat. Her race is unknown, but her district number is 105 (Texas House of Representatives). My Texas state senator is Senator Kelly Hancock. He is male, and his party affiliation is Republican. His race is also unknown. His district number is 9 (The Texas Tribune). Question 2 It looks like the legislature is unrepresentative of the people of Texas. Before I begin, I would like to share the research I found about my Representative and Senator of my district. Representative Thresa Meza from District 105 looks like she represents the Hispanic communities. In a way, she is also representing the minority group. In the “Biography” section, it says that “she also worked as a nonprofit director overseeing programs in small & minority business assistance” (Texas House of Representatives). It may not sound like it, but we see some representation towards the minority groups. I clicked on the “District Profile Reports”. In that link, it showed a profile of the district, titled “Texas House District 105: ACS 2014- 2018 Estimates”. According to the report, the population of District 105 is about 189,119. There are 49,738 non-Hispanic Anglos or Caucasians out of the total population. As for non- Anglo groups, there are 139,381 (Texas Legislative Council). Here, we can see larger numbers of minorities than the majority in this district. I mentioned that she might be representing the Hispanic communities. According to the analysis, there are 96,503 Hispanics in that district (Texas Legislative Council). At
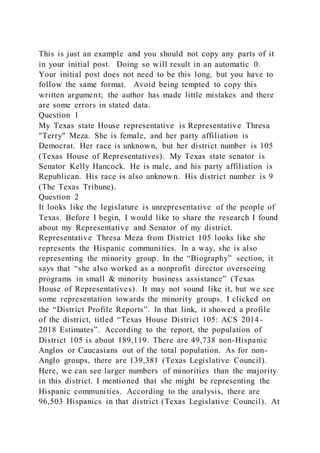
  • 2. the same time, she is a minority, so she is also representing the non-Anglos community. Next would be the Texas Senate. Senator Kelly Hancock is from District 9. According to the District Profile, titled “Texas Senate District 9: ACS 2014-2018 Estimates”, the population of District 9 totaled up to about 902,387. There are about 388,926 non-Hispanic Anglos and 513,461 non-Anglos in District 9 of Texas (Texas Legislative Council). Looking at the non-Anglos race separately, we see that the majority of the population in this district are Caucasians. Therefore, Senator Kelly Hancock is representing them. By comparison, we can see that Representative Thresa Meza is more representative of the people of Texas than Senator Kelly Hancock based on race. Simultaneously, the Senate and House of Representatives represent the whole population of their district and not a specific racial group. As I mentioned earlier, I feel the legislature is not representative of the people of Texas. There are different district analyses to each of the districts than what I shared. We will find out why, using the population size of Texas of 2019, along with the population of each race and gender of Texas. A presentation from Texas Demographic Center, titled Demographic Trends and Population Projections for Texas and the North Texas Region, presented to Leadership North Texas, provided a chart, titled “Population Growth of Select States, 2000-2019”. The chart shows that the population was 25,145,561 in the year 2010. In 2019, the population increased to a total of 28,995,881. The presentatio n also pointed out, “As Texas grows, it ages and continues to diversify” (Texas Demographic Center). They provided another chart, titled “Race/Ethnicity Composition, Texas, 2010-2019”. The chart revealed that non-Hispanic White is the largest estimated population of 2019. The Hispanic race is the second-largest population, and they are also the largest minority group. The remaining groups were non-Hispanic (NH) African-American, Asian, American Indian and Alaska Native, and Native Hawaiian and Other Pacific Islander. They also included “NH
  • 3. Two or More Races”. The population of the remaining groups was 3.5 million or below (Texas Demographic Center). This result shows that there are smaller populations in the minority groups, excluding the Hispanics. Another piece of information I want to point out is gender. Legislative consists of two bodies, which are the Senate and the House of Representatives. According to The State of Texas: Government, Politics, and Policy, written by Sherri Mora, she provided a table chart, titled “Background of Members of the Texas Legislature, 2018” (Mora). According to the chart, the members of the house consist of 121 males and 29 females. As for the senate, there are 23 males and eight females (Mora). Mora also wrote that “cultural changes in the state over recent decades have increased the diversity of the Texas legislature” (Mora). "The number of officeholders who are members of ethnic minority groups has grown, both in Texas and across the nation” (Mora). The reason was partly due to "reapportionment and redistricting" (Mora). Still, “women and people of color are underrepresented in the Texas legislature when compared with their proportions of the state population” (Mora). In the 85th Texas Legislature of the year 2017, the people of color formed 57.1 percent of the population of Texas. However, they only accounted for “35.9 percent of the legislative seats” (Mora). The same situation applies to women. While women accounted for 50.4 percent of Texas's population, “women hold only 20.4 percent of the seats in the Texas legislature” (Mora). As of now, we have 112 males and 38 females in the House of Representatives. There are also various members of different races. However, a majority of the members are Caucasians and males. If we were counting members of a particular race, there would be fewer of them. Instead, we would count the members based on how many minorities there are in the House. From the list, there are about 20-25 female members. There are more males than females in the House. However, looking at the female members, there are more minority females than Caucasian females. As for the males, we see mostly Caucasians.
  • 4. Then again, it seems like more minorities are participating in state politics (Texas House of Representatives). As for the Texas Senate, there are about eight minorities out of 31 members. Of the 31 members, there are nine female members in total. Not only that, only one female representative is not Caucasian (The Texas Senate). Even though there are more Caucasians in both the Senate and House of Representatives, that does not mean we should start adding more females and people of color. This information shows that each minority race has a fewer population than the other. Once you have more representatives who are either females or minorities, each district population will not feel underrepresented. Based on the statistics that each one has provided, we can see how the legislature is not representative of the people of Texas. Not only that, Mora pointed out that women and people of color are underrepresented, which means they did not provide enough representation to the people of Texas. Representation can be defined by what the U.S. Supreme Court stated when they “rejected the analogy to the U.S. Senate, which is based on geographic units'' (Mora). They explained, “Legislators represent people, not trees or acres. Legislators are elected by voters, not farms or cities or economic interests'' (Mora). Not only that, “legislative apportionment most often resulted in equity” of representation during most of the 19th century (Mora). What this means is that each representative represents an equal number of citizens. With that information provided, we can define representation as legislators fairly representing an equal number of citizens of Texas. Mora also provided other information that supports what I said: “In April 2016, the Supreme Court unanimously rejected this challenge, asserting that ‘total-population apportionment promotes equitable and effective representation'” (Mora). By “this challenge”, she was referring to a case in Evenwel v. Abbott. The plaintiffs of the case argued that the “one person, one vote” rule would become violated if the practice of making legislative districts were to become equal in terms of total
  • 5. populations (Mora). Instead, they argued that there should be “an equal number of eligible voters in each district” (Mora). This challenge got rejected, and they stated that “total - population apportionment” encourages fair representation. I suppose the only reform necessary to make the legislature more representative would be to add more seats to the House of Representatives of Texas. This way, we will likely have more females and people of color representing each citizen of Texas. There are large numbers of representatives who are Caucasians and male, according to the statistics. With the increase of females and people of color, it might make the legislature more representative. In Texas, there are 31 state senators. Therefore, there are 31 single-member state senate districts. There are also 150 members in the House of Representatives. Hence, there are 150 single-member, state house districts (Mora). The only reform that would be necessary and acceptable would be the Texas House of Representatives. In Texas, the constitution prohibits any county from having more than one senator, no matter how large the population is (Mora). With that information in mind, we can see why increasing the House of Representatives of Texas would be an alternate solution in making the legislature more representative. There is another piece of information I would like to share. Mora wrote, “From 1876 until the 1920s, the Texas legislature made an effort to reapportion the seats after each census. This process was made easier by the addition of one seat for each increase of 50,000 in the population” (Mora). However, there were no seats added because the legislature failed “to reapportion legislative seats” (Mora). By 1948, “Texas legislative seats had not changed since 1921” even though a large population shifted from rural to urban areas. Because of this, “most urban counties were vastly underrepresented” (Mora). The creation of the Legislative Redistricting Board forced the legislature to act in 1951 and 1961. Representation shifted from rural to urban areas, but large urban counties were still underrepresented. Part of this was because of the 1936
  • 6. amendment to the Texas Constitution. It limited “the number of representatives any county could have to seven until the population reached 700,000” (Mora). The county could add one extra representative for each 100,000 population. The problem with this is that each county would have more representatives. Which means each county would not have an equal number of representatives. It may not work well if we try to add a seat to each district since each county has a different population size. If we use the method from 1876- 1920s, where one seat gets added for every increase of 50,000, we can see that we would have had about 579 representatives total in 2019, with a population of 28,995,881. It may not be accurate, but it is the estimation of what it would be if they began to add seats for every population increase of 50,000. We see it has more than 150 members, including the Texas counties. There are 254 counties in Texas. However, they can change it to where two representatives will represent a county. The problem with this solution is that there will be additional members, which would be 71. For that reason, instead of 579, it should be 508. That way, each county would have two representatives representing their county. Another issue with this would be having 508 state house districts, which sounds impossible since we have 254 counties. Also, representatives are representing an equal number of populations in each district and not each county. Redistricting the state to 508 house districts would be ridiculous, and it will be small in size. Another reform I thought of was keeping the 150 state house districts but doubling the members of the House of Representatives. Again, the issue with this would be to change the Texas Constitution, which is not happening. There is only one solution that might work: 300 Texas House members and 300 state house districts. It might be a better solution to the legislature. With a total number of 300 members in the House, there might be an increase in females and people of color who will represent the citizens of their district. With 150 members of the Texas House, they each represented about 193,306 people. However, with 300 members,
  • 7. it will reduce it down to 96,653 people. Each citizen might become delighted to see diversity in the legislature. Some citizens may feel relieved to see a member of the same color representing their race, including women representing the female community. Each member of the representatives may have a small district size, but the point is to see the legislatures being more representative of the people of Texas. Not only that, each representative needs to represent an equal number of citizens of the total population. For that reason, increasing the number of members of the House of Representatives in Texas by a double would make sense. Increasing the number of members and districts would also mean redistricting the state. Of course, that idea may have drawbacks in some ways. Sherri Mora explained that “the size of legislatures raises several issues” (Mora). One reason is “statewide interests might go unrepresented” (Mora). Another reason is that “they can become inefficient at decision making or, in part because of that inefficiency, be dominated by a few members, especially legislative leaders” (Mora). These are just possibilities of what would happen if we have larger legislatures. Again, the benefit would be to become more representative of Texas. After all, when you look at the members of the House of Texas, a large number of them are male and Caucasians. Doubling the seats and districts might be a way of keeping the citizens at ease and content. Hopefully, the drawbacks do not become too severe. Question 3 I believe smaller constituencies might allow a large number of people to participate in state politics. The reason for this is because I previously mentioned that the solution to making the legislature more representative is to add more seats, which means doubling the members of the Texas House of Representatives to 300 members. In The State of Texas: Government, Politics, and Policy, Sherri Mora wrote that “…larger bodies would ensure that the senate and especially the house would be more democratic and closer to the people because each state legislator would represent fewer constituents
  • 8. and a smaller geographic area” (Mora). For that reason, we can see why larger bodies, meaning more members for the Texas House of Representatives, may become a better solution to not only become more representative but also have fewer constituencies for each member to represent. In 2010, the population was 25,145,561, and each House member represents 167,637 people. Not only that, there are 167,637 constituents per legislative district (Mora). I mentioned before that we should double the members of representatives to 300. With that idea, we would be able to reduce that number down to about 83,818 people. This number would apply only in the year 2010. However, this idea shows that there will be fewer constituencies when we add more members to the Texas House of Representatives. This reform will allow larger bodies to ensure that the Senate and the House are closer to the people they represent. Mora also pointed out, “one member of the United States’ founding generation noted, smaller constituencies might also allow a wider array of people to participate in state politics, rather than just the ‘rich’ or ‘well born’” (Mora). It may be outdated since they said this around the 1700s, and they did not have as many populations as we currently do. However, they are still members of the United States’ founding generation, and one member agrees that smaller constituencies might allow a wide variety of people to participate in state politics. Who knows, with fewer constituencies, we might have someone participating in state politics who is not “rich” or “well -born”. I feel like the reason why the “rich” or “well-born” participate in state politics is that they have enough funds for traveling, campaigning, and advertising. As for those who may not have enough funds, they may still participate in state politics with the help of their supporters, who would be considered their campaign team. With enough funds, the person participating in state politics will run well and possibly win. It all depends on how they plan it. There is also another reason why larger bodies would be a better
  • 9. idea. Mora said that “large bodies might better promote the representation of local concerns and diverse interests within the state” (Mora). This statement reveals that this might encourage the Representatives to become more representative towards local concerns. Not only that, there will be a variety of interests within the state, which would also include state politics. Question 4 I feel like race should be taken into consideration whenever they redistrict Texas. Looking back at the presentation from Texas Demographic Center, there is a chart, titled “Race/Ethnicity Composition, Texas, 2010-2019”. There, we see a big difference in the number of races/ethnicities of each population group. In the year 2019, the estimated population of non-Hispanic (NH) Whites was 11,950,774. As I mentioned before, Hispanics are the largest minority population of Texas, totaling 11,525,578. As we go on, we see that NH African- American is 3,501,610, which is about 8 million less than what whites and Hispanics have. We also see that NH Asians are at a population of 1,457,549. The chart also included “NH Two or More Races”, which is at 425,866. Lastly, we see that NH American Indian and Alaska Native and NH Native Hawaiian and Other Pacific Islander are at about 94,000 or less for population size (Texas Demographic Center). Based on the estimated population size of 2019, we see that certain races/ethnicities are far less than the others. The minority groups are underrepresented because of this issue. For this reason, they should take race/ethnicity into consideration for redistricting. It will help in not only representing the minority but also gaining trust and support from them. I want to point out information about redistricting and gerrymandering. According to an article from The Texas Tribune, written by Yasmeen Khalifa, the census is a way to count every resident in the United States every ten years (Khalifa). "After that, state and local governments use the new population data to draw new congressional and state legislative maps” (Khalifa). She said, “The point is to draw roughly
  • 10. equally populated districts to reflect population growth and guarantee equal voter representation” (Khalifa). Even though they are drawn “roughly equally” for each representative to represent, the people of color might feel as if they are not receiving enough representation. Gerrymandering might be the reason behind this issue. According to a video from KSAT Explains, titled “Episode 23: Redrawing the Maps”, Nina Perales, who works for the Mexican American Legal Defense and Educational Fund organization, said that “Gerrymandering is a term that people came up with to describe when district lines are drawn in a way that somebody considers to be unfair” (KSAT Explains). According to what Sherri Mora wrote in The State of Texas: Government, Politics, and Policy, she said that in the case of Bush v. Vera, the Supreme Court “did not object to states’ considering race when drawing district lines or to their intentionally creating majority-minority districts; however, using race as the predominant factor in drawing districts, while subordinating other considerations, was found to be unconstitutional” (Mora). This means that using gerrymandering tactics only for racial matters would be wrong and unconstitutional. She also wrote that “the U.S. Supreme Court, in Hunt v. Cromartie, allowed the use of political gerrymandering in drawing legislative districts in April 1999” (Mora). The Court discovered that “drawing district boundaries based on political affiliation or partisan makeup was justifiable and constitutional. Therefore, creating a ‘safe’ Democratic or Republican seat was permissible” (Mora). Mora also said that creating legislative districts based only on “racial considerations” is prohibited, even though “political party affiliation and race” are often matched up (Mora). Using gerrymandering only towards race is unconstitutional. However, we also found out what Mora wrote. She wrote that the Supreme Court did not oppose the states’ consideration of race when they drew district lines or intentionally created majority-minority districts. It looks like they will find ways to use gerrymandering
  • 11. for not only political party advantage but for racial matters as well. Another piece of information I found in the KSAT Explain video was from a UTSA Associate Professor of Political Science named Walter Wilson, PhD. He said, “In an ideal world, I think that we would see congressional districts that attempt to represent communities of interest and the idea that regions and cities would all be represented by a voice in Congress. But instead, what we frequently see is an effort to either group certain kinds of voters together or divide them” (KSAT Explain). Even though they divided them into groups based on political party advantage, there is a possibility that race is also a factor in this tactic. In the same video, Nina Perales explains the issue with unfair redistricting: “When you have unfair redistricting, anybody can be hurt by that. It could be that lines are drawn to disadvantage rural voters or disadvantage urban voters. Sometimes lines can be drawn to disadvantage racial minorities” (KSAT Explain). That last statement reveals how minorities are at a disadvantage for this tactic. For that reason, they are underrepresented. Going back to The Texas Tribune article, Khalifa also mentioned another piece of informa tion involving the people of color for voting. She said, “The state has been dealing with the legal implications of the 2011 redistricting maps that ended up being rejected by the federal government. Following explosive population growth in Texas, particularly among Hispanic residents, the state gained four seats in Congress that cycle” (Khalifa). Instead of creating a district with “a Black and Hispanic majority that could have made their seats safer in a Democratic wave election”, the Republicans chose to keep “their numbers in Dallas County and purposefully diluted the voting strength of voters of color in the Texas House map and in several congressional districts” (Khalifa). This temporarily sparked. The replacement maps were considered "discriminatory" in some ways (Khalifa). She also said that the state Republicans positioned themselves to establish their power
  • 12. further because "they held onto their 20-year majority in the recent election” (Khalifa). However, the voting rights groups will likely raise concerns “that the cost of the retrenchment will be the continued disenfranchisement of voters of color” (Khalifa). As we can see, this issue has led to the denial of the rights that the voters of color have, which would be the right to vote. Overall, I feel like race needs consideration when redistricting because it would be fair to the people of color, especially their voting rights. Furthermore, it would allow the legislatures to become more representative of the people of Texas. After reading and providing the evidence to support my view, I believe that redistricting is an appropriate tool in representing the minority or underserved populations, only if gerrymandering is unused against minorities. As I mentioned before, even though gerrymandering is effective for political party advantages, there is a possibility that the people of color will not be taken into consideration and represented. We see the concerns that the voting rights groups have for what the Republicans have done. Nina Perales mentioned that lines can sometimes be drawn to disadvantage racial minorities. In the Bush v. Vera case, Sherri Mora said that the Supreme Court did not oppose the states’ consideration of race when they drew district lines or intentionally created majority-minority districts. The Court said it was unconstitutional to use race as a primary factor in drawing the districts. Then again, they can still use gerrymandering for not only political party advantage but for racial advantage. It may get approved for drawing districts that are at a political party advantage. However, each house district has a different population for certain minorities. That is why I agree redistricting is an appropriate tool to provide representations for minority or underserved populations. Minorities have worked hard in having equal rights, which means they also deserve to have equal representation. However, if gerrymandering is involved, especially when it goes against minorities, then redistricting will become an issue for that
  • 13. matter. I should also point out that it is considered unfair for some citizens since gerrymandering will always lead to a political party over another. If that is the case, then gerrymandering should not be used or involved in the redistricting process. Student Name: One of the best ways to deepen mathematical understanding is by writing. When you try to articulate the process, your mind connects the concepts at a higher level. For many of the projects or assignments in this class, you will submit a write-up based on discussion questions and your mathematical thinking process. Because this write-up includes writing and math, it is called a WAM. Your WAM can be fun and creative, and must be in complete sentences. What To Do: In this project, you will be analyzing patterns from an input/output machine to find a pattern and function rule. Instructions View the rubric below to see how this Assignment will be graded. Then follow the instructions below to complete and submit this Assignment. 1. Open the “Function Machine” game at this website. 2. Click on “Advanced”. Start at Activity Level 1. You will enter your input by clicking on “You Decide the Input” and the machine will provide an output. 3. Enter five inputs and share your table below: Input (x) Output (y) 2 1 4
  • 14. 3 6 5 8 7 10 70 4. Share the rule for your function above: 5. Start a new function! Change the Activity Level to 2. 6. Enter five inputs and share your table below: Input (x) Output (y) 2 -1 4 3 6 7 8 11 10 15 7. Share the rule for your function above: 8. Start a new function! Change the Activity Level to 3. 9. Enter five inputs and share your table below: Input (x) Output (y) 2 72 4 82 6
  • 15. 92 8 102 10 112 10. Share the rule for your function above: 11. WAM Write-up: In your slides, write a paragraph describing your mathematical thinking. Please use the following questions as prompts to guide your answer: a. What strategies did you use in your mathematical thought process? b. What new knowledge did you gain? c. What caused you to think about mathematics at a deeper level? d. How was your curiosity sparked by this assignment? e. How does this connect to what we've learned in class/before? f. How did you determine the answer? g. What mathematical questions are you still curious about? Demographic Trends and Population Projections for Texas and the North Texas Region Presented to January 15, 2021 Texas is experiencing significant and
  • 16. substantial growth. 3 U.S. Estimated Population 2020: 329,484,123 Texas Estimated Population 2020: 29,360,759 Texas makes up 8.9% of the total U.S. population but 32.4% of the total growth between 2019 and 2020. Source: U.S. Census Bureau, 2020 Vintage population estimates Note: These data are not from the 2020 Census, rather estimates based on the 2010 Census 4 Population Growth of Select States, 2000-2019 2000 Population 2010 Population 2019 Population
  • 17. Numeric Change 2010‐ 2019 Percent Change 2010‐ 2019 United States 281,421,906 308,745,538 32,823,9523 19,481,418 6.3% Texas 20,851,820 25,145,561 28,995,881 3,849,790 15.3% California 33,871,648 37,253,956 39,512,223 2,257,704 6.1% Florida 15,982,378 18,801,310 21,477,737 2,673,173 14.2% Georgia 8,186,453 9,687,653 10,617,423 928,694 9.6% North Carolina 8,049,313 9,535,483 10,488,084 952,333 10.0% Washington 5,894,121 6,724,540 7,614,893 890,353 13.2% Arizona 5,130,632 6,392,017 7,278,717 886,429 13.9% Colorado 5,029,196 5,029,196 5,758,736 729,417 14.5% Texas adds more population than any other state and at a fast rate. Source: U.S. Census Bureau, 2000 and 2010 Decennial Census; 2019 Vintage population estimates
  • 18. Top 15 Metros in Numeric Growth, 2010‐ 2019 Rank Name April 1, 2010 July 1, 2018 July 1, 2019 Numeric Change Percent Change 1 Dallas‐ Fort Worth‐ Arlington, TX 6,366,537 7,455,756 7,573,136 1,206,599 19.0 2 Houston‐ The Woodlands‐ Sugar Land, TX 5,920,487 4,849,209 7,066,141 1,145,654 19.4 3 Phoenix‐ Mesa‐ Chandler, AZ 4,193,129 4,849,209 4,948,203 755,074 18.0 4 Atlanta‐ Sandy Springs‐ Alpharetta, GA 5,286,718 6,976,147 6,020,364 733,646 13.9 5 Washington‐ Arlington‐ Alexandria, DC‐ VA‐ MD‐ WV 5,649,688 5,945,303 6,280,487 630,799 11.2 6 Miami‐ Fort Lauderdale‐ Pompano Beach, FL 5,566,274 6,143,837 6,166,488 600,214 10.8 7 Seattle‐ Tacoma‐ Bellevue, WA 3,439,808 3,935,179 3,979,845 540,037 15.7 8 Austin‐ Round Rock‐ Georgetown, TX 1,716,323 2,165,497 2,227,083 510,760 29.8 9 Orlando‐ Kissimmee‐ Sanford, FL 2,134,399 2,574,838 2,608,147 473,748 22.2 10 Riverside‐ San Bernardino‐ Ontario, CA 4,224,948 4,612,542 4,650,631 425,683 10.1 11 Denver‐ Aurora‐ Lakewood, CO 2,543,608 2,931,665 2,967,239 423,631 16.7 12 Tampa‐ St. Petersburg‐ Clearwater, FL 2,783,485 3,154,649 3,194,831 411,346 14.8 13 San Antonio‐ New Braunfels, TX 2,142,520 2,512,379 2,550,960 408,440 19.1
  • 19. 14 San Francisco‐ Oakland‐ Berkeley, CA 4,335,593 4,726,314 4,731,803 396,210 9.1 15 Charlotte‐ Concord‐ Gastonia, NC‐ SC 2,243,963 2,592,950 2,636,883 392,920 17.5 5 Source: U.S. Census Bureau, 2019 Vintage Population Estimates DFW leads nation in metro growth for the 4th year in a row. Five of the 15 largest U.S. cities are in Texas. Rank Place Census 2010 2011 2012 2013 2014 2015 2016 2017 2018 2019 1 New York, NY 8,175,133 8,272,948 8,346,693 8,396,091 8,433,806 8,463,049 8,469,153 8,437,478 8,390,081 8,336,817 2 Los Angeles, CA 3,792,621 3,820,876 3,851,202 3,881,622 3,909,901 3,938,568 3,963,226 3,975,788 3,977,596 3,979,576 3 Chicago, IL 2,695,598 2,708,114 2,719,141 2,725,731 2,727,066 2,724,344 2,716,723 2,711,069 2,701,423 2,693,976 4 Houston, TX 2,099,451 2,126,032 2,161,593 2,199,391 2,241,826 2,286,908 2,309,544 2,316,750 2,318,573 2,320,268 5 Phoenix, AZ 1,445,632 1,469,796 1,499,274 1,526,491 1,555,445 1,583,690 1,612,199 1,633,560 1,654,675 1,680,992 6 Philadelphia, PA 1,526,006 1,540,466 1,551,824 1,558,313 1,565,460 1,571,065 1,576,051 1,580,601 1,583,592 1,584,064 7 San Antonio, TX 1,327,407 1,357,120 1,383,075 1,408,339 1,435,456 1,464,043 1,487,843 1,511,154 1,530,016 1,547,253
  • 20. 8 San Diego, CA 1,307,402 1,319,592 1,336,776 1,355,320 1,375,831 1,387,323 1,402,089 1,412,621 1,421,917 1,423,851 9 Dallas, TX 1,197,816 1,218,282 1,242,115 1,258,835 1,279,098 1,301,329 1,323,916 1,342,479 1,341,802 1,343,573 10 San Jose, CA 945,942 970,369 983,530 1,001,279 1,014,273 1,025,980 1,030,242 1,032,335 1,028,020 1,021,795 11 Austin, TX 790,390 828,459 854,482 875,003 901,170 921,114 939,447 951,553 962,469 978,908 12 Jacksonville, FL 821,784 829,609 837,013 842,735 852,494 865,836 880,520 892,025 902,437 911,507 13 Fort Worth, TX 741,206 764,142 781,046 796,073 815,057 835,356 856,177 874,809 893,216 909,585 14 Columbus, OH 787,033 800,607 812,740 827,797 841,673 854,950 866,894 881,694 890,869 898,553 15 Charlotte, NC 731,424 754,829 773,264 792,047 807,400 825,668 843,117 860,002 872,514 885,708 Source: U.S. Census Bureau, 2019 Vintage Population Estimates 6 Rank Geographic Area Population Estimate Change, 2018 to 2019 July 1, 2018 July 1, 2019 Number Percent 1 Phoenix, AZ 1,654,675 1,680,992 26,317 1.6
  • 21. 2 San Antonio, TX 1,530,016 1,547,253 17,237 1.1 3 Austin, TX 962,469 978,908 16,439 1.7 4 Fort Worth, TX 893,216 909,585 16,369 1.8 5 Charlotte, NC 872,514 885,708 13,194 1.5 6 Frisco, TX 188,452 200,490 12,038 6.4 7 Seattle, WA 742,235 753,675 11,440 1.5 8 Denver, CO 716,265 727,211 10,946 1.5 9 Henderson, NV 309,518 320,189 10,671 3.4 10 Mesa, AZ 507,945 518,012 10,067 2.0 11 Jacksonville, FL 902,437 911,507 9,070 1.0 12 Chico, CA 94,342 103,301 8,959 9.5 13 Atlanta, GA 498,183 506,811 8,628 1.7 14 Las Vegas, NV 643,228 651,319 8,091 1.3 15 Meridian, ID 106,464 114,161 7,697 7.2 7 Source: U.S. Census Bureau, 2019 Vintage Population Estimates; Note: among places with populations of 50,000 or more in 2018 Texas cities among top 15 US cities with largest numeric increase
  • 22. between 2018 and 2019. Rank Geographic Area Population Estimate Change, 2018 to 2019 July 1, 2018 July 1, 2019 Number Percent 1 Leander, TX 55,924 62,608 6,684 12.0 2 Apex, NC 53,859 59,300 5,441 10.1 3 Chico, CA 94,342 103,301 8,959 9.5 4 Doral, FL 60,762 65,741 4,979 8.2 5 Bentonville, AR 51,103 54,909 3,806 7.4 6 Meridian, ID 106,464 114,161 7,697 7.2 7 Georgetown, TX 74,275 79,604 5,329 7.2 8 Buckeye, AZ 74,339 79,620 5,281 7.1 9 New Braunfels, TX 84,495 90,209 5,714 6.8 10 Redmond, WA 67,436 71,929 4,493 6.7 11 Frisco, TX 188,452 200,490 12,038 6.4 12 Fort Myers, FL 82,229 87,103 4,874 5.9 13 Lehi, UT 65,958 69,724 3,766 5.7 14 Castle Rock, CO 65,000 68,484 3,484 5.4 15 Milpitas, CA 80,208 84,196 3,988 5.0 8 Source: U.S. Census Bureau, 2019 Vintage Population Estimates; Note: among places with populations of 50,000 or more in 2018 Nearly a third of the 15 fastest-growing large cities and towns in the country are in Texas. Population and
  • 23. population growth in Texas are not evenly geographically distributed. 10,000 or less 10,001 - 50,000 50,001 - 100,000 100,001 - 500,000 500,001 - 1,000,000 1,000,001 - 6,000,000 plus Cartogram of Texas County Populations in 2010 10 Pecos Brewster Webb Hudspeth Presidio Terrell Reeves Val Verde Crockett
  • 34. Palo Pinto Stonewall Montague Hamilton Bandera Jim Wells Cochran Limestone Fort Bend Kaufman Armstrong Freestone Comanche Montgomery Glasscock Kendall Henderson Galveston
  • 37. 10,001 - 100,000 100,001 - 500,000 5000,001 - 2,000,000 2,000,001 - 4,713,325 Approximately 86% of the total Texas population is located in counties along and to the east of I-35. Source: U.S. Census Bureau, 2019 Population Estimates Total Estimated Population by County, 2019 11 Of Texas’ 254 counties, 104 lost population between 2010 and 2019. Source: U.S. Census Bureau, 2019 Population Estimates -3,663 - 0 1 - 5,000 5,001 - 25,000 25,001 - 100,000 100,001 - 620,149
  • 40. King Oldham Zavala Dimmit Jack Kent Gray Cass Kimble Lynn Wise Lamb Floyd Andrews Terry Coke Llano Milam Travis Ector Knox
  • 51. Rains Gregg San Augustine Morris Franklin Somervell Rockwall Estimated Numeric Change by County, 2010‐ 2019 Pecos Brewster Webb Hudspeth Presidio Culberson Terrell Reeves
  • 54. Tyler Gray Cass Medina Kimble Lynn Wise Hunt Rusk Lamb Floyd Andrews Liberty Terry Coke Llano Milam Travis Ector Smith Knox
  • 62. Hopkins Palo Pinto Stonewall Montague Hamilton Jim Wells Cochran Limestone Fort Bend Kaufman Armstrong Freestone Comanche Montgomery Glasscock Kendall Henderson Galveston
  • 65. Somervell Rockwall 12 The suburban ring counties are among the fastest growing, even faster than the Texas population as a whole. Source: U.S. Census Bureau, 2019 Population Estimates -33% - -5% -4% - 0% 1% - 15% 16% - 31% 32% - 106% Estimated Percent Change by County, 2010‐ 2019 What is driving population growth in Texas? 14 About 1,006 people per day added to our population.
  • 66. • About 483 persons per day from natural increase (more births than deaths) • About 523 per day from net migration (178 international and 345 domestic migrants per day). Natural Increase 48%Domestic Migration 34% International Migration 18% Texas added 367,215 people between July 1, 2018 and July 1, 2019. Source: U.S. Census Bureau, 2018 Population Estimates. 15 213,651 208,964 205,795 213,541 214,380 212,021 209,690 190,951 175,878 70,535 76,954 82,449 95,661 110,155 111,983 110,417 104,976
  • 68. 450,000 500,000 2011 2012 2013 2014 2015 2016 2017 2018 2019 Components of Population Change, 2011‐ 2019 Natural Increase International Migration Domestic Net Migration Migration and natural increase contribute about equally to population growth in Texas. Source: U.S. Census Bureau, 2019 Vintage population estimates 16 Top Counties for Numeric Growth in Texas, 2018-2019 County U.S. Rank 2019 Population Estimate Population Change 2018‐ 2019 Percent of Change from Natural Increase
  • 69. Percent of Change from Domestic Migration Percent of Change from International Migration Harris 3 4,713,325 33,280 116.5% ‐ 91.5% 74.8% Collin 4 1,034,730 30,423 20.8% 65.6% 13.5% Denton 5 887,207 28,466 19.8% 74.0% 5.8% Travis 6 1,273954 27,382 32.7% 51.0% 15.7% Williamson 9 590,551 24,088 15.3% 81.0% 3.3% Fort Bend 10 811,688 23,607 24.4% 57.1% 18.5% Bexar 11 2,003,554 22,367 56.0% 33.5% 10.5% Tarrant 12 2,102,515 21,069 65.1% 12.1% 23.0% Montgomery 16 607,391 17,621 18.3% 76.2% 5.3% Comal 46 156,209 8,068 4.3% 94.2% 1.1% Kaufman 49 136,154 7,875 9.4% 90.5% ‐ 0.1% Bell 53 362,924 7,527 48.3% 49.8% 1.5% Hays 54 230,191 7,485 19.9% 76.8% 2.8% Hidalgo 74 868,707 6,409 147.6% ‐ 47.4% ‐ 0.3% Dallas 77 2,635,516 6,166 345.9% ‐ 395.5% 149.9% Source: U.S. Census Bureau, 2019 Population Estimates Note: Harris, Dallas, and Hidalgo Counties had negative net mig ration.
  • 70. 17 Top Counties for Percent Growth* in Texas, 2018-2019 County100 U.S. Rank 2019 Population Estimate Population Change 2018‐ 2019 Percent Population Change 2018‐ 2019 Percent of Population Change from Natural Increase Percent of Population Change from Domestic Migration Percent of Population
  • 71. Change from International Migration Kaufman 2 136,154 7,875 6.1% 9.4% 90.5% ‐ 0.1% Comal 4 156,209 8,068 5.4% 4.3% 94.2% 1.1% Rockwall 6 104,915 4,369 4.3% 9.8% 88.6% 1.5% Williamson 9 590,551 24,088 4.3% 15.3% 81.0% 3.3% Kendall 14 47,431 1,828 4.0% 0.6% 97.9% 1.5% Andrews 18 18,705 694 3.9% 14.0% 84.0% 2.0% Chambers 20 43,837 1,610 3.8% 17.8% 80.1% 2.2% Parker 25 142,878 4,808 3.5% 8.2% 90.9% 0.7% Hays 28 230,191 7,485 3.4% 19.9% 76.8% 2.8% Denton 32 887,207 28,466 3.3% 19.8% 74.0% 5.8% Ellis 34 184,826 5,820 3.3% 16.0% 83.2% 0.7% Waller 36 55,246 1,734 3.2% 20.0% 78.4% 1.4% Gaines 37 21,492 672 3.2% 46.0% 43.9% 10.0% Collin 49 1,034,730 30,423 3.0% 20.8% 65.6% 13.5% *Among counties with populations of 10,000 or more in 2018. Source: U.S. Census Bureau, 2019 Population Estimates Source: U.S. Census Bureau, State to State Migration Flows, 20 19; for infographic: https://demographics.texas.gov/Infographic s/2020/TexasNetMigration Texas among the highest in-migration flows states, CA biggest net sending state. 18
  • 72. Estimated County-to-County Migration Flows, Dallas and Tarrant Counties, 2014-2018 19 In‐ Flows Net Migration Tarrant County 15,284 ‐ 3,865 Collin County 13,742 ‐ 3,522 Denton County 9,826 ‐ 8,981 Asia 8,287 Central America 7,263 Harris County 4,589 ‐ 108 Los Angeles County, CA 2,782 1,245 Africa 2,774 Bexar County 2,495 988 Kaufman County 2,263 ‐ 3,033 Travis County 1,934 ‐ 1,071 Ellis County 1,903 ‐ 850 Rockwall County 1,893 ‐ 795
  • 73. Cook County, IL 1,794 1,187 Source: U.S. Census Bureau, American Community Survey Cou nty to County Migration Flows, 2014‐ 2018 Dallas County Tarrant County In‐ Flows Net Migration Dallas County 19,149 3,865 Asia 5,751 Denton County 5,265 ‐ 2,167 Johnson County 3,887 346 Central America 3,653 Harris County 3,577 963 Africa 2,693 Parker County 2,652 ‐ 953 Collin County 1,906 ‐ 707 Bexar County 1,659 222 Los Angeles County, CA 1,515 859 Travis County 1,352 ‐ 701 Lubbock County 1,333 ‐ 719 Wise County 1,270 ‐ 656
  • 74. As Texas grows, it ages and continues to diversify. Race/Ethnicity Composition, Texas, 2010-2019 NH White 41% NH Black 12% Hispanic 40% NH Asian 5% NH Other 2% 2019 NH White, 45% NH Black, 12%
  • 75. NH Asian, 4% NH Other, 2% Hispanic, 38% 2010 Race/Ethnicity 2019 Population Estimate NH White 11,950,774 Hispanic 11,525,578 NH Black 3,501,610 NH Asian 1,457,549 NH Two or More Races 425,866 NH American Indian & Alaska Native 94,168 NH Native Hawaiian & Other Pacific Islander 25,861 Population Change by Race/Ethnicity, 2010-2019
  • 76. 2,064,657 601,726 522,136 497,006 164,795 53.6% 15.6% 13.6% 12.9% 4.3% 0.0% 10.0% 20.0% 30.0% 40.0% 50.0% 60.0% 0 500,000 1,000,000 1,500,000 2,000,000 2,500,000 Hispanic NH Black NH White NH Asian NH Other
  • 77. Share of Contribution to Total Population Change, 2010‐ 2019 Numeric Change, 2010‐ 2019 Nearly 87% of growth has been from non‐ White population groups. Source: U.S. Census Bureau. 2019 Population Estimates 23 Race/Ethnicity Composition, DFW Metro and Its Counties, 2019 NH White 45% NH Black 16% NH Other 3% NH Asian 7% Hispanic 29% DFW Metro Area Source: U.S. Census Bureau, American Community Survey 2019 1‐ Year Estimates NH White NH Black NH Asian Hispanic NH Other
  • 78. Dallas 28.3% 22.7% 6.5% 40.8% 1.7% Collin 55.1% 10.4% 16.1% 15.5% 2.8% Denton 57.6% 10.5% 9.5% 19.6% 2.7% Ellis 58.9% 11.6% 0.7% 26.9% 1.9% Hood 83.5% 1.0% 0.8% 12.8% 1.9% Hunt 70.4% 7.8% 1.4% 17.6% 2.7% Johnson 70.1% 3.8% 0.9% 22.6% 2.6% Kaufman 59.8% 13.3% 1.4% 23.3% 2.3% Parker 82.6% 1.5% 0.6% 13.0% 2.3% Rockwall 69.0% 7.1% 3.1% 18.6% 2.3% Somervell 77.8% 1.0% 0.7% 18.1% 2.4% Tarrant 45.3% 17.0% 5.6% 29.5% 2.6% Wise 76.0% 1.3% 0.6% 20.0% 2.1% Source: U.S. Census Bureau, 2019 Population Estimates 24 Total NH White NH Black NH Asian Hispanic NH Other Tarrant County 293,481 13,761 94,029 34,131 136,733 14,827 Dallas County 267,377 ‐ 41,646 76,935 53,005 168,255 10,828 Collin County 252,389 75,245 42,600 78,797 45,282 10,465
  • 79. Denton County 224,593 83,363 38,773 40,766 53,069 8,622 Ellis County 35,216 10,640 8,178 551 14,544 1,303 Kaufman County 32,804 9,003 7,550 948 14,115 1,188 Rockwall County 26,578 14,188 2,987 1,349 7,072 982 Parker County 25,951 18,276 269 248 6,197 961 Johnson County 24,883 7,441 2,807 608 12,444 1,583 Hunt County 12,465 4,997 713 468 5,632 655 Wise County 10,857 6,036 353 167 3,853 448 Hood County 10,461 6,843 395 200 2,664 359 Somervell County 638 478 39 25 27 69 Numeric Change by Race/Ethnicity, DFW Counties, 2010-2019 Source: U.S. Census Bureau, 2019 Population Estimates Hispanics adding largest numbers in two largest DFW counties as well as in Ellis, Kaufman, Johnson, and Hunt Counties; NH Whites adding greatest numbers in Denton, Rockwall, Parker, Wise, Hood, and Somervell, but declining in Dallas County; Asians adding larges t numbers in Collin County. 25 Total NH White NH Black NH Asian Hispanic NH Other Rockwall County 33.9% 24.4% 67.5% 71.9% 56.7% 70.1% Denton County 33.9% 19.5% 71.3% 93.2% 43.9% 55.0% Collin County 32.3% 15.2% 65.4% 89.2% 39.3% 55.6% Kaufman County 31.7% 12.4% 71.3% 106.0% 80.4% 63.0% Ellis County 23.5% 10.8% 61.9% 66.6% 41.4% 58.0% Parker County 22.2% 18.3% 14.6% 39.1% 49.9% 42.5% Hood County 20.4% 15.3% 172.5% 66.4% 50.9% 45.4% Wise County 18.4% 12.8% 61.6% 71.4% 38.1% 43.2% Johnson County 16.5% 6.4% 73.3% 63.1% 45.6% 51.5%
  • 80. Tarrant County 16.2% 1.5% 35.7% 40.6% 28.3% 38.1% Hunt County 14.5% 7.8% 10.2% 51.3% 47.9% 32.6% Dallas County 11.3% ‐ 5.3% 14.8% 44.4% 18.6% 30.9% Somervell County 7.5% 7.2% 70.9% 61.0% 1.7% 46.6% Between 2010 and 2019, Rockwall, Denton, Collin, and Kaufma n grew faster than other DFW Counties; Asians grew faster than other race groups in most DF W Counties, except for Johnson and Somervell Counties, where African Americans grew fastest, and Parker County, where Hispanics grew the fastest. Source: U.S. Census Bureau, 2019 Population Estimates Percent Chane by Race/Ethnicity Composition, DFW Counties, 2010-2019 26 Percent Hispanic, DFW Census Tracts, 2019 Source: U.S. Census Bureau, 2010 Decennial Census, 2019 Ame rican Community Survey 5‐ Year Estimates 27 Percent Non-Hispanic Black, DFW Census Tracts, 2019 Source: U.S. Census Bureau, 2010 Decennial Census, 2019 Ame rican Community Survey 5‐ Year Estimates
  • 81. 28 Percent Non-Hispanic Asian, DFW Census Tracts, 2019 Source: U.S. Census Bureau, 2010 Decennial Census, 2019 Ame rican Community Survey 5‐ Year Estimates 29 Texas is relatively young but aging. Source: U.S. Census Bureau, 2010 Decennial Census, 2019 Ame rican Community Survey 1‐ Year Estimates 35.3 38.5 32.3 35.1 29.0 30.0 31.0 32.0 33.0 34.0 35.0 36.0 37.0 38.0 39.0
  • 82. Change in Median Age, U.S. and Texas, 2000‐ 2019 U.S. TX 30 0 200,000 400,000 600,000 800,000 1,000,000 1,200,000 < 05 05‐ 09 10‐ 14 15‐ 19 20‐ 24 25‐ 29 30‐ 34 35‐ 39 40‐ 44 45‐ 49 50‐ 54 55‐ 59 60‐ 64 65‐ 69 70‐ 74 75‐ 79 80‐ 84 85‐ 89 90‐ 94 95+ NH White Hispanic In Texas in 2019, there are more Hispanics than NH Whites below age 45; more NH Whites at 45 and older. Source: Texas Demographic Center, 2019 Population Estimates
  • 83. 31 2018 1.87 2016 2.02 2014 2.09 2012 2.08 2010 2.16 2008 2.36 2006 2.36 Total 1.92 NH White 1.71 NH Black 1.83 Hispanic 2.14 Total Fertility Rates Total Fertility Rate by Race/Ethnicity, 2017 Source: Centers for Disease Control and Prevention, National C enter for Health Statistics, National Vital Statistics Reports Total Fertility Rates, Texas 32Source: Centers for Disease Control and Prevention, National
  • 84. Center for Health Statistics, National Vital Statistics Report; de nominator derived from U.S Census Bureau, Intercensal Estimates, 2010‐ 2019 Population Estimates Birth Rates by Race/Ethnicity, Texas, 2006-2018 33 ‐ 200,000 ‐ 100,000 0 100,000 200,000 300,000 400,000 500,000 600,000 700,000 Under 18 18 to 24 25 to 44 45 to 64 65 Plus NH White NH Black Hispanic NH Asian NH Other Numeric Change in Age Group by Race/Ethnicity, Texas,
  • 85. 2010-2019 Source: U.S. Census Bureau, 2019 Population Estimates Period of Entry by Area of Birth for Foreign Born Population in Texas 34Source: U.S. Census Bureau, 2019 American Community Surv ey, 1‐ Year PUMS 4.5 3.0 4.2 30.5 21.6 19.1 11.0 6.2 2.8 52.6 68.1 72.5
  • 86. 0.0 10.0 20.0 30.0 40.0 50.0 60.0 70.0 80.0 90.0 100.0 Entered after 2010 Entered 2000 to 2009 Entered before 2000 Percent A xi s Ti tl e Europe Asia Africa Oceania Latin America Northern America 35 Total Foreign Born Population 4,951,156 Latin America 3,271,403* Mexico 2,453,126* Central America Belize, Costa Rica, El Salvador,1 Guatemala,3 Honduras,2 Nicaragua, Panama 510,150 South America Argentina, Bolivia, Brazil, Chile, Colombia,2 Ecuador, Guyana, Peru, Uruguay, Venezuela1 191,933
  • 87. Caribbean Bahamas, Barbados, Cuba,1 Dominica, Dominican Republic3, Grenada, Haiti, Jamaica2, St. Vincent & the Grenadines, Trinidad and Tobago, West Indies 116,194 Asia 1,126,507 South Central Asia Afghanistan, Bangladesh, India,1 Iran, Kazakhstan, Nepal, Pakistan, Sri Lanka, Uzbekistan 449,906 South Eastern Asia Cambodia, Indonesia, Laos, Malaysia, Burma, Philippines,2 Singapore, Thailand, Vietnam1 360,043 Eastern Asia China,1 Hong Kong, Taiwan,3 Japan, Korea2 227,580 Western Asia Iraq,1 Israel, Jordan, Kuwait, Lebanon, Saudi Arabia2, Syria, Yemen, Turkey,3 Armenia 82,776 Source: U.S. Census Bureau, 2019 American Community Survey 1‐ Year Estimates Place of Birth for the Foreign Born Population, Texas, 2019 36 Questions?
  • 88. What’s ahead for the population of Texas? Projected Population, Texas, 2010-2030 38Source: Texas Demographic Center, 2014 and 2018 Populatio n Projections 25.1 34.9 20 22 24 26 28 30 32 34 36 38 40
  • 89. M ill io ns Zero Migration 0.5 Migration 1.0 Migration 2010‐ 2015 Migration 29.7 39Source: Texas Demographic Center, 2018 Vintage Population Projections, 2010‐ 2015 Migration Scenario Population Projections by Race/Ethnicity, Texas, 2010-2030 11.4 12.8 2.9 4.3 9.5 14.5 0.9 2.4
  • 90. 0.5 0.9 0 2 4 6 8 10 12 14 16 2010 2011 2012 2013 2014 2015 2016 2017 2018 2019 2020 2021 2022 2023 2024 2025 2026 2027 2028 2029 2030 M ill io ns NH White NH Black Hispanic NH Asian NH Other 40
  • 91. Population Projections, DFW Metro Counties, 2010-2030 Source: Texas Demographic Center, 2018 Population Projection s 3,106,298 2,507,170 1,391,461 1,234,110 0 500,000 1,000,000 1,500,000 2,000,000 2,500,000 3,000,000 3,500,000 2010 2012 2014 2016 2018 2020 2022 2024 2026 2028 2030 Dallas Tarrant Collin
  • 93. Johnson Ellis Parker Kaufman Hunt Rockwall Wise Hood Somervell Population Projections, DFW Metro Counties, 2010-2030 42 Population Projections by Race/Ethnicity, DFW Metro Area, 2010- 2030 Source: Texas Demographic Center 2018 Population Projections 3,197,326 3,667,178 941,320
  • 95. 43 45 Texas’s Most Vulnerable Populations • Income disparities place African Americans and Latinos at greater risk during times of income loss. • Renters, renters w/low incomes, Blacks, and households w/children face greater risk of eviction. • Persistently low health insurance coverage in the state increases vulnerability of Texans with employer based insurance. Source: Texas Demographic Center, https://demographics.texas. gov/Resources/publications/2020/20200918_ACS2019Brief_Tex asMostVulnerablePopulations.pdf 46 Questions? Lila Valencia, Ph.D.
  • 96. (512) 936‐ 3542 [email protected] demographics.texas.gov @TexasDemography @TexasDemographics 47 Implications of population growth and demographic shifts on Texas socio-economic indicators Population 25 and Older with High School Diploma and Above, Texas, 2011-2019 Source: U.S. Census Bureau. American Community Survey, 1‐ Year Estimates 81.1 84.6 92.5 94.4 86.2 91.2
  • 98. Total NH White Black Asian Hispanic 50 Population 25 and Older with Bachelors Degree and Above, Texas, 2011-2019 Source: U.S. Census Bureau. American Community Survey, 1‐ Year Estimates 26.4 30.8 34.8 39.4 20.3 25.7 52.5 60.6 12.0 16.1 0 10 20 30
  • 99. 40 50 60 70 2011 2012 2013 2014 2015 2016 2017 2018 2019 Pe rc en t Total NH White Black Asian Hispanic 51 84.6 94.4 91.2 89.4 68.3 30.8 39.4 25.7 60.6
  • 100. 16.1 0 10 20 30 40 50 60 70 80 90 100 Total NH White Black Asian Hispanic Total NH White Black Asian Hispanic Pe rc en t Austin DFW Houston San Antonio Texas Educational Attainment by Race/Ethnicity, Big Four Metros &
  • 101. Texas, 2019 High School Degree and above Bachelor’s Degree and above Educational attainment is slightly higher in the DFW metro than in Texas overall, except for Hispanics. However, educational disparities by race/ethnicity are still evident, especially for Hispanics. Source: U.S. Census Bureau. American Community Survey, 201 9 1‐ Year Estimates 52 $74,974 $91,706 $70,079 $78,905 $43,482 $52,010 $41,786 $47,428 $0 $10,000
  • 102. $20,000 $30,000 $40,000 $50,000 $60,000 $70,000 $80,000 $90,000 $100,000 2010 2011 2012 2013 2014 2015 2016 2017 2018 2019 M ed ia n H ou se ho ld In co m e
  • 103. (A dj us te d D ol la rs ) Asian NH White Hispanic Black Median Household Income by Race/Ethnicity, Texas, 2010-2019 Source: U.S. Census Bureau. American Community Survey, 1‐ Year Estimates 53 $64,034 $78,905 $52,010 $47,428 $91,706 $0
  • 104. $20,000 $40,000 $60,000 $80,000 $100,000 $120,000 Total NH White Hispanic Black Asian M ed ia n H ou se ho ld In co m e Austin Dallas Houston San Antonio Texas Median Household Income by Race/Ethnicity, Big Four Metros & Texas, 2019
  • 105. Source: U.S. Census Bureau. American Community Survey, 201 9 1‐ Year Estimates Median incomes are higher in the DFW metro than in Texas overall. However, disparities by race/ethnicity are still evident, especially for Hispanics and Blacks. 54 Median Earnings for Full‐ Time, Year‐ Round Work DFW Metro Area Texas Total $50,677 $46,434 Male $53,428 $51,125 Female $45,455 $40,670 Pay Gap $0.85 $0.80 Median Earnings, DFW Metro and Texas, 2019 Source: U.S. Census Bureau. American Community Survey, 201 9 1‐ Year Estimates Poverty and Uninsured Rates by Race/Ethnicity, Texas, 2019 Texas US Population Below Poverty Estimate Percent Estimate Percent
  • 106. Black or African American 634,381 18.6 8,557,464 21.2 Asian 131,705 9.2 1,761,321 9.6 Hispanic or Latino 2,113,153 18.7 10,201,081 17.2 NH White 933,323 8.0 17,352,095 9.0 Texas US Uninsured Population Estimate Percent Estimate Percent Black or African American 517,133 15.0 4,124,039 10.1 Asian 161,969 11.3 1,218,462 6.6 Hispanic or Latino 3,258,356 28.6 11,135,068 18.7 NH White 1,240,220 10.6 12,130,924 6.3 Source: U.S. Census Bureau, 2019 American Community Survey , 1‐ Year Estimates 56 18.4% 10.6% 28.6% 15.0% 11.3%
  • 107. 13.6% 8.0% 18.7% 18.6% 9.2% 0.0% 5.0% 10.0% 15.0% 20.0% 25.0% 30.0% 35.0% Total NH White Hispanic Black Asian Total NH White Hispanic Black Asian Austin Dallas Houston San Antonio Texas Percent Uninsured, Below Poverty by Race/Ethnicity, Big Four Metros & Texas, 2019 Source: U.S. Census Bureau. American Community Survey, 201 9 1‐ Year Estimates Percent Uninsured
  • 108. Percent Poverty Rate Uninsurance and poverty rates are lower in the DFW metro than in Texas overall, except for Hispanics where their uninsurance rate is higher. However, disparities by race/ethnicity are still evident, especially for Hispanics and Blacks. 57 Source: Brookings, https://www.brookings.edu/interactives/metr o‐ recovery‐ index/