International Business Report: How U.S. manufacturing, retail stack up
•
0 likes•712 views

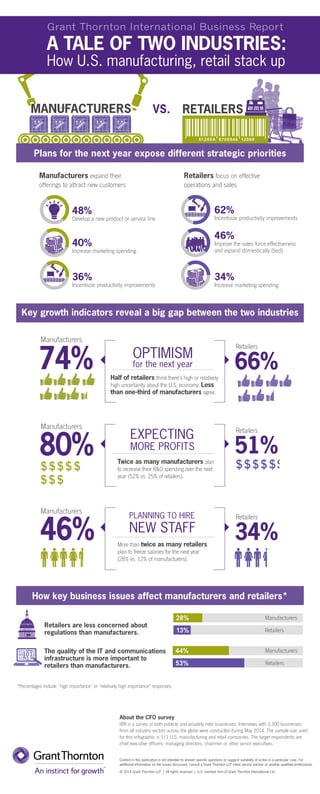
The latest Grant Thornton International Business Report (IBR) shows an overall optimistic view of the U.S. economy. But a closer look at two of the country’s iconic industries reveals a different story. A poster child for America’s economic rebound, manufacturing basks in a positive outlook and robust demand. Meanwhile, retail struggles under the weight of its brick-and-mortar legacy and fickle consumers. This infographic compares manufacturing and retail data from the IBR report and captures two different views of the near-term economic future. More at http://gt-us.co/1nTFsGC
Recommended

Recommended
More Related Content
What's hot
What's hot (20)
Similar to International Business Report: How U.S. manufacturing, retail stack up
Similar to International Business Report: How U.S. manufacturing, retail stack up (20)
More from Grant Thornton LLP
More from Grant Thornton LLP (20)
Recently uploaded
Recently uploaded (9)
International Business Report: How U.S. manufacturing, retail stack up
- 1. A TALE OF TWO INDUSTRIES: How U.S. manufacturing, retail stack up Grant Thornton International Business Report Content in this publication is not intended to answer specific questions or suggest suitability of action in a particular case. For additional information on the issues discussed, consult a Grant Thornton LLP client service partner or another qualified professional. © 2014 Grant Thornton LLP | All rights reserved | U.S. member firm of Grant Thornton International Ltd About the CFO survey IBR is a survey of both publicly and privately held businesses. Interviews with 3,300 businesses from all industry sectors across the globe were conducted during May 2014. The sample size used for this infographic is 111 U.S. manufacturing and retail companies. The target respondents are chief executive officers, managing directors, chairmen or other senior executives. Manufacturers expand their offerings to attract new customers 48+52+N Retailers focus on effective operations and sales MANUFACTURERS Key growth indicators reveal a big gap between the two industries Retailers are less concerned about regulations than manufacturers. VS. Develop a new product or service line EXPECTING MORE PROFITS PLANNING TO HIRE NEW STAFF 46% 34%More than twice as many retailers plan to freeze salaries for the next year (28% vs. 12% of manufacturers). The quality of the IT and communications infrastructure is more important to retailers than manufacturers. 44% 53% Manufacturers Retailers How key business issues affect manufacturers and retailers* Manufacturers Retailers OPTIMISM for the next year 80% 51%Twice as many manufacturers plan to increase their R&D spending over the next year (52% vs. 25% of retailers). Manufacturers Retailers 74% 66%Half of retailers think there’s high or relatively high uncertainty about the U.S. economy. Less than one-third of manufacturers agree. Manufacturers Retailers 48% 40+60+N Increase marketing spending 40% 36+64+N Incentivize productivity improvements 36% 62+38+N 62% 46+54+N 46% 34+66+N 34% Improve the sales force effectiveness and expand domestically (tied) Increase marketing spending Incentivize productivity improvements Plans for the next year expose different strategic priorities *Percentages include “high importance” or “relatively high importance” responses. RETAILERS 13% 28% Manufacturers Retailers