1. Modeling Separation Systems with Aspen Plus
Introduction
Some of the first things one is taught in a mass transfer course are the derivation of the Kremser equations and
the McCabe-Thiele method. Especially in the McCabe-Thiele method, the emphasis is on determining the size
of a mass transfer device to perform a given task. The boundary conditions of the problem are given, and the
engineer determines the internal structure needed to satisfy these conditions. A binary separation problem can
be described quite accurately by the McCabe-Thiele procedures. However, many assumptions have to be made
if the problem involves more than two components. When the stakes were high enough, companies were
willing to have many engineers work on a team to manually solve the more rigorous tray-to-tray,
multicomponent problem.
With the invention and implementation of the digital computer, an early problem that was tried was the
distillation column. These successes led to attempts to solve multiple columns and eventually entire flowsheets
in a single program. The end result was the sequential-modular simulator. The name comes from the solving
modules, which represent unit operation steps, in a sequential manner. In the 1970’s, several companies
brought commercial versions of these programs to the market. In addition, the major chemical and petroleum
companies had in-house versions of simulators.
By the mid-1990’s, the Aspen Plus simulator had evolved as the ultimate survivor. The original version was
run on a mainframe computer as a batch job. The most likely input form was punched cards and the output was
a large line printer stack of paper in which everything was printed since once the job was finished, all traces
were removed from the computer to make room for the next job.
The input-output today for Aspen Plus is much changed. It now uses a GUI that follows the Microsoft
guidelines for a Windows environment. All the familiar menu functions are there and all do about the same job
as a Microsoft Office program such as Word or Excel. Yet underneath all of this is the 1970’s simulation
engine and batch file thinking. The GUI actually communicates with the Aspen Plus simulator by creating an
input file similar to the old punch card file and then submitting this to the processor for calculation. The results
are then sent back to the GUI. The user can then display the results in tables or graphs, export selected values to
programs such as Excel or Word, make changes for new runs, or print out the results file in a form much like
the line printer days.
Note that the illustrations are for Aspen Plus Version 10.2. The current version being used at the University of
Delaware is 12.1. The major differences between the versions is in the solution methods, not the user interface.
1
2. Modeling Concepts in Aspen Plus
The Aspen Plus simulator is based on the concept that the feed to each module is defined and that the outputs
from each module will be calculated. The user is expected to provide sufficient detail for each module so that
the calculations can be performed. This is a key concept in properly using the program. It does not mean that
every input stream must be explicitly specified. For example if an input to a module is the output of a fully
specified module, then the input to the second module is fully specified. If one draws a control line around the
flowsheet, then only those streams that are flowing through the control line into the flowsheet need to be
specified. Don’t forget that there is a flow of both energy and mass in the flowsheet.
The four simplest modules are the Pump, Compressor, Valve, and Heater. The Pump and Compressor increase
the pressure of the feed stream based on one of the following:
1. Specify the outlet pressure and calculate the needed power.
2. Specify the power input and calculate the outlet pressure.
The Valve calculates the new thermodynamic properties of the stream following a given adiabatic pressure
decrease. The heater changes the discharge temperature of the module based on either:
1. The specified outlet temperature and the calculated the enthalpy flow, or
2. The specified enthalpy flow and calculated the outlet temperature.
So we see that Aspen Plus has flexibility in the specification of the modules. Understanding the degrees of
freedom of a specific module is key to understanding how to implement a calculation. The Aspen Plus program
has already worked out what most of these degrees of freedom are and have imbedded this knowledge in the
‘Next’ command. Invoking this command causes the GUI program to go to the next place in input is needed in
order for the program to be properly specified. The ‘Next’ command is invoked by either pressing the <F4>
key on the keyboard or pressing the next icon button located in the middle of the Aspen Plus main toolbar. If
you are not sure of the next step, invoke the ‘Next’ command. Even if you are positive about the next step,
invoke the ‘Next’ command. It gets you there faster and sometimes you may be surprised about what Aspen
thinks is the next most important thing for you to enter.
2
3. Distillation Modeling in Aspen Plus for Beginners
The key points are understanding the results of a degrees of freedom analysis (DF) on a simple column and how
this extends to more complicated columns. My definition of a simple column is one with a single feed and a
single distillate and tail stream. Also, the simple column only has energy transfer due to the streams and a
single condenser and reboiler. Simple does not mean easy. For example, an azeotropic distillation column
where the thermodynamics are very difficult will be classified as simple if there is a single feed, distillate, and
tails. This is because the complexity of the thermodynamics has not changed the DF of what needs to be
specified in order for the column to be modeled.
As we add extra feed streams or connect extra product streams to the column, the more the DF are needed and
the column now becomes a ‘complex’ column. This will be discussed later in this paper. An excellent
reference on this subject of degrees of freedom in countercurrent cascades is found in Seader and Henley,
Chapter 5.
For the simple column, the total DF for a simple column is
DF = N + C + 9
All these can be satisfied by specifying the complete feed conditions, column operating pressure, column
pressure drop, the number of stages, the feed stage location, the reflux ratio, and the distillate rate. Please note a
major difference between my analysis and Seader and Henley’s is that I have excluded external heat transfer on
each stage. This reduces the DF by N.
Thus before we attempt to model a column in Aspen Plus, we need to be sure that
1. The feed is either fully specified or will be properly calculated by an upstream module.
2. The operating pressure of the column is known.
3. The pressure drop in the column can be specified.
4. The number of stages is specified.
5. The feed location is specified
6. We can specify the column energy balance. This is usually done by specifying the reflux ratio.
7. We can specify the column mass balance. This is usually done by specifying the distillate rate.
Please note that Aspen allows many ways to satisfy each of the above items. For example, it may be more
convenient to specify the tails rate rather than the distillate rate. Or the engineer has determined that direct
specification of a heating rate is preferred.
3
4. Running Aspen Plus for the first time
Let’s model the following distillation operation
Feed: 50000 pph
50% (molar) Methanol
50% (molar) Water
80 degrees F
20 psig
Properties Package: NRTL with Aspen parameters
Column performance
Methanol stream purity: 99% Methanol
Methanol recovery: 99.5%
Other information includes
Available steam for reboiler: 25 psig and 100 psig
Cooling water: 30 C
Delta temperature approach between process and utility: >20C, <90C
The first thing to do is start Aspen Plus. This is done by left clicking on the <Start> button, then clicking on
<Programs>, then holding the cursor over the line <AspenTech>, then over <Aspen Engineering Suite>, then
over <Aspen 11.1> and finally clicking on <Aspen Plus User Interface>. At this point your screen should look
like this
4
5. Single left click on the command <Aspen Plus User Interface> and the Aspen Plus front end program will load.
The first screen should look like the following
If this is your first simulation of a new system, then you want to select <Blank Simulation> and click <OK>.
5
6. You may have to log in to the Aspen license manager. Just follow the on-screen instructions. Once everything
is successfully done, the screen will look like the following picture. The blank space in the middle is where the
flowsheet is constructed. The <Next> button is the button with the ‘N’ in the middle of the upper toolbar. The
toolbar at the bottom of the Aspen window is the place where the icons to represent the unit operations are
located.
Let us begin by defining the flowsheet. A flowsheet must be constructed even for a simple system such as a
single heater or distillation column. The minimum flowsheet is a single operation step, a feed stream and a
product stream.
For our problem, we need to define a distillation column and the appropriate streams. If we click on the
<Columns> tab, the toolbar will show all the types of column modules available. For our case, we want the
‘RadFrac’ module. This is the rigorous stage-to-stage equilibrium model for distillation. When we click on
‘RadFrac’, a window opens showing all the display icons available for this module. The icon does not imply
what type of operation is being modeled - that is done in the input forms. Rather, the icon is a visual
6
Unit OP Toolbar
7. representation of an operation in the flowsheet. The next two figures show the RadFrac choices and the icon
placed in the flowsheet window. Note that the cursor changes from an arrow to a cross when the operation is
placement of operation icons. To return to the arrow cursor, click on the arrow in the lower left of the Aspen
window. The module is named when it is placed in the flowsheet window.
7
9. Once the module is placed on the flowsheet, the streams are added. This is done by clicking on the bottom
toolbar in the section named ‘STREAMS’. The available stream connections on the icon are displayed. The
required streams are shown in red. The optional streams are in blue. Hold the cursor over the stream you want
to connect. A message box will open naming the type of stream. Click once then drag the cursor to the point
where you want the stream to terminate and click once. A message box will now open asking you to name the
stream.
9
10. When you are finished, the screen should look like the following. Click on the arrow button to return to the
arrow cursor.
Note the message box in the lower right corner of the Aspen window. It is in red letters and says ‘Required
input incomplete’. This is one of many signals that more input is needed before the flowsheet can be solved.
Clicking on the <Next> button will take the user to the next set of input data needed. A message box will
inform the user that the flowsheet connection part is complete.
The first form to be completed is the ‘Setup’ form. This is the point where the problem statement is entered
along with selection of the units for the simulation, report formats, accounting information, etc. The purpose of
this entire section is making the simulation report look nice. For example, the accounting tab is where the user
enters his/her name. This is an optional step but highly recommended. I suggest the user explore the various
tabs since all are self-explanatory.
10
Arrow Button
11. This window is called the Data Browser. The left window in the Data Browser shows the status of the input
items. The half-red circle indicates that required input is needed for that section. The <Next> key takes the
user to those sections in the order shown on the Data Browser.
11
12. Before pressing the ‘Next’ key, it is highly recommended that the ‘Report Options’ under the ‘Setup’ Folder be
opened. The forms we want to modify are the General, Block, and Streams. These tabs control optional
information in the output file. In the General form, we want to select the checkbox ‘Summary of user input &
system defaults’. This is the only way to get a hard copy of the actual simulation you performed in your output
file. In the Block form, select ‘Begin each block report on a new page’. This is very important once you have
several blocks in the flowsheet. Finally, in the Stream form, the choices are made of how to display the stream
flow and composition results.
12
13. The <Next> key is pressed and the Components Section is displayed. This is where the components to be used
in the simulation are entered.
There are many methods of entering the component data. It is important to understand that the column labeled
‘Component ID’ is the name that the simulation will use to identify the compound to the user. The column
‘Formula’ and ‘Component name’ are the actual names used by the simulation to get the data from the various
databanks. The connection between the name the user wants to use and the databank is made on this form. The
‘Component ID’ name can be changed without affecting the actual compound being used. Changing the
‘Component name’ or ‘Formula’ will change the compound.
The recommended method to identify a compound is to enter the name to be used in the simulation in the
‘Component ID’ box. If this exactly matches a name in the databases, Aspen fills in the rest of the information.
For example, enter ‘water’ in the ID box and press the <Enter> key. The rest of the boxes are filled in as shown
in the next figure.
13
14. If we were to type in ‘methanol’, Aspen would identify this compound and we would be done with the
component input for this problem. However, it is usually more complicated for most simulations. Let us say
that we want to identify the methanol as MeOH. If we type that into the ‘Component ID’ box and press
<Enter>, the rest of the boxes are not filled. This means that Aspen cannot connect the compound to something
in its databases. What we need to do is get the correct information in either the ‘Component name’ or
‘Formula’ box. If the information entered in either box exactly matches a database entry, then Aspen fills in the
rest. If a match cannot be made, then Aspen opens a window to the database that allows one to search for the
compound. One can get directly to the database search screen by clicking on the ‘Find’ button on the
component window. When the database search window opens, either the actual name or formula can be entered
and Aspen will display all matches. In this case, I was not sure if methanol was stored as methanol or methyl
alcohol so I typed in METH. Everything in the database with the character sting ‘METH’ is displayed. At this
point, one can manually scroll through or try another entry in the find window. It turns out that methanol is the
26th
entry in the list so a manual search would not be too difficult. However I have found it better to use the
formula as the search item.
14
15. Aspen names organic compounds in the order of C, H, O, and the other elements. So if you know the number
of carbon, hydrogen, and oxygen atoms, then type these into the ‘Formula’ box and the search is usually
narrowed very quickly to a reasonable number of possibilities. The example of the search for methanol is
shown in the next screen.
15
16. At this point, double click on ‘METHANOL’ to add it to the list and click on the ‘Close’ button to close the
window. We can then add ethanol to the list in a similar manner.
16
17. Clicking on the ‘Next’ key takes us to the ‘Properties’ section. In a normal industrial simulation, this section
can be the most difficult to complete correctly. For this class, we will assume the problem statement contains
all the needed information. For the example problem, press the ‘Base method’ drop down arrow and select
‘NRTL’. The press the ‘Next’ key twice, then ‘OK’ on the window to go to the next step.
We are taken to the window for entering the feed stream information. Filling out this form is fairly
straightforward and will not be discussed further. Some things to note are that one can change the units on an
input such as temperature or pressure but that the input value will not change. For example, if we want to enter
25 Celsius as the stream temperature but Fahrenheit is the default unit, enter 25 in the number box and change
the unit box to C. If you change the unit box to another unit like Kelvin, the numerical value stays at 25. When
we press the ‘Next’ key, we are now taken to the first unit operation module. In this case it is the distillation
column which is being modeled by the RADFRAC module.
17
18. There are essentially three situations engineers may find themselves in when filling out the form for a
distillation column:
1. There is considerable prior knowledge of the system. In this case, a good starting point is to repeat
the previous model.
2. The column is new but similar to other columns. In this case, simple reasoning by analogy is
sufficient to specify the starting conditions.
3. The engineer has no prior knowledge of the system and is modeling a column that doesn’t exist.
This is the case we will address in this discussion
Situation 3 Cookbook
Stages, Condenser, Reboiler
Aspen has already presented you with some default conditions and suggestions for starting conditions. My
recommendation is to specify 20 stages as the number of stages. The condenser should be a total condenser
unless you know that some other choice is preferred. The most common next choice is a partial condenser
where the product stream is withdrawn as a vapor and the liquid stream is the reflux. Use the default choices
for reboiler, phases, and convergence unless you know of better choices. Note that even if the reboiler will
eventually not be a kettle, the design data for the reboiler can be derived from the kettle reboiler output.
18
19. Mass and Energy Balances
The most difficult initial specifications to set are the ones associated with the column mass balance and the
energy balance. The defaults suggested by Aspen are the distillate rate and the reflux ratio. These are excellent
choices provided the feed doesn’t change. My recommendation is to change the distillate specification to a
‘Distillate to Feed ratio’ specification. Now you can more easily base the initial specification on the feed
composition.
The initial guess of the reflux ratio should be such that the ratio of the reflux to the feed is one. A few lines of
simple math and hand calculations will give you the value of the reflux ratio. Determining the proper choice of
specification and setting the numerical value can be the most difficult specifications to make. We will come
back to this section when we discuss Column Design Specs.
Stream Specifications
When you push the ‘Next’ key, the screen for locating the streams is displayed. Note that the distillation and
tails streams are already specified. The only user entry needed on this form is the stage location of the feed
stream. My recommendation is the middle of the column unless you know it should be more to the top or
bottom of the column. An ‘eyeball’ McCabe-Thiele diagram is helpful in the initial selection but we will learn
of a method that more accurately determines the feed stage. We will come back to this form when we add
sidedraw streams to the column.
Column Pressure
The next screen is the column pressure. This is not a number to be set casually since there are many economic
consequences of your selection. The numbers that can be set in Aspen are the column top pressure and the
column pressure drop. One has to be concerned about both the minimum and maximum operating pressures.
We usually want the pressure to be as close to atmospheric pressure as possible. The reason is that the higher
the pressure of the column, the costlier the column’s shell. A column rated for a pressure of full vacuum to 50
psig is the nominal minimum cost unit. The cost penalty break points are 50 to 150 psig, 150 to 300 psig and
300 to 600 psig. Designs of over 600 psig should be considered special units that require extra engineering
expertise to design properly.
Another reason for staying as close to atmospheric pressure as possible is that the relative volatility between
adjacent boiling point compounds tends to be larger at lower pressures.
However, there are also temperature considerations. For example, we normally need at least a 10 to 15 C
difference between the cooling utility and the process condensation temperature in order to keep the condenser a
reasonable size. Thus the column that is removing low boiling compounds may often be at a pressure such that
the reflux temperature is 15 C higher than the cooling utility inlet temperature.
The other situation is the maximum allowable temperature for the higher boiling components to minimize
thermal degradation. Here one needs to be concerned about the column pressure drop in addition to column top
pressure. A good first guess in this case is 2 inches of water drop per theoretical stage.
Making a Run
At this point, the specifications needed to make a run are complete. But first –
SAVE YOUR WORK !!!
Running the simulation means telling the GUI is prepare an input file, then issue the commands to run the
simulation engine. If your simulation is going to crash, this is the most likely time. If it crashes, there is a
50/50 chance that all your work will be lost. Aspen does not use the file you created to save your input in any
calculations. When everything is completed successfully and you press the ‘Next’ key, a message box opens to
19
20. state that you can now make a run and asks for permission to proceed. Press cancel, save your work, then press
the ‘Next’ key and now answer ‘OK’ in the message box.
The form that now opens is the Control Panel. It shows you all the run time messages that are generated by the
simulation. The Control panel also allows you to do other things like stop a run before it reaches a normal
finish and reset the starting variables.
Examining Results
The ‘Control Panel’ prints any error messages plus the progress the simulation is making to a converged
solution. For example, with a distillation column, an iteration-by-iteration table is generated of the iteration
steps towards solution. Once the simulation is completed, the simulation engine passes the results to the GUI.
In addition, all the temporary files are deleted. This cleanup occurs if the simulation ends in a regular fashion,
regardless of whether the simulation converges. If the simulation crashes, then not only must the user restart
Aspen Plus, but there will also be all the temporary files to manually delete from the computer hard drive.
These files don’t cause problems for the future simulations but just take up space and make the directory messy.
Regardless of how the simulation finishes, a good place to begin examining results is the results of the ‘Stream
Results’.
20
21. The upper drop down box shows that ‘All’ information is to be displayed. This is a good choice since it means
that we don’t have to be switching between input and result screens. The other thing to note is the streams are
usually displayed in alphabetical order. This can be modified by renaming the column headings in the drop
down boxes above each column of stream results. From these results we can see that we have a feasible
solution but not we have a correct solution based on the problem statement. The product stream purity and
Methanol recovery is not large enough to meet the problem specifications.
Now we will turn to optimizing the solution including finding the best pressure, reflux ratio, distillate flow rate,
feed stage location, and total number of stages in the column.
Finding the Best Pressure
Pressure is usually the best control variable to control both the operating temperatures of a column and the
driving force for efficient flow of material through a separation system. In a typical situation, there is a
minimum and maximum acceptable temperature. Most of the time, these limits are set by the available heating
and cooling utility temperatures. A typical situation is to state these as steam pressure and cooling water
temperature. The process temperatures should be at least 10ºC colder/warmer than the heating/cooling supply
temperatures. A combination of vapor pressure charts, appropriate T-xy diagrams, and some scouting
simulation runs is usually sufficient to firm up the pressure settings.
Finding the optimum reflux ratio
The optimum reflux ratio is not a true global optimum in the sense that all aspects of the column have been
optimized. Rather, it is the optimum reflux ratio for the current column simulation model. It is usually tied to a
product stream purity but could also be tied to other results of the simulation such as the column temperature
profile, etc. The main idea is that the reflux ratio is being adjusted to keep a specific column result constant.
The ‘Design Spec’ – ‘Vary’ options in the column input forms are used. This discussion also assumes that the
column is able to meet its performance objectives. First, define a specification that needs to be met. A common
objective is the purity of an output stream such as the distillate. It is often best to think in terms of impurity
rather than purity. The reason is the default convergence limit in Aspen is 10-4
of the specification requirement.
By converging on an impurity specification, one can pick up a one to two order of magnitude improvement in
the convergence tolerance of the column. This can be important if the column is later used in a large flowsheet
or if the column is inside of a recycle loop.
Say we want the distillate to have a purity of 99.5% (molar) of the light key. This means the impurity level is
0.5% or 0.005 fraction of all the other species in the feed stream. Select ‘Design Spec’ for the column. Accept
the Aspen name for the spec. At the top drop down select ‘Molar Purity’, then put in the value of .005. Press
the ‘Next’ key and then select the components to be included in the specification. Finally select the stream to
which this specification is to be applied.
Next we need to specify what will be varied to satisfy the specification. The number of varied items must
always be less than or equal to the number of specifications. For this case, we want to specify the reflux ratio.
Select the reflux ratio from the drop-down list of vary candidates. One inputs that have been specified for the
column can be used. If all other items in the column have been specified correctly, then Aspen will run and
converge on an answer. To see the result either select the ‘Vary’ item and select ‘Results’ or select the ‘Results
Summary’. On the screen for the ‘Top of Column/Condenser’, the reflux ratio is given. This ratio is the
minimum ratio needed to meet the Design Specification.
One last point before we move on to finding the feed stage location is that sometimes once the reflux ratio has
been found, the desired recovery specification is not met. In this case, define another Design-Spec. Use the
21
22. other column specification as the second Vary variable. This may be the D:F ratio or the distillate rate. This
second step is only necessary if all the column performance criteria cannot be met by just adjusting the reflux
ratio.
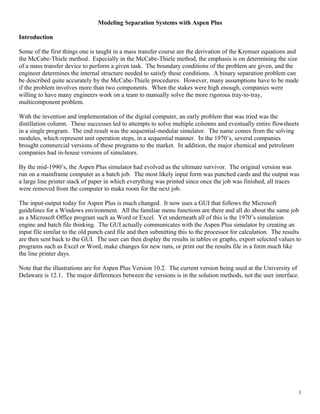
Determining the best feed stage
There are two methods of doing this task. For each case, it is necessary to be sure that that the column
performance criteria are being met. The two methods are the constant reflux method and the constant
performance method. The major difference between the methods is that with the constant reflux method, the
reflux is held constant and the feed stage is varied. The feed stage that gives the best performance is selected as
the feed stage. In the constant performance method, the Design-Specs are used to hold the column performance
constant. The reflux (and perhaps some other variables such as the D:F ratio) is varied to maintain the constant
performance. The feed stage with the minimum reflux ratio or the lowest energy requirement is selected as the
best feed location. An example of the results from a constant performance study is shown below. Stage 15 is
the best choice for the feed.
22
Sensitivity S-1 Summary
VARY 1 COLMN FEED FEEDS STAGE
BTU/HR
10 11 12 13 14 15 16 17 18
3.75e74e74.25e74.5e74.75e7
QREB
23. Estimating the Correct Number of Theoretical Stages
The last thing that needs to be done is to estimate the number theoretical stages. The method is based on the
discussion by Jobson, et.al., on the affect that the vapor load has on the optimum design of equilibrium stages.
The basic proposal is that the total annual cost of constructing and operating the column is a strong function of
the product of the number of stages multiplied by the reflux ratio. The method is to perform a series of case
studies where the total number of stages is varied but the ratio of the feed stage to the total number of stages is
kept constant. The reflux ratio is allowed to vary as discussed above in the section on maintaining constant
column performance. For each run, the number of stages and the reflux ratio is recorded and the product of the
two values is calculated. The number of stages that causes the product to be a minimum is the optimum number
of stages. Usually, about 5 case studies are sufficient to find the optimum number.
23