2. Important!
Be sure to connect the communication cable to your computer
before opening the Aqua4Plus Lite software.
(Click to continue)
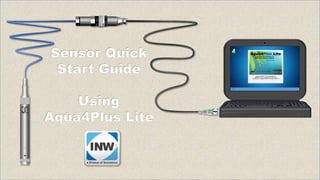
Sensor Quick
Start Guide
Using
Aqua4Plus Lite
3. 1
2
3
4
5
6
7
8
Table of Contents
(Click on a number to jump to that section)
Attach the Sensor Cable to
the Communication Cable
Attach the Communication
Cable to PC USB Port
Open Aqua4Plus Software
Display Sensors
Quick Readings
Start Recording
Retrieve & Display
Exporting Data
4. 1
Attach the Sensor Cable to the
Communication Cable
Tighten the metal rings, being careful not to
loosen the black plastic rings.
Connecting
your sensor
to a USB
port on a PC
1
Replay
Section
Table of
Contents
5. Attach the Sensor Cable to the
Communication Cable
Tighten the metal rings, being careful not to
loosen the black plastic rings.
Connecting
your sensor
to a USB
port on a PC
1
Replay
Section
Table of
Contents
6. 1
Attach the Sensor Cable to the
Communication Cable
Tighten the metal rings, being careful not to
loosen the black plastic rings.
(Click to continue)
Connecting
your sensor
to a USB
port on a PC
Replay
Section
Table of
Contents
7. Connecting
to a USB
port on a PC
22
Attach the Communication
Cable to PC USB Port
Replay
Section
Table of
Contents
8. Connecting
your sensor
to a USB
port on a PC
2
Attach the Communication
Cable to PC USB Port
(Click to continue)
Replay
Section
Table of
Contents
13. Connecting
your sensor
to a USB
port on a PC
3
Open Aqua4Plus Software
Cable installation complete.
(Click to continue)
Replay
Section
Table of
Contents
16. Using Aqua4Plus Lite
Display Sensors
Click on Scan.
The program looks for any connected
sensors and displays a list in the
sensor panel.
4Replay
Section
Table of
Contents
17. Using Aqua4Plus Lite
(Click to continue)
Display Sensors
Click on Scan.
The program looks for any connected
sensors and displays a list in the
sensor panel.
Various information about the sensor
displays to the right, such as the
number of data files on the sensor
and the battery level.
Note that this is a snapshot of the
status of the sensor at a point in time.
It does not update automatically. To
update the status, click the Refresh
Sensor Button.
4Replay
Section
Table of
Contents
19. Using Aqua4Plus Lite
Quick Readings
Click on the Sensor.
Click on Start.
5Replay
Section
Table of
Contents
20. Using Aqua4Plus Lite
Quick Readings
Click on the Sensor.
Click on Start.
5Replay
Section
Table of
Contents
21. Using Aqua4Plus Lite
Quick Readings
Click on the Sensor.
Click on Start.
Readings will display every second
for 60 seconds.
These readings are NOT being
recorded but give a quick method to
view the current measurement.
5Replay
Section
Table of
Contents
22. Using Aqua4Plus Lite
Quick Readings
Click on the Sensor.
Click on Start.
Readings will display every second
for 60 seconds.
These readings are NOT being
recorded but give a quick method to
view the current measurement.
5Replay
Section
Table of
Contents
23. Using Aqua4Plus Lite
Quick Readings
Click on the Sensor.
Click on Start.
Readings will display every second
for 60 seconds.
These readings are NOT being
recorded but give a quick method to
view the current measurement.
5Replay
Section
Table of
Contents
24. Using Aqua4Plus Lite
Quick Readings
Click on the Sensor.
Click on Start.
Readings will display every second
for 60 seconds.
These readings are NOT being
recorded but give a quick method to
view the current measurement.
5Replay
Section
Table of
Contents
25. Using Aqua4Plus Lite
Quick Readings
Click on the Sensor.
Click on Start.
Readings will display every second
for 60 seconds.
These readings are NOT being
recorded but give a quick method to
view the current measurement.
5Replay
Section
Table of
Contents
26. Using Aqua4Plus Lite
(Click to continue)
Quick Readings
Click on the Sensor.
Click on Start.
Readings will display every second
for 60 seconds.
These readings are NOT being
recorded but give a quick method to
view the current measurement.
To stop the readings, click on Stop.
5Replay
Section
Table of
Contents
27. Using Aqua4Plus Lite
Start Recording
Define a logging schedule
Click Logging.
A Logging Schedule window opens.
6Replay
Section
Table of
Contents
28. Using Aqua4Plus Lite
Start Recording
Define a logging schedule
Click Logging.
A Logging Schedule window opens.
6Replay
Section
Table of
Contents
29. Using Aqua4Plus Lite
Start Recording
Define a logging schedule
Click Logging.
A Logging Schedule window opens.
6Replay
Section
Table of
Contents
30. Using Aqua4Plus Lite
Data
Start Recording
Define a logging schedule
Click Logging.
A Logging Schedule window opens.
1. Enter a name for your data file.
6Replay
Section
Table of
Contents
31. Using Aqua4Plus Lite
Data
Start Recording
Define a logging schedule
Click Logging.
A Logging Schedule window opens.
1. Enter a name for your data file.
2. Enter a logging interval. This is
how often a measurement will be
taken and recorded.
6Replay
Section
Table of
Contents
32. Using Aqua4Plus Lite
Data
Start Recording
Define a logging schedule
Click Logging.
A Logging Schedule window opens.
1. Enter a name for your data file.
2. Enter a logging interval. This is
how often a measurement will be
taken and recorded.
6Replay
Section
Table of
Contents
33. Using Aqua4Plus Lite
Data
Start Recording
Define a logging schedule
Click Logging.
A Logging Schedule window opens.
1. Enter a name for your data file.
2. Enter a logging interval. This is
how often a measurement will be
taken and recorded.
6Replay
Section
Table of
Contents
34. Using Aqua4Plus Lite
Data
Start Recording
Define a logging schedule
Click Logging.
A Logging Schedule window opens.
1. Enter a name for your data file.
2. Enter a logging interval. This is
how often a measurement will be
taken and recorded.
6Replay
Section
Table of
Contents
35. Using Aqua4Plus Lite
Data
Start Recording
Define a logging schedule
Click Logging.
A Logging Schedule window opens.
1. Enter a name for your data file.
2. Enter a logging interval. This is
how often a measurement will be
taken and recorded.
3. Enter the number of records to
be recorded.
6Replay
Section
Table of
Contents
36. Using Aqua4Plus Lite
Data
Start Recording
Define a logging schedule
Click Logging.
A Logging Schedule window opens.
1. Enter a name for your data file.
2. Enter a logging interval. This is
how often a measurement will be
taken and recorded.
3. Enter the number of records to
be recorded.
(Click to continue)
6Replay
Section
Table of
Contents
37. Using Aqua4Plus Lite
Data
Start Recording
Define a logging schedule
If this is all that you want to record,
then you can click the Start button to
begin recording.
However, if you want, you can define
another logging phase to begin as
soon as the first one has finished.
(Click to continue)
6Replay
Section
Table of
Contents
38. Using Aqua4Plus Lite
Data
Start Recording
Define a logging schedule
To create another phase:
1. Click on the next phase number.
2. Enter the desired logging
interval.
3. Enter the number of records
6Replay
Section
Table of
Contents
39. Using Aqua4Plus Lite
Data
Start Recording
Send the Schedule to the Sensor
Once you have your schedule
defined, click Start to send the
schedule to the sensor.
6Replay
Section
Table of
Contents
40. Using Aqua4Plus Lite
Data
Start Recording
Send the Schedule to the Sensor
When your recording starts, the file
name will display in the sensor
window.
6Replay
Section
Table of
Contents
41. Using Aqua4Plus Lite
Data
Start Recording
Send the Schedule to the Sensor
When your recording starts, the file
name will display in the sensor
window.
A green light in front of the file name
indicates that the sensor is actively
recording per that schedule.
6Replay
Section
Table of
Contents
42. Using Aqua4Plus Lite
(Click to continue)
Data
Start Recording
Send the Schedule to the Sensor
When your recording starts, the file
name will display in the sensor
window.
A green light in front of the file name
indicates that the sensor is actively
recording per that schedule.
A completed data file will have a blue
checkmark in front of it.
6Replay
Section
Table of
Contents
43. Using Aqua4Plus Lite
Data
Retrieve & Display
After your data has been collected,
you will want to retrieve the data to
save onto your computer.
1. Click on the data file to retrieve.
7Replay
Section
Table of
Contents
44. Using Aqua4Plus Lite
Data
Retrieve & Display
After your data has been collected,
you will want to retrieve the data to
save onto your computer.
1. Click on the data file to retrieve.
2. Click on the retrieve button.
7Replay
Section
Table of
Contents
45. Using Aqua4Plus Lite
Data
Retrieve & Display
After your data has been collected,
you will want to retrieve the data to
save onto your computer.
1. Click on the data file to retrieve.
2. Click on the retrieve button.
3. Navigate to where you want to
save your file.
4. Give it a new name, if desired.
5. Click on Save.
7Replay
Section
Table of
Contents
46. Using Aqua4Plus Lite
Data
Retrieve & Display
After your data has been collected,
you will want to retrieve the data to
save onto your computer.
1. Click on the data file to retrieve.
2. Click on the retrieve button.
3. Navigate to where you want to
save your file.
4. Give it a new name, if desired.
5. Click on Save.
6. Click on Start.
1/500100/500210/500420/500500/500
7Replay
Section
Table of
Contents
47. Using Aqua4Plus Lite
Data
(Click to continue)
Retrieve & Display
After your data has been collected,
you will want to retrieve the data to
save onto your computer.
1. Click on the data file to retrieve.
2. Click on the retrieve button.
3. Navigate to where you want to
save your file.
4. Give it a new name, if desired.
5. Click on Save.
6. Click on Start.
7. After the data has been
retrieved, click View
7Replay
Section
Table of
Contents
48. Using Aqua4Plus Lite
Data
Retrieve & Display
Data is displayed in a table format.
(Click to continue)
Across the top is a header containing
such information as the sensor type,
sensor name, number of records, etc.
The top area of the table shows
various statistical information, such
as minimum and maximum values.
The rest of the table displays the
actual measurements – one column
for each channel. Each row displays
a record number, time stamp, and the
data.
7Replay
Section
Table of
Contents
50. Using Aqua4Plus Lite
Data
Retrieve & Display
To display data as a graph, click the
graph button.
By default the graph is shown at full
scale for the sensor.
To view just the data, click the down
arrow on the menu bar and select
Zoom to data.
7Replay
Section
Table of
Contents
51. Using Aqua4Plus Lite
Data
Zoom to Data
Retrieve & Display
To display data as a graph, click the
graph button.
By default the graph is shown at full
scale for the sensor.
To view just the data, click the down
arrow on the menu bar and select
Zoom to data.
7Replay
Section
Table of
Contents
52. Using Aqua4Plus Lite
Data
(Click to continue)
Retrieve & Display
To display data as a graph, click the
graph button.
By default the graph is shown at full
scale for the sensor.
To view just the data, click the down
arrow on the menu bar and select
Zoom to data.
7Replay
Section
Table of
Contents
53. Using Aqua4Plus Lite
Data
Retrieve & Display
To zoom in to a particular part of the
data, use the magnifying glass.
7Replay
Section
Table of
Contents
54. Using Aqua4Plus Lite
Data
(Click to continue)
Retrieve & Display
To zoom in to a particular part of the
data, use the magnifying glass.
7Replay
Section
Table of
Contents
55. Using Aqua4Plus Lite
Data
Retrieve & Display
To zoom in to a particular part of the
data, use the magnifying glass.
7Replay
Section
Table of
Contents
56. Using Aqua4Plus Lite
Data
Retrieve & Display
To zoom in to a particular part of the
data, use the magnifying glass.
7Replay
Section
Table of
Contents
57. Using Aqua4Plus Lite
Data
Retrieve & Display
To zoom in to a particular part of the
data, use the magnifying glass.
7Replay
Section
Table of
Contents
58. Using Aqua4Plus Lite
Data
Retrieve & Display
To zoom in to a particular part of the
data, use the magnifying glass.
7Replay
Section
Table of
Contents
59. Using Aqua4Plus Lite
Data
Retrieve & Display
To zoom in to a particular part of the
data, use the magnifying glass.
7Replay
Section
Table of
Contents
60. Using Aqua4Plus Lite
Data
Retrieve & Display
To zoom in to a particular part of the
data, use the magnifying glass.
7Replay
Section
Table of
Contents
61. Using Aqua4Plus Lite
Data
(Click to continue)
Retrieve & Display
To zoom in to a particular part of the
data, use the magnifying glass.
7Replay
Section
Table of
Contents
62. Using Aqua4Plus Lite
Data
Retrieve & Display
For more options, click the Display
Setup tool button.
(Click to continue)
Refer to your software manual for
details on using these advanced
options.
7Replay
Section
Table of
Contents
63. Using Aqua4Plus Lite
Data
Exporting Data
Often you will want to view your data
in Excel or another spreadsheet or
modeling program..
To export the data, simply click the
Export button.
8Replay
Section
Table of
Contents
64. Using Aqua4Plus Lite
Data
Exporting Data
Often you will want to view your data
in Excel or another spreadsheet or
modeling program.
To export the data, simply click the
Export button.
Select a name for your file and click
Save.
8Replay
Section
Table of
Contents
65. Using Aqua4Plus Lite
Data
Exporting Data
Often you will want to view your data
in Excel or another spreadsheet or
modeling program.
To export the data, simply click the
Export button.
Select a name for your file and click
Save.
If you want to open the file in Excel,
click Yes when asked. (Note: You
must have Excel installed on your
computer to view it in Excel.)
8Replay
Section
Table of
Contents
(Click to continue)
66. Using Aqua4Plus Lite
Data
Exporting Data
(Click to continue)
The first several rows contain header
and statistical data.
The remaining rows contain the
actual measurements with date/time
stamp and values for each channel.
Data can be exported in either .csv
(comma separated value) or .xls
(Excel) format.
8Replay
Section
Table of
Contents