2011 Are There Merits in a Market Capitalisation Weighted Equity and Fixed Income Index ?
•
0 likes•253 views

Are There Merits in a Market Capitalisation Weighted Equity and Fixed Income Index

Recommended
More Related Content
Recently uploaded
Recently uploaded (20)
Featured
Featured (20)
2011 Are There Merits in a Market Capitalisation Weighted Equity and Fixed Income Index ?
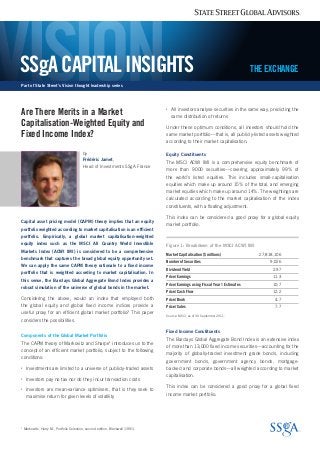
- 1. Part of State Street’s Vision thought leadership series SSgA CAPITALINSIGHTS THE EXCHANGE by Frédéric Jamet, Head of Investments SSgA France Are There Merits in a Market Capitalisation-Weighted Equity and Fixed Income Index? Capital asset pricing model (CAPM) theory implies that an equity portfolio weighted according to market capitalisation is an efficient portfolio. Empirically, a global market capitalisation-weighted equity index such as the MSCI All Country World Investible Markets Index (ACWI IMI) is considered to be a comprehensive benchmark that captures the broad global equity opportunity set. We can apply the same CAPM theory rationale to a fixed income portfolio that is weighted according to market capitalisation. In this sense, the Barclays Global Aggregate Bond Index provides a robust simulation of the universe of global bonds in the market. Considering the above, would an index that employed both the global equity and global fixed income indices provide a useful proxy for an efficient global market portfolio? This paper considers the possibilities. Components of the Global Market Portfolio The CAPM theory of Markovitz and Sharpe1 introduces us to the concept of an efficient market portfolio, subject to the following conditions: • Investments are limited to a universe of publicly-traded assets • Investors pay no tax nor do they incur transaction costs • Investors are mean-variance optimisers, that is they seek to maximise return for given levels of volatility • All investors analyse securities in the same way, predicting the same distribution of returns Under these optimum conditions, all investors should hold the same market portfolio—that is, all publicly-listed assets weighted according to their market capitalisation. Equity Constituents The MSCI ACWI IMI is a comprehensive equity benchmark of more than 9000 securities—covering approximately 99% of the world’s listed equities. This includes small-capitalisation equities which make up around 15% of the total, and emerging market equities which make up around 14%. The weightings are calculated according to the market capitalisation of the index constituents, with a floating adjustment. This index can be considered a good proxy for a global equity market portfolio. Fixed Income Constituents The Barclays Global Aggregate Bond Index is an extensive index of more than 13,000 fixed income securities—accounting for the majority of globally-traded investment grade bonds, including government bonds, government agency bonds, mortgage- backed and corporate bonds—all weighted according to market capitalisation. This index can be considered a good proxy for a global fixed income market portfolio. 1 Markowitz, Harry M., Portfolio Selection, second edition, Blackwell (1991). Figure 1: Breakdown of the MSCI ACWI IMI Market Capitalisation ($ millions) 27,818,106 Number of Securities 9,026 Dividend Yield 2.97 Price/Earnings 11.3 Price/Earnings using Fiscal Year 1 Estimates 10.7 Price/Cash Flow 12.2 Price/Book 4.7 Price/Sales 7.7 Source: MSCI, as of 30 September 2011.
- 2. SSSSSSggAA CACAPIPITATALL ININSISIGHGHTSSTS ||| THE EXCHANGE 2 Combining Both – The Global Market Portfolio A global market portfolio could, therefore, be created from a merger of the MSCI ACWI IMI and Barclays Global Aggregate Bond indices. The weighting methodology would be determined by the market capitalisation of the equity and fixed income components in both markets, and would evolve according to changes in market capitalisation. The ratio of each would be driven not only by performance in each asset class, but also by the amount of equity and fixed income issued in the markets. Since the ratio would be dynamic, the global market portfolio is not quite a pure buy-and-hold portfolio. The advantages of such a global market portfolio are comparable to the advantages of a global equity or fixed income market portfolio: • It is an optimal portfolio in the context of Markowitz and Sharpe. The portfolio can be considered to be a synthesis of the views and constraints of global equity and bond investors • It is diversified and therefore low risk • It is liquid with low costs, and turnover is mainly limited to accommodating new bond and equity issuance, and coupons and dividends reinvestment Conversely, it is also clear that such a portfolio contains some inherent drawbacks: • The sheer size of the portfolio means that it would not be easy to practically implement • According to the CAPM, the risk-free asset for such a portfolio is a complex mix of international currencies • It is not easy to define the average investor who would seek this exact asset allocation between equity and fixed income. It is important to consider that the market value of the MSCI ACWI IMI index and the Barclays Global Aggregate Bond index is driven not only by performance but also by new bond and share issuance, dividends and coupons. At the end of each month the investor would need to fund new additions by buying/selling bonds/equities. Many investors use either a fixed weight for allocating between equity and fixed income or a dynamic approach in accordance with liability-driven objectives. A typical weighting scheme for a US portfolio is around 60% equity and 40% fixed income; for a European portfolio it is around 30% equity and 70% fixed income.2 These allocations evolve according to market performance and the portfolio weights are readjusted on a regular basis. Performance and breakdowns The upward direction of the market value of the Barclays Global Aggregate Index since 2007 is readily apparent. Figure 3 demonstrates a continuous and positive expansion from $17 billion to $40 billion between January 2003 and September 2011—driven by growth in bond issuance and falling interest rates. On the equity side of the equation, the evolution of market value of the ACWI IMI has been much more volatile, including a substantial drop between 2008–2009. It is worth noting that the rebound in equities in March 2009 has increased the equity percentage by only a moderate figure—from 38% in February 2009 to 46% in December 2010—because of the vigorous growth of the Barclays Global Aggregate Index during the same period. As a result of these movements, between 2003 and 2008 the major proportion of the global market’s combined equity and fixed income capitalisation was occupied by equities—with equities accounting for between 50–60%. From 2009, following the fall in value of the ACWI IMI, equities decline in proportion, and fixed income occupies a greater proportion of the total market capitalisation. Interestingly, the average equity weight over the period is 51%, with a maximum at 61% and a minimum at 38%, reached in February 2009. Figure 3: Global Market Portfolio: Breakdown Equity—Fixed Income — MSCI ACWI IMI — Barcap Global Aggregate — Global Market Portfolio Trillions % 10 20 0 30 40 50 15 30 0 45 60 75 January 2003 March 2005 May 2007 July 2009 September 2011 Source: MSCI, as of 30 September 2011, Barclays Capital, as of 30 September 2011. Figure 2: Breakdown of the Barclays Global Aggregate Bond Index Market Capitalisation ($ Millions) 40,343,574 Number of Securities 13,583 Yield (%) 2.41 Coupon (%) 3.63 Duration (years) 5.9 Maturity (years) 7.67 Source: Barclays Capital, as of 30 September 2011. 2 Barclays Capital, as of 30 September 2011.
- 3. SSSSSSggAA CACAPIPITATALL ININSISIGHGHTSSTS ||| THE EXCHANGE A proxy for the global market portfolio can be computed using the capitalisation weights and performances of the ACWI IMI and Global Aggregate Bond indices (a market capitalisation-weighted portfolio). This can then be compared against a global market portfolio made out of 50% ACWI IMI and 50% in Global Aggregate Bonds (‘Global 50/50’), readjusted monthly. The performance of these portfolios is demonstrated in Figure 4. Perhaps counter-intuitively, the data demonstrates that the global market capitalisation-weighted portfolio delivers markedly different results to the Global 50/50 portfolio, with both stronger performance and higher volatility. One explanation could be that the portfolio was overweight in equities when equities were performing best and underweight in equities when they were not dominant, according to the market capitalisation-weight principle. It also has stronger performance than an equity or bond portfolio alone—with significantly lower volatility than the ACWI IMI. Conclusion A global market capitalisation-weighted portfolio can be created by using the capitalisation data of standard global equity and fixed income indexes. Although this concept has not been widely- used historically, this kind of index offers some advantages. It is a passive approach, optimal according to Markowitz’s portfolio theory, with low turnover, high diversification, and capable of continuously adapting to the evolution of the global equity and fixed income markets. Empirically, the data indicates that the global market portfolio has offered strong performance over the past 8 years when compared to individual equity or fixed income indices, or to a portfolio of 50% equities and 50% fixed income. Since the global market cap-weighted portfolio is based on the theoretical parameters of the Capital Asset Pricing Model, it does not necessarily match the objectives of any specific investor. However, given performance data that shows stronger relative performance over the past 8 years when compared to individual equity or fixed income indices, or even when compared to a blend of both, it may well warrant further consideration by investors. This material is for your private information. The views expressed are the views of Frédéric Jamet through the period ended 27 November 2011 and are subject to change based on market and other conditions. The information we provide does not constitute investment advice and it should not be relied on as such. It should not be considered a solicitation to buy or an offer to sell a security. It does not take into account any investor’s particular investment objectives, strategies, tax status or investment horizon. We encourage you to consult your tax or financial advisor. All material has been obtained from sources believed to be reliable, but its accuracy is not guaranteed. There is no representation or warranty as to the current accuracy of, nor liability for, decisions based on such information. This document contains certain statements that may be deemed forward-looking statements. These statements are based on certain assumptions and analyses made by SSgA in light of its experience and perception of historical trends, current conditions, expected future developments and other factors it believes appropriate in the circumstances. Past performance is no guarantee of future results. Source: Barclays Capital POINT/Global Family of Indices. Barclays Capital Inc. Used with permission. MSCI Indices are trademarks of MSCI Inc. Any financial products referred to herein are not sponsored, endorsed, or promoted by MSCI, and MSCI bears no liability with respect to any such financial products or any index on which such financial products are based. The fund documents contain a more detailed description of the limited relationship MSCI has with SSgA and any related financial products. Source: MSCI: Neither MSCI nor any other party involved in or related to compiling, computing or creating the MSCI data makes any express or implied warranties or representations with respect to such data (or the results to be obtained by the use thereof), and all such parties hereby expressly disclaim all warranties of originality, accuracy, completeness, merchantability or fitness for a particular purpose with respect to any of such data. Without limiting any of the foregoing, in no event shall MSCI, any of its affiliates or any third party involved in or related to compiling, computing or creating the data have any liability for any direct, indirect, special, punitive, consequential or any other damages (including lost profits) even if notified of the possibility of such damages. No further distribution or dissemination of the MSCI data is permitted without MSCI’s express written consent. Risk associated with equity investing include stock values which may fluctuate in response to the activities of individual companies and general market and economic conditions. Although bonds generally present less short-term risk and volatility risk than stocks, bonds contain interest rate risks; the risk of issuer default; issuer credit risk; liquidity risk; and inflation risk. ©2011 State Street Corporation ID429. EUMKT-1651. 11.11. Exp. Date 11/30/2012 3 0 100 200 300 January 2003 March 2005 May 2007 July 2009 September 2011 Trillions — Global Market Portfolio — MSCI ACWI IMI — Global 50% 50% — Barcap Global Aggregate Figure 4: Global Market Portfolio: Performance Performance (Annualised) (%) Volatility (%) Sharpe Ratio Global Market Cap Weighted 7.8 13.5 0.58 ACWI IMI 7.6 17.3 0.44 Global 60/40 7.4 11.7 0.63 Global 50/50 7.3 10.4 0.70 Barcap Global Aggregate 6.2 6.4 0.98 Source: MSCI, as of 30 September 2011, Barclays Capital, as of 30 September 2011. Past performance is not a guarantee of future results.