SlideShare a Scribd company logo
1 of 1
Download to read offline
Survival of E. coli O157:H7 in irrigation water under varying
physico-chemical conditions
F. Malick, A. O. Olaniran, and B. Pillay
Discipline of Microbiology, School of Biochemistry, Genetics and Microbiology, Faculty of Science and Agriculture, University of KwaZulu-Natal (Westville), South Africa
204011270@ukzn.ac.za
Figure 4: SEM images diplaying both culturable and resuscitated E. coli cells in irrigation water (A = 5% NaCl and B = control)
VBNC cells are highlighted in red and culturable cells in blue.
Figure 5: SEM image displaying moderate biofilm formation (A and B) and no biofilm formation (c) of
E. coli cells in irrigation water at (A) 5% NaCl; (B) pH 4, and (C) Control).
(a) (b) c)
(d) (e)
Figure 1: Survival of E. coli O157:H7 in irrigation water at varying concentrations of (a) NaCl, (b) pH, (c) iron , (d) nitrate, and (e) 5% NaCl at pH 4 and 10 mg/l
iron
E. coli exhibited the highest survival at 1% NaCl.
An increase in NaCl concentration to 3% gradually decreased the bacterial survival from day 1
resulting in a final population of 8.9 × 101
cfu/ml as shown in figure 1a.
5% NaCl reduced E. coli counts to 1 × 10²
cfu/ml at day 7 from an initial population of 2.9 × 10⁴
cfu/ml, thereafter the bacterium was not detected.
pH 4 was found to decrease E. coli survival from day 0 resulting in 100% reduction in population by
day 8. However, E. coli survived moderately well at pH 9 displaying a 1.89 log decrease at day 10.
In the control and at pH 7, a similar trend was observed whereby the population gradually increased
over time (Figure 1b).
Addition of 5% NaCl at pH 4 was found to enhance the survival of E. coli in the irrigation water
throughout the study period (Figure 1e). This is in contrast to the parameters evaluated individually
which resulted in a rapid decrease with time.
Table 1: Time course protein production (µg/ml) of E. coli O157:H7 under varying physico-chemical conditions
Irrigation water was collected from a farm in Richmond (KwaZulu-Natal)
and autoclaved.
NaCl, Nitrate and Iron were added at desired concentrations. pH was ad-
justed using HCl (10%) and NaOH (1M).
Combined parameters tested were 5% NaCl at pH 4 and 10 mg/l iron at pH 9
E. coli was standardized to an optical density of 0.5 at 630 nm (108
cfu/ml)
and added to the irrigation water to a final concentration of 2 ×10⁵
cfu/ml
Flasks were incubated at 30 °C.
Serial dilutions and spread plates were performed daily for 10 days.
Positive controls = irrigation water + E. coli
MATERIALS AND METHODS
RESULTS
Irrigation use has increased substantially by approximately 300% in the last 3–4
decades, primarily due to the increased demand for food (Kirby et al., 2003 ).
Concerns about the persistence of E. coli O157:H7 in irrigation waters and its trans-
mission into fresh produce warrants investigation into the possible survival of this or-
ganism, which continues to be an important agent of food- and water-borne illnesses
in humans, globally (Islam et al., 2005).
Majority of studies have indicated that contamination of crops most likely occurs
through direct contact between crops and contaminated water.
E. coli survived at low concentrations of NaCl (1%), whereas high concentrations per-
mitted growth only for a few days.
Several authors have reported that E. coli O157:H7 was less tolerant at 5% NaCl and a
further increase in the NaCl concentration resulted in cellular damage (Manas et al.
(2001 ).
DISCUSSION AND CONCLUSION
Increased in length E. coli cells ranging from 4 to 12 µm observed after
resuscitation is indicative of the VBNC state.
Problems associated with water contamination have the Capability to
disrupt life on earth to a great extent, therefore it is of importance to moni-
tor valuable water resources regularly .
Fresh produce irrigated with water contaminated with bacterial pathogens
could pose a threat to public health, thus emphasizing the need for the
implementation of appropriate treatment of irrigation water, prior to use.
The findings of this study suggest that fresh produce irrigated by water
contaminated with bacterial pathogens pose a public health risk. Further-
more, the results of this study emphasize the need for the implementation
of improved management strategies of such valuable water resources.
INTRODUCTION
Water is an essential component that is required in all social and
economic activities (Dungumaro, 2007).
Water of high quality is a scarce commodity in many areas as food
production and processing require large amounts of water of varying
quality.
More than one-third of the earth’s accessible renewable fresh water is
used for agricultural, industrial, and domestic purposes, and most of
these activities lead to water contamination with numerous synthetic
compounds (Liu et al., 2005).
Chemical pollution of natural waters has become a major public
health concern in almost all parts of the world (Schwarzenbach et al.,
2006), especially in those countries where industrial development has
started and industrial effluent enters domestic wastewater and natural
streams (Qadir et al., 2008).
i = 5% NaCl at pH 4 ii = 10 mg/l iron at pH 9
Table 2: Time course lipid production ((µg/ml) of E. coli O157:H7 under varying physico-chemical conditions
i = 5% NaCl at pH 4 ii = 10 mg/l iron at pH 9
A rapid increase in E. coli population was observed under all iron concentrations from
day 0.
At 10 mg/l iron concentration, E. coli displayed a steady increase resulting in a
population of 2 × 10⁵
cfu/ml at day 10.
Increase in iron concentrations to 20 and 30 mg/l resulted in 0.72 log and 0.86 log
increases in E. coli population, respectively.
10 mg/l iron at pH 4 enhanced survival of E. coli resulting in a population of 3.7 × 10⁵
cfu/ml, which is in contrast to the survival pattern obtained when the parameters were
evaluated individually.
E. coli survived favourably when supplemented with the lowest concentration of nitrate
(10 mg/l) resulting in a final population of 1.94 × 10⁴
cfu/ml.
NaCl stress resulted in a progressive increase in the protein content and a
decrease in the lipid content of E. coli .
At 1% NaCl, E. coli displayed 11.78-fold increase in the protein
concentration at day 10 compared to 14.89-fold increase at 5% NaCl,
with a correspondingly decrease in lipid content.
An increase in the protein concentration was observed at pH 4 resulting
in a 13.22 µg/ml increase at day 10.
Protein concentration at pH 7 was comparable to that of the control with
a 0.72 μg/ml difference
between the latter.
An increase in the iron concentration lead to an increase in the protein
concentration of E. coli, and a decrease in the lipid concentration.
Figure 3: E. coli counts before and after resuscitation of the irrigation
water supplemented with different physico-chemical factors (i = Con-
trol, ii = 1% NaCl, iii = 3% NaCl, iv = 5% NaCl, v = pH 4, vi = pH 7,
vii = pH 9, viii = 10 mg/l Fe, ix = 20 mg/l Fe, x = 30 mg/l Fe, xi = 10
mg/l NO3, xii = 20 mg/l NO3, xiii = 30 mg/l NO3, xiv = 5% NaCl; pH 4,
xv = 10 mg/l Fe; pH 9).
Parameters Level of adherence
NaCl (1%) Weak
NaCl (3% ) NA
NaCl (5%) Moderate
pH 4 Moderate
pH 7 NA
pH 9 NA
Iron (10 mg/l) Weak
Iron (20 mg/l) NA
Iron (30 mg/l) NA
Nitrate (10 mg/l) NA
Nitrate (20 mg/l) NA
Nitrate (30 mg/l) NA
5% NaCl at pH 4 NA
10 mg/l Fe at pH 9 Weak
Control NA
Table 3: Adherence ability of E. coli A B C
E. coli was capable of surviving in the irrigation water in the VBNC state and in biofilms.
Although bacterial growth was inhibited at pH 4 and at 5% NaCl, E. coli was present in large
numbers in resuscitated samples, with a cell length of 10.33µm observed at 5% NaCl (Figure
4a ).
E. coli was present in irrigation water of pH 4 at a population of 1 × 10⁴
cfu/ml after resuscita-
tion.
Iron concentration of 10 mg/l resulted in an increase in microbial counts when resuscitated with
cell lengths of 12.67 µm which was 3.9 times longer than cells obtained from the control (Figure
4b).
REFERENCES
Water Research Commission and National Research
Foundation for project funding
0
1
2
3
4
5
6
7
8
i ii iii iv v vi vii viii ix x xi xii xiii xiv xv
E.colicount
(Logcfu/ml)
Parameters
Before resuscitation Afterresuscitation
Sampling
time (d)
NaCl (%) pH Iron (mg/l) Nitrate (mg/l) Combined Control
1 3 5 4 7 9 10 20 30 10 20 30 i ii
0 22.27 22.27 22.27 22.27 22.27 22.27 22.27 22.27 22.27 22.27 22.27 22.27 22.27 22.27 22.27
1 22.77 24.94 25.27 23.05 22.66 22.66 25.11 26.05 28.77 25.33 23.49 22.66 22.99 25.05 22.99
2 23.27 26.94 26.99 24.05 23.44 23.33 26.83 27.77 32.22 26.55 24.16 23.16 23.94 26.27 23.88
3 25.44 28.33 28.22 25.77 24.38 24.1 28.55 30.05 37.66 27.66 25.49 23.55 25.55 27.94 25.05
4 27.16 29.22 30.27 27.6 25.99 25.38 30.5 32.27 39.27 28.49 26.88 22.6 27.05 30.38 26.44
5 27.61 30.27 31.94 29.83 27.44 26.33 32.05 33.38 40.66 29.49 26.16 21.72 28.55 32.16 27.99
6 29.16 3.22 32.77 30.99 28.77 27.05 33.88 35.72 43.38 30.77 24.77 20.16 30.94 33.66 29.1
7 31.94 32.49 34.22 32.44 30.27 27.94 35.88 37.77 47.05 31.77 22.49 18.55 32.83 35.55 30.55
8 32.44 33.72 35.21 33.33 30.88 28.88 37.05 40.94 51.38 33.16 20.71 16.94 33.94 36.88 31.49
9 33.66 34.72 36.27 34.38 31.94 29.72 38.66 42.88 54.94 34.83 19.6 15.38 35.23 38.27 32.44
10 34.05 35.6 37.16 35.49 32.88 30.71 39.66 46.33 60.05 35.66 18.21 14.05 36.1 39.88 33.6
Survival of pathogens is influenced by a wide variety of physico-
chemical conditions such as nacl, iron, nitrate, pH, temperature and
often a combination of the factors.
High nitrate contamination of groundwater is found mainly in agricul-
tural regions as a result of the widespread application of fertilizers and
animal manure to agricultural land (Liu et al., 2005).
The longer pathogens can survive in the environment, the more liable
they are to contaminate water and food crops (Qadir et al., 2008).
Water, like food, is a vehicle for the transmission of many agents of
disease and continues to cause significant outbreaks in developed and
developing countries world-wide (Brandl, 2006).
Escherichia coli O157:H7 has been identified as an important
pathogen that causes disease in humans in developing countries,
particularly in the southern hemisphere, including South Africa
(WHO, 1997).
Pathogens are capable of withstanding various
parameters within the environment.
There is a growing concern this may contribute to their
survival in irrigation water.
Therefore, the objective of the study was to determine
the survival of E. coli O157:H7 in irrigation water under
varying physico-chemical parameters.
This will enable a better understanding of the effect of
water quality and may assist in selecting suitable alter-
native measures to cope with potential water quality
related problems that might reduce bacterial survival
under prevailing conditions of use.
A B
Sampling
time (d)
NaCl (%) pH Iron (mg/l) Nitrate (mg/l) Combined Control
1 3 5 4 7 9 10 20 30 10 20 30 i ii
0
25.66 25.66 25.66 25.66 25.66 25.66 25.66 25.66 25.66 25.66 25.66 25.66 25.66 25.66 25.66
1 25.33 23.83 23.5 23.66 24.33 23 22 24.33 25 24.16 22.33 20.16 26.16 24.83 24.83
2 24 22.5 21.33 21.66 23.66 21.33 20 22.66 24 22.5 20 18.83 27.16 23.66 23.66
3 22.33 20.83 19.16 19.83 22.83 20 19 20.83 22.83 20.83 17.66 15.83 25.5 23 23.83
4 22 19 17.5 18.33 22 18.66 16.83 19.33 21.83 19.16 16.33 13.66 24 21.5 23.33
5 21.5 17.66 16.33 16.5 20.83 16.16 15.16 17.33 21.16 17.16 14.83 12 22.16 20.33 22.16
6 20.5 16.83 14.16 14 19.66 14.83 13.5 15.83 20 16.16 13.16 9.16 20.5 19.33 20.83
7 19.5 16.5 12.83 11.83 18.66 14.83 11.33 13.83 18.83 14.5 11 7.16 18.66 18.16 20.5
8 18.16 15.83 11.16 10.5 17.5 13.16 9.66 12.16 17.5 13.16 9.66 5.66 16.83 17.16 19.5
9 16.83 13.33 10.16 9..16 16.5 11.5 8.16 11.16 16 12.33 8.5 4.5 15.33 16.5 18.83
10 16.66 12 8.5 7.16 15.33 10 7 10.5 14.33 11.16 8.33 3.83 14.66 15.66 17.5
NA = Non adherent
A similar trend was observed for all the parameters whereby cell counts increased after resuscita-
tion.
E. coli was moderately adherent under conditions of 5% NaCl (0.193 ± 0.03) and at pH 4 (0.159 ±
0.059).
SEM provided evidence of biofilm formation under these conditions whereby a E. coli cells were
observed in mosaic structures (Figures 5 A and B).
Cells in the controls were not found to be in the VBNC state (Figure 4 D) or form biofilms (Figure 5
C) since no stress was encountered.
ACKNOWLEDGMENTS
Besnard, V., M. Federigh, E. Declerq, F. Jugiau, and J. M. Cappelier. 2002 Vet. Res. 33:
359 – 370.
Bradford, M. 1976. Anal. Biochem. 72:248-254.
Brandl, M. T. 2006. Annual. Rev. Phytopath. 44: 367-392.
Dungumaro, E. W. 2007. doi:10.1016/j.pce.2007.07.006. 32: 1141- 1147.
Islam, M., M. P. Doyle, S. C. Phatak, P. Millner, and X. Jiang. 2005. Food Microbiol. 22:
63-70.
Izard, J., and R. J. Limberger. 2003. J. Microbiol. 55: 411-418.
Kirby, R. M., J. Bartram, and R. Carr. 2003. Food Control. 14: 283–299.
Liu, A., J. Ming, and R. O. Ankumah. 2005. Sci Total Environ. 346: 112-120.
Qadir, M., D. Wichelns, L. Raschid-Sally, P. G. McCornick, P. Drechsel, A. Bahri, P. S.
Minhas. 2008. doi:10.1016/j.agwat.2008.11.004.
Manas, P., R.Pagan, I. Leguerinel, S. Condon, P. Mafart, and F. Sala. 2001. Int. J. Food.
Microbiol. 63: 209-216.
Schwarzenbach, R. P., B. I. Escher, K. Fenner, T. B. Hofstetter, C. A. Johnson, U.
Gunten, and B. Wehrli. 006. Science. 313:1072-1077.
Steele, M., and J. Odumeru. 2004. J. Food Prot. 67:2839-2849.
Stepanović, S. D., I. Vuković, B. Dakić, B. Savić, and M. Švabić-Vlahović. 2000. J.
Microbiol, Methods.40: 175-179.
WHO. 1997. In Report of a WHO Consultation, Geneva, 28 April–1 May.

More Related Content

What's hot

THE EFFECT OF WATER TREATMENT ON CALCIUM AND BERYLLIUM LEVELS OF WATER IN KAR...
THE EFFECT OF WATER TREATMENT ON CALCIUM AND BERYLLIUM LEVELS OF WATER IN KAR...THE EFFECT OF WATER TREATMENT ON CALCIUM AND BERYLLIUM LEVELS OF WATER IN KAR...
THE EFFECT OF WATER TREATMENT ON CALCIUM AND BERYLLIUM LEVELS OF WATER IN KAR...EDITOR IJCRCPS
 
Heavy Metals in organs and endoparasites of Oreochromisniloticus, Sediment an...
Heavy Metals in organs and endoparasites of Oreochromisniloticus, Sediment an...Heavy Metals in organs and endoparasites of Oreochromisniloticus, Sediment an...
Heavy Metals in organs and endoparasites of Oreochromisniloticus, Sediment an...iosrjce
 
Incidence of lipolytic mycoflora in domestic wastewater
Incidence of lipolytic mycoflora in domestic wastewaterIncidence of lipolytic mycoflora in domestic wastewater
Incidence of lipolytic mycoflora in domestic wastewaterAlexander Decker
 
Evaluation of water quality and toxicity after exposure of lead nitrate in Cy...
Evaluation of water quality and toxicityafter exposure of lead nitrate in Cy...Evaluation of water quality and toxicityafter exposure of lead nitrate in Cy...
Evaluation of water quality and toxicity after exposure of lead nitrate in Cy...Sana_haroon
 
A simple chemical free arsenic removal method for community
A simple chemical free arsenic removal method for communityA simple chemical free arsenic removal method for community
A simple chemical free arsenic removal method for communitySoumyadeep Mukherjee
 
combined toxicity and bioconcentration of fluoride and arsenic in african (3)
combined toxicity and bioconcentration of fluoride and arsenic in african (3)combined toxicity and bioconcentration of fluoride and arsenic in african (3)
combined toxicity and bioconcentration of fluoride and arsenic in african (3)IJEAB
 
Environment & Agricultural Microbiology MCQ
Environment & Agricultural Microbiology MCQEnvironment & Agricultural Microbiology MCQ
Environment & Agricultural Microbiology MCQAfra Fathima
 
Sulfur metabolism in bacteria
Sulfur metabolism in bacteriaSulfur metabolism in bacteria
Sulfur metabolism in bacteriaJina Capdepon
 
Designing of PoU Water Disinfection Unit using Copper
Designing of PoU Water Disinfection Unit using CopperDesigning of PoU Water Disinfection Unit using Copper
Designing of PoU Water Disinfection Unit using CopperSONAL GARG
 
DocumThe effect of Amaranthus hybridus on fluoride removal by iron (III) salt...
DocumThe effect of Amaranthus hybridus on fluoride removal by iron (III) salt...DocumThe effect of Amaranthus hybridus on fluoride removal by iron (III) salt...
DocumThe effect of Amaranthus hybridus on fluoride removal by iron (III) salt...Hezron Mwakabona
 
Physicochemical and Microbiological analysis of tube-well water from Noakhali...
Physicochemical and Microbiological analysis of tube-well water from Noakhali...Physicochemical and Microbiological analysis of tube-well water from Noakhali...
Physicochemical and Microbiological analysis of tube-well water from Noakhali...Premier Publishers
 
Microbial and physico chemical analyses of five major dump sites and nearby w...
Microbial and physico chemical analyses of five major dump sites and nearby w...Microbial and physico chemical analyses of five major dump sites and nearby w...
Microbial and physico chemical analyses of five major dump sites and nearby w...Alexander Decker
 
wadhwani et al 2016. Indain j Micro
wadhwani et al 2016. Indain j Microwadhwani et al 2016. Indain j Micro
wadhwani et al 2016. Indain j Microsweety wadhwani
 
Shallow Well Water Quality in Akure Metrapolis .by Ojo Mary
Shallow Well Water Quality in Akure Metrapolis .by Ojo MaryShallow Well Water Quality in Akure Metrapolis .by Ojo Mary
Shallow Well Water Quality in Akure Metrapolis .by Ojo MaryNSEAkure
 
Food microbiology mcq
Food microbiology mcqFood microbiology mcq
Food microbiology mcqAfra Fathima
 

What's hot (20)

THE EFFECT OF WATER TREATMENT ON CALCIUM AND BERYLLIUM LEVELS OF WATER IN KAR...
THE EFFECT OF WATER TREATMENT ON CALCIUM AND BERYLLIUM LEVELS OF WATER IN KAR...THE EFFECT OF WATER TREATMENT ON CALCIUM AND BERYLLIUM LEVELS OF WATER IN KAR...
THE EFFECT OF WATER TREATMENT ON CALCIUM AND BERYLLIUM LEVELS OF WATER IN KAR...
 
Heavy Metals in organs and endoparasites of Oreochromisniloticus, Sediment an...
Heavy Metals in organs and endoparasites of Oreochromisniloticus, Sediment an...Heavy Metals in organs and endoparasites of Oreochromisniloticus, Sediment an...
Heavy Metals in organs and endoparasites of Oreochromisniloticus, Sediment an...
 
Incidence of lipolytic mycoflora in domestic wastewater
Incidence of lipolytic mycoflora in domestic wastewaterIncidence of lipolytic mycoflora in domestic wastewater
Incidence of lipolytic mycoflora in domestic wastewater
 
Evaluation of water quality and toxicity after exposure of lead nitrate in Cy...
Evaluation of water quality and toxicityafter exposure of lead nitrate in Cy...Evaluation of water quality and toxicityafter exposure of lead nitrate in Cy...
Evaluation of water quality and toxicity after exposure of lead nitrate in Cy...
 
Final EHS 428 Poster
Final EHS 428 PosterFinal EHS 428 Poster
Final EHS 428 Poster
 
A simple chemical free arsenic removal method for community
A simple chemical free arsenic removal method for communityA simple chemical free arsenic removal method for community
A simple chemical free arsenic removal method for community
 
paper LBNL CRV
paper LBNL CRVpaper LBNL CRV
paper LBNL CRV
 
Avenimelech 1999
Avenimelech 1999Avenimelech 1999
Avenimelech 1999
 
combined toxicity and bioconcentration of fluoride and arsenic in african (3)
combined toxicity and bioconcentration of fluoride and arsenic in african (3)combined toxicity and bioconcentration of fluoride and arsenic in african (3)
combined toxicity and bioconcentration of fluoride and arsenic in african (3)
 
AI_2012_1_Claudi_etal
AI_2012_1_Claudi_etalAI_2012_1_Claudi_etal
AI_2012_1_Claudi_etal
 
Environment & Agricultural Microbiology MCQ
Environment & Agricultural Microbiology MCQEnvironment & Agricultural Microbiology MCQ
Environment & Agricultural Microbiology MCQ
 
Sulfur metabolism in bacteria
Sulfur metabolism in bacteriaSulfur metabolism in bacteria
Sulfur metabolism in bacteria
 
Designing of PoU Water Disinfection Unit using Copper
Designing of PoU Water Disinfection Unit using CopperDesigning of PoU Water Disinfection Unit using Copper
Designing of PoU Water Disinfection Unit using Copper
 
DocumThe effect of Amaranthus hybridus on fluoride removal by iron (III) salt...
DocumThe effect of Amaranthus hybridus on fluoride removal by iron (III) salt...DocumThe effect of Amaranthus hybridus on fluoride removal by iron (III) salt...
DocumThe effect of Amaranthus hybridus on fluoride removal by iron (III) salt...
 
Physicochemical and Microbiological analysis of tube-well water from Noakhali...
Physicochemical and Microbiological analysis of tube-well water from Noakhali...Physicochemical and Microbiological analysis of tube-well water from Noakhali...
Physicochemical and Microbiological analysis of tube-well water from Noakhali...
 
Microbial and physico chemical analyses of five major dump sites and nearby w...
Microbial and physico chemical analyses of five major dump sites and nearby w...Microbial and physico chemical analyses of five major dump sites and nearby w...
Microbial and physico chemical analyses of five major dump sites and nearby w...
 
Effect of Increasing Sewage Waste on the Population of Some Microbes of River...
Effect of Increasing Sewage Waste on the Population of Some Microbes of River...Effect of Increasing Sewage Waste on the Population of Some Microbes of River...
Effect of Increasing Sewage Waste on the Population of Some Microbes of River...
 
wadhwani et al 2016. Indain j Micro
wadhwani et al 2016. Indain j Microwadhwani et al 2016. Indain j Micro
wadhwani et al 2016. Indain j Micro
 
Shallow Well Water Quality in Akure Metrapolis .by Ojo Mary
Shallow Well Water Quality in Akure Metrapolis .by Ojo MaryShallow Well Water Quality in Akure Metrapolis .by Ojo Mary
Shallow Well Water Quality in Akure Metrapolis .by Ojo Mary
 
Food microbiology mcq
Food microbiology mcqFood microbiology mcq
Food microbiology mcq
 

Similar to farnaazpdf

KuhnJenna2015URP_Poster
KuhnJenna2015URP_PosterKuhnJenna2015URP_Poster
KuhnJenna2015URP_PosterJenna Kuhn
 
Vegetable production through Aquaponics.pptx
Vegetable production through Aquaponics.pptxVegetable production through Aquaponics.pptx
Vegetable production through Aquaponics.pptxDr. Kalpesh Vaghela
 
Pollutant accumulation in soils irrigated with untreated wastewater for more ...
Pollutant accumulation in soils irrigated with untreated wastewater for more ...Pollutant accumulation in soils irrigated with untreated wastewater for more ...
Pollutant accumulation in soils irrigated with untreated wastewater for more ...ExternalEvents
 
Physico – Chemical and Bacteriological Analysis of Well Water at Crescent Roa...
Physico – Chemical and Bacteriological Analysis of Well Water at Crescent Roa...Physico – Chemical and Bacteriological Analysis of Well Water at Crescent Roa...
Physico – Chemical and Bacteriological Analysis of Well Water at Crescent Roa...theijes
 
BACTERIOLOGICAL QUALITY OF SACHET WATER SOLD WITHIN KADUNA METROPOLIS
BACTERIOLOGICAL QUALITY OF SACHET WATER SOLD WITHIN KADUNA METROPOLISBACTERIOLOGICAL QUALITY OF SACHET WATER SOLD WITHIN KADUNA METROPOLIS
BACTERIOLOGICAL QUALITY OF SACHET WATER SOLD WITHIN KADUNA METROPOLISPAUL ALEYOMI
 
GarciaThesisComplete
GarciaThesisCompleteGarciaThesisComplete
GarciaThesisCompletejuan garcia
 
Investigation of the effect of initial biomass on nitrate and phosphate remov...
Investigation of the effect of initial biomass on nitrate and phosphate remov...Investigation of the effect of initial biomass on nitrate and phosphate remov...
Investigation of the effect of initial biomass on nitrate and phosphate remov...Alexander Decker
 
Kaniesha J. Baker- Bioinformatics - Spring 2015 -Thesis
Kaniesha J. Baker- Bioinformatics - Spring 2015 -ThesisKaniesha J. Baker- Bioinformatics - Spring 2015 -Thesis
Kaniesha J. Baker- Bioinformatics - Spring 2015 -ThesisKaniesha Baker
 
Optimization modeling of water quality in pollution regions of nigeria
Optimization modeling of water quality in pollution regions of  nigeriaOptimization modeling of water quality in pollution regions of  nigeria
Optimization modeling of water quality in pollution regions of nigeriaAlexander Decker
 
Case study of_jar_water_in_kathmandu_valley-ranjana_budhathoki (1) BY Muhamm...
Case study of_jar_water_in_kathmandu_valley-ranjana_budhathoki (1)  BY Muhamm...Case study of_jar_water_in_kathmandu_valley-ranjana_budhathoki (1)  BY Muhamm...
Case study of_jar_water_in_kathmandu_valley-ranjana_budhathoki (1) BY Muhamm...fahadansari131
 
Assessment of drinking water quality from different sources in smallholder ru...
Assessment of drinking water quality from different sources in smallholder ru...Assessment of drinking water quality from different sources in smallholder ru...
Assessment of drinking water quality from different sources in smallholder ru...Alexander Decker
 
Bacteriological Investigation of Well Water Samples from Selected Market Loca...
Bacteriological Investigation of Well Water Samples from Selected Market Loca...Bacteriological Investigation of Well Water Samples from Selected Market Loca...
Bacteriological Investigation of Well Water Samples from Selected Market Loca...inventionjournals
 
Final solar disinfection for water purification
Final  solar disinfection for water purificationFinal  solar disinfection for water purification
Final solar disinfection for water purificationanita03verde
 

Similar to farnaazpdf (20)

Nitrogen Transformations in Aquaponic Systems
Nitrogen Transformations in Aquaponic SystemsNitrogen Transformations in Aquaponic Systems
Nitrogen Transformations in Aquaponic Systems
 
KuhnJenna2015URP_Poster
KuhnJenna2015URP_PosterKuhnJenna2015URP_Poster
KuhnJenna2015URP_Poster
 
Williams-etal_2011_ES&T_Antibacterial-clays_es1040688
Williams-etal_2011_ES&T_Antibacterial-clays_es1040688Williams-etal_2011_ES&T_Antibacterial-clays_es1040688
Williams-etal_2011_ES&T_Antibacterial-clays_es1040688
 
Biofilter.pptx
Biofilter.pptxBiofilter.pptx
Biofilter.pptx
 
Vegetable production through Aquaponics.pptx
Vegetable production through Aquaponics.pptxVegetable production through Aquaponics.pptx
Vegetable production through Aquaponics.pptx
 
Pollutant accumulation in soils irrigated with untreated wastewater for more ...
Pollutant accumulation in soils irrigated with untreated wastewater for more ...Pollutant accumulation in soils irrigated with untreated wastewater for more ...
Pollutant accumulation in soils irrigated with untreated wastewater for more ...
 
Physico – Chemical and Bacteriological Analysis of Well Water at Crescent Roa...
Physico – Chemical and Bacteriological Analysis of Well Water at Crescent Roa...Physico – Chemical and Bacteriological Analysis of Well Water at Crescent Roa...
Physico – Chemical and Bacteriological Analysis of Well Water at Crescent Roa...
 
BACTERIOLOGICAL QUALITY OF SACHET WATER SOLD WITHIN KADUNA METROPOLIS
BACTERIOLOGICAL QUALITY OF SACHET WATER SOLD WITHIN KADUNA METROPOLISBACTERIOLOGICAL QUALITY OF SACHET WATER SOLD WITHIN KADUNA METROPOLIS
BACTERIOLOGICAL QUALITY OF SACHET WATER SOLD WITHIN KADUNA METROPOLIS
 
GarciaThesisComplete
GarciaThesisCompleteGarciaThesisComplete
GarciaThesisComplete
 
Investigation of the effect of initial biomass on nitrate and phosphate remov...
Investigation of the effect of initial biomass on nitrate and phosphate remov...Investigation of the effect of initial biomass on nitrate and phosphate remov...
Investigation of the effect of initial biomass on nitrate and phosphate remov...
 
190 jyoti
190 jyoti190 jyoti
190 jyoti
 
SIR MJB 215.pptx
SIR MJB 215.pptxSIR MJB 215.pptx
SIR MJB 215.pptx
 
Kaniesha J. Baker- Bioinformatics - Spring 2015 -Thesis
Kaniesha J. Baker- Bioinformatics - Spring 2015 -ThesisKaniesha J. Baker- Bioinformatics - Spring 2015 -Thesis
Kaniesha J. Baker- Bioinformatics - Spring 2015 -Thesis
 
Optimization modeling of water quality in pollution regions of nigeria
Optimization modeling of water quality in pollution regions of  nigeriaOptimization modeling of water quality in pollution regions of  nigeria
Optimization modeling of water quality in pollution regions of nigeria
 
Case study of_jar_water_in_kathmandu_valley-ranjana_budhathoki (1) BY Muhamm...
Case study of_jar_water_in_kathmandu_valley-ranjana_budhathoki (1)  BY Muhamm...Case study of_jar_water_in_kathmandu_valley-ranjana_budhathoki (1)  BY Muhamm...
Case study of_jar_water_in_kathmandu_valley-ranjana_budhathoki (1) BY Muhamm...
 
Dr..Ismaeel...graduated research
Dr..Ismaeel...graduated researchDr..Ismaeel...graduated research
Dr..Ismaeel...graduated research
 
Ecology presentation
Ecology presentationEcology presentation
Ecology presentation
 
Assessment of drinking water quality from different sources in smallholder ru...
Assessment of drinking water quality from different sources in smallholder ru...Assessment of drinking water quality from different sources in smallholder ru...
Assessment of drinking water quality from different sources in smallholder ru...
 
Bacteriological Investigation of Well Water Samples from Selected Market Loca...
Bacteriological Investigation of Well Water Samples from Selected Market Loca...Bacteriological Investigation of Well Water Samples from Selected Market Loca...
Bacteriological Investigation of Well Water Samples from Selected Market Loca...
 
Final solar disinfection for water purification
Final  solar disinfection for water purificationFinal  solar disinfection for water purification
Final solar disinfection for water purification
 

farnaazpdf

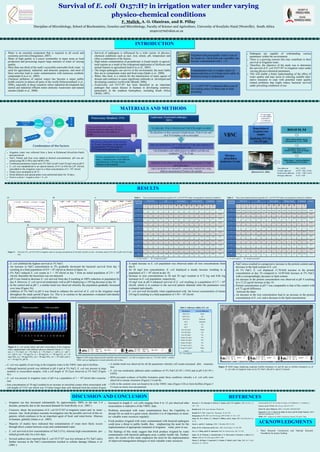
  • 1. Survival of E. coli O157:H7 in irrigation water under varying physico-chemical conditions F. Malick, A. O. Olaniran, and B. Pillay Discipline of Microbiology, School of Biochemistry, Genetics and Microbiology, Faculty of Science and Agriculture, University of KwaZulu-Natal (Westville), South Africa 204011270@ukzn.ac.za Figure 4: SEM images diplaying both culturable and resuscitated E. coli cells in irrigation water (A = 5% NaCl and B = control) VBNC cells are highlighted in red and culturable cells in blue. Figure 5: SEM image displaying moderate biofilm formation (A and B) and no biofilm formation (c) of E. coli cells in irrigation water at (A) 5% NaCl; (B) pH 4, and (C) Control). (a) (b) c) (d) (e) Figure 1: Survival of E. coli O157:H7 in irrigation water at varying concentrations of (a) NaCl, (b) pH, (c) iron , (d) nitrate, and (e) 5% NaCl at pH 4 and 10 mg/l iron E. coli exhibited the highest survival at 1% NaCl. An increase in NaCl concentration to 3% gradually decreased the bacterial survival from day 1 resulting in a final population of 8.9 × 101 cfu/ml as shown in figure 1a. 5% NaCl reduced E. coli counts to 1 × 10² cfu/ml at day 7 from an initial population of 2.9 × 10⁴ cfu/ml, thereafter the bacterium was not detected. pH 4 was found to decrease E. coli survival from day 0 resulting in 100% reduction in population by day 8. However, E. coli survived moderately well at pH 9 displaying a 1.89 log decrease at day 10. In the control and at pH 7, a similar trend was observed whereby the population gradually increased over time (Figure 1b). Addition of 5% NaCl at pH 4 was found to enhance the survival of E. coli in the irrigation water throughout the study period (Figure 1e). This is in contrast to the parameters evaluated individually which resulted in a rapid decrease with time. Table 1: Time course protein production (µg/ml) of E. coli O157:H7 under varying physico-chemical conditions Irrigation water was collected from a farm in Richmond (KwaZulu-Natal) and autoclaved. NaCl, Nitrate and Iron were added at desired concentrations. pH was ad- justed using HCl (10%) and NaOH (1M). Combined parameters tested were 5% NaCl at pH 4 and 10 mg/l iron at pH 9 E. coli was standardized to an optical density of 0.5 at 630 nm (108 cfu/ml) and added to the irrigation water to a final concentration of 2 ×10⁵ cfu/ml Flasks were incubated at 30 °C. Serial dilutions and spread plates were performed daily for 10 days. Positive controls = irrigation water + E. coli MATERIALS AND METHODS RESULTS Irrigation use has increased substantially by approximately 300% in the last 3–4 decades, primarily due to the increased demand for food (Kirby et al., 2003 ). Concerns about the persistence of E. coli O157:H7 in irrigation waters and its trans- mission into fresh produce warrants investigation into the possible survival of this or- ganism, which continues to be an important agent of food- and water-borne illnesses in humans, globally (Islam et al., 2005). Majority of studies have indicated that contamination of crops most likely occurs through direct contact between crops and contaminated water. E. coli survived at low concentrations of NaCl (1%), whereas high concentrations per- mitted growth only for a few days. Several authors have reported that E. coli O157:H7 was less tolerant at 5% NaCl and a further increase in the NaCl concentration resulted in cellular damage (Manas et al. (2001 ). DISCUSSION AND CONCLUSION Increased in length E. coli cells ranging from 4 to 12 µm observed after resuscitation is indicative of the VBNC state. Problems associated with water contamination have the Capability to disrupt life on earth to a great extent, therefore it is of importance to moni- tor valuable water resources regularly . Fresh produce irrigated with water contaminated with bacterial pathogens could pose a threat to public health, thus emphasizing the need for the implementation of appropriate treatment of irrigation water, prior to use. The findings of this study suggest that fresh produce irrigated by water contaminated with bacterial pathogens pose a public health risk. Further- more, the results of this study emphasize the need for the implementation of improved management strategies of such valuable water resources. INTRODUCTION Water is an essential component that is required in all social and economic activities (Dungumaro, 2007). Water of high quality is a scarce commodity in many areas as food production and processing require large amounts of water of varying quality. More than one-third of the earth’s accessible renewable fresh water is used for agricultural, industrial, and domestic purposes, and most of these activities lead to water contamination with numerous synthetic compounds (Liu et al., 2005). Chemical pollution of natural waters has become a major public health concern in almost all parts of the world (Schwarzenbach et al., 2006), especially in those countries where industrial development has started and industrial effluent enters domestic wastewater and natural streams (Qadir et al., 2008). i = 5% NaCl at pH 4 ii = 10 mg/l iron at pH 9 Table 2: Time course lipid production ((µg/ml) of E. coli O157:H7 under varying physico-chemical conditions i = 5% NaCl at pH 4 ii = 10 mg/l iron at pH 9 A rapid increase in E. coli population was observed under all iron concentrations from day 0. At 10 mg/l iron concentration, E. coli displayed a steady increase resulting in a population of 2 × 10⁵ cfu/ml at day 10. Increase in iron concentrations to 20 and 30 mg/l resulted in 0.72 log and 0.86 log increases in E. coli population, respectively. 10 mg/l iron at pH 4 enhanced survival of E. coli resulting in a population of 3.7 × 10⁵ cfu/ml, which is in contrast to the survival pattern obtained when the parameters were evaluated individually. E. coli survived favourably when supplemented with the lowest concentration of nitrate (10 mg/l) resulting in a final population of 1.94 × 10⁴ cfu/ml. NaCl stress resulted in a progressive increase in the protein content and a decrease in the lipid content of E. coli . At 1% NaCl, E. coli displayed 11.78-fold increase in the protein concentration at day 10 compared to 14.89-fold increase at 5% NaCl, with a correspondingly decrease in lipid content. An increase in the protein concentration was observed at pH 4 resulting in a 13.22 µg/ml increase at day 10. Protein concentration at pH 7 was comparable to that of the control with a 0.72 μg/ml difference between the latter. An increase in the iron concentration lead to an increase in the protein concentration of E. coli, and a decrease in the lipid concentration. Figure 3: E. coli counts before and after resuscitation of the irrigation water supplemented with different physico-chemical factors (i = Con- trol, ii = 1% NaCl, iii = 3% NaCl, iv = 5% NaCl, v = pH 4, vi = pH 7, vii = pH 9, viii = 10 mg/l Fe, ix = 20 mg/l Fe, x = 30 mg/l Fe, xi = 10 mg/l NO3, xii = 20 mg/l NO3, xiii = 30 mg/l NO3, xiv = 5% NaCl; pH 4, xv = 10 mg/l Fe; pH 9). Parameters Level of adherence NaCl (1%) Weak NaCl (3% ) NA NaCl (5%) Moderate pH 4 Moderate pH 7 NA pH 9 NA Iron (10 mg/l) Weak Iron (20 mg/l) NA Iron (30 mg/l) NA Nitrate (10 mg/l) NA Nitrate (20 mg/l) NA Nitrate (30 mg/l) NA 5% NaCl at pH 4 NA 10 mg/l Fe at pH 9 Weak Control NA Table 3: Adherence ability of E. coli A B C E. coli was capable of surviving in the irrigation water in the VBNC state and in biofilms. Although bacterial growth was inhibited at pH 4 and at 5% NaCl, E. coli was present in large numbers in resuscitated samples, with a cell length of 10.33µm observed at 5% NaCl (Figure 4a ). E. coli was present in irrigation water of pH 4 at a population of 1 × 10⁴ cfu/ml after resuscita- tion. Iron concentration of 10 mg/l resulted in an increase in microbial counts when resuscitated with cell lengths of 12.67 µm which was 3.9 times longer than cells obtained from the control (Figure 4b). REFERENCES Water Research Commission and National Research Foundation for project funding 0 1 2 3 4 5 6 7 8 i ii iii iv v vi vii viii ix x xi xii xiii xiv xv E.colicount (Logcfu/ml) Parameters Before resuscitation Afterresuscitation Sampling time (d) NaCl (%) pH Iron (mg/l) Nitrate (mg/l) Combined Control 1 3 5 4 7 9 10 20 30 10 20 30 i ii 0 22.27 22.27 22.27 22.27 22.27 22.27 22.27 22.27 22.27 22.27 22.27 22.27 22.27 22.27 22.27 1 22.77 24.94 25.27 23.05 22.66 22.66 25.11 26.05 28.77 25.33 23.49 22.66 22.99 25.05 22.99 2 23.27 26.94 26.99 24.05 23.44 23.33 26.83 27.77 32.22 26.55 24.16 23.16 23.94 26.27 23.88 3 25.44 28.33 28.22 25.77 24.38 24.1 28.55 30.05 37.66 27.66 25.49 23.55 25.55 27.94 25.05 4 27.16 29.22 30.27 27.6 25.99 25.38 30.5 32.27 39.27 28.49 26.88 22.6 27.05 30.38 26.44 5 27.61 30.27 31.94 29.83 27.44 26.33 32.05 33.38 40.66 29.49 26.16 21.72 28.55 32.16 27.99 6 29.16 3.22 32.77 30.99 28.77 27.05 33.88 35.72 43.38 30.77 24.77 20.16 30.94 33.66 29.1 7 31.94 32.49 34.22 32.44 30.27 27.94 35.88 37.77 47.05 31.77 22.49 18.55 32.83 35.55 30.55 8 32.44 33.72 35.21 33.33 30.88 28.88 37.05 40.94 51.38 33.16 20.71 16.94 33.94 36.88 31.49 9 33.66 34.72 36.27 34.38 31.94 29.72 38.66 42.88 54.94 34.83 19.6 15.38 35.23 38.27 32.44 10 34.05 35.6 37.16 35.49 32.88 30.71 39.66 46.33 60.05 35.66 18.21 14.05 36.1 39.88 33.6 Survival of pathogens is influenced by a wide variety of physico- chemical conditions such as nacl, iron, nitrate, pH, temperature and often a combination of the factors. High nitrate contamination of groundwater is found mainly in agricul- tural regions as a result of the widespread application of fertilizers and animal manure to agricultural land (Liu et al., 2005). The longer pathogens can survive in the environment, the more liable they are to contaminate water and food crops (Qadir et al., 2008). Water, like food, is a vehicle for the transmission of many agents of disease and continues to cause significant outbreaks in developed and developing countries world-wide (Brandl, 2006). Escherichia coli O157:H7 has been identified as an important pathogen that causes disease in humans in developing countries, particularly in the southern hemisphere, including South Africa (WHO, 1997). Pathogens are capable of withstanding various parameters within the environment. There is a growing concern this may contribute to their survival in irrigation water. Therefore, the objective of the study was to determine the survival of E. coli O157:H7 in irrigation water under varying physico-chemical parameters. This will enable a better understanding of the effect of water quality and may assist in selecting suitable alter- native measures to cope with potential water quality related problems that might reduce bacterial survival under prevailing conditions of use. A B Sampling time (d) NaCl (%) pH Iron (mg/l) Nitrate (mg/l) Combined Control 1 3 5 4 7 9 10 20 30 10 20 30 i ii 0 25.66 25.66 25.66 25.66 25.66 25.66 25.66 25.66 25.66 25.66 25.66 25.66 25.66 25.66 25.66 1 25.33 23.83 23.5 23.66 24.33 23 22 24.33 25 24.16 22.33 20.16 26.16 24.83 24.83 2 24 22.5 21.33 21.66 23.66 21.33 20 22.66 24 22.5 20 18.83 27.16 23.66 23.66 3 22.33 20.83 19.16 19.83 22.83 20 19 20.83 22.83 20.83 17.66 15.83 25.5 23 23.83 4 22 19 17.5 18.33 22 18.66 16.83 19.33 21.83 19.16 16.33 13.66 24 21.5 23.33 5 21.5 17.66 16.33 16.5 20.83 16.16 15.16 17.33 21.16 17.16 14.83 12 22.16 20.33 22.16 6 20.5 16.83 14.16 14 19.66 14.83 13.5 15.83 20 16.16 13.16 9.16 20.5 19.33 20.83 7 19.5 16.5 12.83 11.83 18.66 14.83 11.33 13.83 18.83 14.5 11 7.16 18.66 18.16 20.5 8 18.16 15.83 11.16 10.5 17.5 13.16 9.66 12.16 17.5 13.16 9.66 5.66 16.83 17.16 19.5 9 16.83 13.33 10.16 9..16 16.5 11.5 8.16 11.16 16 12.33 8.5 4.5 15.33 16.5 18.83 10 16.66 12 8.5 7.16 15.33 10 7 10.5 14.33 11.16 8.33 3.83 14.66 15.66 17.5 NA = Non adherent A similar trend was observed for all the parameters whereby cell counts increased after resuscita- tion. E. coli was moderately adherent under conditions of 5% NaCl (0.193 ± 0.03) and at pH 4 (0.159 ± 0.059). SEM provided evidence of biofilm formation under these conditions whereby a E. coli cells were observed in mosaic structures (Figures 5 A and B). Cells in the controls were not found to be in the VBNC state (Figure 4 D) or form biofilms (Figure 5 C) since no stress was encountered. ACKNOWLEDGMENTS Besnard, V., M. Federigh, E. Declerq, F. Jugiau, and J. M. Cappelier. 2002 Vet. Res. 33: 359 – 370. Bradford, M. 1976. Anal. Biochem. 72:248-254. Brandl, M. T. 2006. Annual. Rev. Phytopath. 44: 367-392. Dungumaro, E. W. 2007. doi:10.1016/j.pce.2007.07.006. 32: 1141- 1147. Islam, M., M. P. Doyle, S. C. Phatak, P. Millner, and X. Jiang. 2005. Food Microbiol. 22: 63-70. Izard, J., and R. J. Limberger. 2003. J. Microbiol. 55: 411-418. Kirby, R. M., J. Bartram, and R. Carr. 2003. Food Control. 14: 283–299. Liu, A., J. Ming, and R. O. Ankumah. 2005. Sci Total Environ. 346: 112-120. Qadir, M., D. Wichelns, L. Raschid-Sally, P. G. McCornick, P. Drechsel, A. Bahri, P. S. Minhas. 2008. doi:10.1016/j.agwat.2008.11.004. Manas, P., R.Pagan, I. Leguerinel, S. Condon, P. Mafart, and F. Sala. 2001. Int. J. Food. Microbiol. 63: 209-216. Schwarzenbach, R. P., B. I. Escher, K. Fenner, T. B. Hofstetter, C. A. Johnson, U. Gunten, and B. Wehrli. 006. Science. 313:1072-1077. Steele, M., and J. Odumeru. 2004. J. Food Prot. 67:2839-2849. Stepanović, S. D., I. Vuković, B. Dakić, B. Savić, and M. Švabić-Vlahović. 2000. J. Microbiol, Methods.40: 175-179. WHO. 1997. In Report of a WHO Consultation, Geneva, 28 April–1 May.