2. reinforcement over time, often without awareness. Also,
according to SET, there are three discrete ageism predic-
tors: age discrimination, defined as detrimental treatment
of older persons; negative age stereotypes, defined as the
negative beliefs of older persons about older people in
general; and negative self-perceptions of aging, defined
as the negative beliefs of older persons about their
own aging.
Extensive research has shown, consistent with a SET
prediction, that the three ageism variables will adversely
affect the health outcomes of older persons. These stud-
ies, which have been conducted in five continents and are
supported by four meta-analyses, provide evidence for the
directionality of ageism affecting health (Horton, Baker,
Pearce, & Deakin, 2008; Lamont, Swift, & Abrams, 2015;
Meisner, 2012; Westerhof et al., 2014). To illustrate,
experimental studies have found that when older individ-
uals are randomly assigned to a negative-age-stereotype
condition, it impairs health outcomes, such as memory
performance and balance, compared to those in a neutral
or positive-age-stereotype condition (e.g., Lamont et al.,
2015; Levy, 2009; Levy & Leifheit-Limson, 2009; Lee &
Lee, 2018). Similarly, an experimental study found that
when older individuals were randomly exposed to age dis-
crimination in the form of patronizing speech, they per-
formed significantly worse on a cognitive task than those
not exposed to patronizing speech (Hehman & Bugental,
2015).
Also supporting the prediction that the three ageism
variables will adversely affect the health outcomes of
older persons, longitudinal studies conducted with them
in the community have found that ageism variables meas-
ured earlier in life predict health outcomes later in old
age (e.g., Levy, Ferrucci, Zonderman, Slade, Troncoso, &
Resnick, 2016; Westerhof et al., 2014). As an example,
a study found that young adults holding more-negative
age stereotypes were twice as likely to experience car-
diovascular events up to 40 years later than their young
adult peers holding more-positive age stereotypes, after
adjusting for relevant covariates including family history
of cardiovascular disease (Levy, Zonderman, Slade, &
Ferrucci, 2009). Similarly, numerous studies have found
that perceived age discrimination and negative self-per-
ceptions of aging predict worse health for older persons
years later (e.g., Levy, Slade & Kasl, 2002; Marchiondo,
Gonzales, & Williams, 2017; Sargent-Cox, Anstey, &
Luszcz, 2012).
The directionality of ageism predictors on health finds
additional support from studies that have demonstrated
age stereotypes tend to be resistant to even extremely
stressful events (e.g., Levy, Slade, Chung, & Gill, 2015).
Also, age discrimination and self-perceptions of aging
tend to be stable over time (see Supplementary Material).
Further, the impact of ageism on health is stronger than
the reverse association (e.g., Levy et al., 2002; Sargent-
Cox et al., 2012; Wurm, Tesch-Römer, & Tomasik,
2007).
SET further postulates that each of the ageism predic-
tors exert their influence on health through three path-
ways: psychological, behavioral, and physiological (e.g.,
Levy, 2009). A number of studies have provided evidence
for these ageism–health pathways (Levy, 2009; Levy &
Bavishi, 2018; Levy, Slade, Pietrzak, & Ferrucci, 2018;
Palmore, 2015; Westerhof et al., 2014). Supporting the
psychological pathway, research has found that negative
age stereotypes can exacerbate stress when older partici-
pants are randomly assigned to age-stereotype conditions
in the laboratory (Levy, Hausdorff, Hencke, & Wei, 2000);
and over time, as assessed by the stress biomarkers of cor-
tisol and C-reactive protein (Levy & Bavishi, 2018; Levy,
Moffat, Resnick, Slade, & Ferrucci, 2016). On the behav-
ioral level, research has found that negative self-percep-
tions of aging predict worse health behaviors over time,
such as noncompliance with prescribed medications (Kim,
Moored, Giasson, & Smith, 2014; Levy & Myers, 2004).
On the physiological level, it has been found that negative
age stereotypes predict detrimental brain changes decades
later, including the accumulation of plaques and tangles
and reduction in size of the hippocampus (Levy, Ferrucci,
et al., 2016).
Building on this background, the aim of the current
study was to identify the health care costs, among eight of
the most-expensive health conditions, associated with the
three ageism predictors for the total population of older
persons in the United States. As a secondary analysis, we
computed the number of these health conditions that were
experienced due to the ageism predictors.
An advantage of setting up the study with these dis-
crete predictors is that each could be targeted in future
interventions. Because research has found psychological
processes are amplified when they affect self-concepts
(Markus, 1977; Petersen, Stahlberg, & Dauenheimer,
2000), as occurs with self-perceptions of aging and, to a
lesser extent, with age stereotypes (Levy, 2009), we pre-
dicted that the health care costs of older persons would
be greatest for negative self-perceptions of aging, fol-
lowed by negative age stereotypes, and then by age
discrimination.
The present study integrates two fields, which do not
customarily interact, by drawing on a set of predictors
that are usually examined by social psychologists and
an outcome that is usually studied by economists. The
latter tend to focus on younger persons and biological
factors as well as medical factors, rather than the soci-
etal antecedents of these factors (Neuman, Sanders,
Russell, Siegel, & Ganiats, 2016). Accordingly, the eco-
nomic costs of ageism on health had not been previously
studied.
The Gerontologist, 2020, Vol. 60, No. 1 175
3. Design and Methods
Overall Analytic Plan
To calculate the health care costs of ageism, as well as
the number of health-condition cases affected by age-
ism for all Americans aged 60 years and older, our study
combined effect sizes from ageism and health-condition
research with the most-recent (2013) comprehensive
health care spending data available from the Institute
for Health Metrics and Evaluation (IHME, 2018). To
increase the number of analyses predicting the impact of
ageism on the selected eight health outcomes, we included
effect sizes from two sources: our new systematic
review of all relevant ageism research and the prospect-
ive models we developed using the nationally represen-
tative Health and Retirement Study (HRS) (Sonnega
& Weir, 2014). To reduce the likelihood that health is
affecting ageism rather than ageism is affecting health,
within the same cohort we selected measures of age-
ism at baseline and health conditions assessed at subse-
quent waves, adjusting for covariates in these models.
In summing the health care costs of the ageism predic-
tors, we removed the overlapping contributions. (See
Supplementary Material for a description of our method
of generating costs for components of ageism, which
was developed for this analysis, along with relevant
calculations.)
Measures
Predictors: Ageism Variables
The age-discrimination measures that were used in
the systematic review studies and the HRS models
included the Everyday Discrimination Scale (Williams,
Yu, Jackson, & Anderson, 1997), which assessed how
often participants experience a set of occurrences based
on their age, including “You are treated with less cour-
tesy or respect than other people.” The age-stereotypes
measures that were used in the systematic review stud-
ies included the Expectations Regarding Aging Survey
(Sarkisian, Steers, Hays, & Mangione, 2005), which asks
participants to rate items on whether they are true, such
as “Forgetfulness is a natural occurrence just from grow-
ing old.” The self-perceptions of aging measures used
in the systematic review studies and the HRS models
included the five-item Attitude Toward Own Aging sub-
scale of the Philadelphia Geriatric Center Morale Scale
(Lawton, 1975; Liang & Bollen, 1983), which asks par-
ticipants how much they agree with five items, including
“The older I get the more useless I feel.” (An explanation
of how we used the three ageism predictors to dichotom-
ize the population into the high- and low-ageism groups,
and generated the prevalence of the high-ageism groups
that were used in the cost calculations, can be found in
Supplementary Material.)
Primary Outcome: Excess Health Care Costs Due
to Ageism
We calculated the excess health care spending due to
ageism (defined as the extent to which this spending is
higher for those in the high-ageism group, compared to
those in the low-ageism group) for eight of the 10 most-
expensive health conditions in the United States during
2013 (Dieleman et al., 2016). (Of the 10 conditions, two
are not applicable to older persons because they include
neonatal costs.) The eight health conditions consisted
of cardiovascular disease, chronic respiratory disease,
musculoskeletal disorders, injuries, diabetes mellitus,
treatment of smoking, mental disorders, and non-com-
municable diseases.
The excess health care spending due to ageism was
derived from the following: (a) number of Americans
aged 60 years or older in 2013; (b) prevalence of age-
ism based on percentage of people at the negative end of
each of the three predictor groups; (c) effect sizes of the
impact of the three predictors on the eight health con-
ditions; (d) prevalence of the eight health conditions in
2013, the most recent year for which health care spend-
ing was available; and (e) IHME costs per person of the
eight health conditions in 2013. A benefit of the IHME
data set is that in presenting health care costs, each dol-
lar spent is only attributed to one health care category
(IHME, 2018). (See Supplementary Material for descrip-
tion of the sources of the numbers, and the calculations
for excess costs due to ageism that adjusted for age and
sex, and which removed the overlapping costs of the
three ageism predictors.)
Secondary Outcome: Number of Health
Conditions Due to Ageism
To calculate the number of health conditions due to age-
ism, we determined the number of people in the high-age-
ism groups, as well as the difference in health condition
rates for those in the low- and high-ageism groups; this
was done for each of the eight health conditions and for
each of the three ageism predictors. (See Supplementary
Material for description of the sources of and calculations
for these numbers that adjusted for age, sex, and overlap-
ping number of health conditions due to the three ageism
predictors.)
Covariates
To assure that we are reporting the two outcomes, the
impact of ageism on the health care costs and the num-
ber of health conditions caused by ageism, above and
beyond the health care costs of age and sex, we adjusted
for these variables in two ways. First, in calculating the
effect sizes for the impact of ageism on health, based
The Gerontologist, 2020, Vol. 60, No. 1
176
4. on our systematic review, the statistics were abstracted
from published studies with models that analyzed older
participants and adjusted for covariates including age
and sex. Most (94%) of these studies also adjusted for
additional covariates, including demographic and health
variables. Further, the ageism–health conditions effect
sizes from HRS were based on prospective models that
examined only participants who were aged 60 years
or older at baseline and adjusted for participants’ age
and sex.
The second way that we adjusted for age and sex in
modeling excess cost due to ageism and the number of
health condition cases due to ageism was by taking into
account 5-year increments for all women and for all men
for each health condition for all Americans aged 60 years
and older in 2013, as listed by IHME. (See Supplementary
Material for the example of how we calculated excess
health care costs for men aged 60–64 years.) The year
2013 was selected for the demographic information as
this was the most recent year available for the IHME
health care cost data.
Effect Sizes Generated from Systematic Review
of Ageism–Health Conditions
To generate the costs of the three ageism predictors on
the eight health conditions, we combined effect sizes
from a systematic review of the literature and from our
HRS models. For the systematic review, we screened
articles that appeared in five databases: PubMed,
PsycINFO, Embase, Global Health, and Web of Science.
The systematic review followed the Cochrane method-
ology (Moher, et al., 2009). Study inclusion criteria were:
(a) published in peer-reviewed journals, (b) examined at
least one of the three ageism predictors as an independ-
ent variable and at least one of the eight health condi-
tions as a dependent variable, (c) analyzed information
from participants who were at least aged 60 years, and
(d) applied statistical approaches to adjust for poten-
tial confounding. Meta-analytic techniques combined
the effect sizes of studies that examined associations
of the same predictors and outcomes. (See description
in the section labeled “Combining the Ageism–Health
Condition Effect Sizes.”)
We developed search terms for the ageism predictors
that are appropriate for each database. Search terms for
age discrimination included the following: ageism, age dis-
crimination, ageist beliefs, and ageist behaviors. Search
terms for age stereotypes included the following: stereo-
type, stereotyping, self-stereotyping, and view of aging.
Search terms for self-perceptions of aging included the
following: self-perceptions of aging, self-concept, atti-
tudes toward own aging, and age satisfaction. This yielded
12,558 articles. After removing duplicate articles, 8,555
articles remained.
Two reviewers then screened the titles and abstracts
of these articles based on our inclusion criteria, which
led to 193 studies. To increase the likelihood that all rele-
vant articles were captured, three additional steps were
undertaken. First, we screened the references of the 193
articles that survived the initial screening. Second, we
screened the references of relevant systematic reviews
and meta-analyses. Third, we screened other articles
written by researchers who were the first or last author
on at least two of the 193 articles. This process identified
an additional two articles, which gave us a total of 195
articles.
Then, two reviewers read the full text of these 195
articles to examine whether they met all of the inclu-
sion criteria. To avoid counting similar findings twice,
when two or more studies that used the same predictor,
the same outcome, and the same data set were found,
we included the study with the largest sample size. As
a quality check, all studies that met inclusion criteria
were reviewed by a third reviewer. Any discrepancies
were resolved through the following sequence: consulting
the original article, discussion, and reaching a consensus
among the three reviewers. This led to the final 17 arti-
cles. (See Supplementary Material for figure that depicts
the flowchart of how we identified the relevant articles
and the article list.)
We abstracted information related to the study effect
size from the final list of 17 articles that met all inclusion
criteria. If there were multiple measures of the predic-
tors, some of which were worded in the positive direction
and some in the negative direction, we selected the one
that was negative and recorded the statistics that aggre-
gated the most information about the impact of the pre-
dictor. Interrater reliability was 94.5. We then conducted
random-effects meta-analyses to combine results of
studies that examined the same predictors and the same
outcomes.
Effect Sizes Generated from HRS Models of
Ageism–Health Conditions
To derive ageism–health condition effect sizes from HRS
(Sonnega & Weir, 2014), we calculated whether the ear-
liest measurement of age discrimination or self-percep-
tions of aging, for persons aged 60 or older at baseline,
predicted a later measurement of one of the eight health
conditions, after adjusting for age and sex. In HRS, age
discrimination was assessed in 2006 or 2008, and self-
perceptions of aging were assessed in 2008 or 2010. HRS
health conditions were assessed in 2012, the closest pre-
ceding year to 2013—the year of the most recent IHME
spending data. (See Supplementary Material for how the
HRS measures were matched to the eight health condi-
tions.) The odds ratios were calculated for participants
aged 60 years and older and were adjusted for age and
sex.
The Gerontologist, 2020, Vol. 60, No. 1 177
5. Combining the Ageism–Health Condition
Effect Sizes
Meta-analytic techniques were used to combine ageism
effect sizes for studies with the same predictor and health
outcome and to combine effect sizes for the same predictor
and health outcome when they came from the systematic
review and the HRS analyses. Although there was com-
plete effect size data for all of the health conditions for the
self-perceptions of aging predictor and for all of the ageism
predictors for the most-prevalent health condition, cardio-
vascular disease, we imputed effect sizes for missing cells.
To be conservative, we based the effect size on the small-
est effect size with another ageism predictor and the same
health condition.
Results
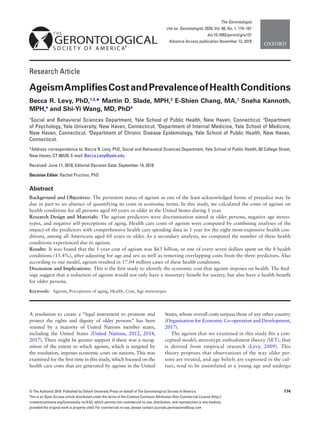
Consistent with our hypothesis, we found that the health
care cost of negative self-perceptions of aging exceeded the
health care cost of negative age stereotypes, which exceeded
the health care cost of age discrimination (see Figure 1).
The excess cost was $11.1 billion for age discrimination,
$28.5 billion for negative age stereotypes, and $33.7 bil-
lion for negative self-perceptions of aging. These costs were
adjusted for age and sex.
The total cost of the ageism predictors, after remov-
ing overlap between them, for the eight most-expensive
health conditions was $63 billion for 1 year. This equates
to 15.4% of overall health care spending for these condi-
tions among those aged 60 years or older in 2013, the most
recent year for which health care spending was available.
For each of the predictors and health conditions, the
cost per person was significantly higher among those in the
high-ageism group, compared to those in the low-ageism
group. Further, the prevalence of each health condition
was significantly greater for the high- than the low-ageism
group (see Table 1).
To extend our analysis beyond dollars to human expe-
riences, we also calculated the number of cases of the
eight health conditions that were experienced by those
aged 60 years or older in the United States during 1 year
due to ageism, after removing overlap of predictors. (See
Table 2 and Supplementary Material for details on these
calculations.) According to our model, there were 17.04
million cases of the health conditions attributable to
ageism.
Discussion
This study helps to give visibility to the damaging results
of ageism. Overall, $63 billion, or one in every seven dol-
lars, spent on health care for the eight most-expensive
conditions during 1 year in the United States was due to
ageism. This is greater than the total amount the United
States spent on health care costs of morbid obesity for the
same year (Kim & Basu, 2016; Tsai, Williamson, & Glick,
2011).
Further, according to our model, 17.04 million cases of
the health conditions are due to ageism. This means that
even a 10% reduction in the prevalence of ageism could
lead to 1.7 million fewer cases of the health conditions.
The goal of reducing age discrimination seems plausible
because laboratory and field research showed that nega-
tive age stereotypes and negative self-perceptions of aging
can be made significantly more positive with intervention
(Levy, 2009; Levy, Pilver, Chung, & Slade, 2014). A sys-
tematic review of interventions among students found that
88% of studies successfully reduced ageism (Chonody,
2015).
In the current study, the health condition that showed
the highest excess cost among the three predictors of age-
ism was cardiovascular disease. This is in accord with
research that found exposure to negative age stereotypes
leads to heightened cardiovascular stress among older
persons and predicts their risk of experiencing cardio-
vascular events (Levy, Hausdorff, Hencke, & Wei. 2000;
Levy et al., 2009); along with the cost of treating cardio-
vascular conditions.
Strengths of the model we used to generate the costs
and prevalence of ageism include the following: (a) bas-
ing it on ageism–health effect sizes derived from pro-
spective studies that measured ageism years before the
health outcomes; (b) adjusting for covariates, including
baseline health, age, and sex, in the studies that gener-
ated the ageism–health effect sizes, the health-outcome
costs, and the prevalence estimates; (c) removing overlap-
ping costs and overlapping prevalence estimates of the
three ageism predictors; (d) including participants from
the nationally representative HRS to generate the age-
ism–health effect sizes; and (e) incorporating the health
costs of all Americans aged 60 years or older to generate
the excess ageism costs.
Figure 1. Health care costs of age discrimination, negative age stereo-
types, and negative self-perceptions of aging in 1 year
The Gerontologist, 2020, Vol. 60, No. 1
178
6. There are a number of ways that the costs-of-ageism cal-
culations in this study are conservative. For not only are the
eight health conditions a small sampling, but within several
of the health-condition subcategories there are no ageism
studies available to draw on for the analyses (e.g., vision
impairment within noncommunicable diseases); in these
cases, models assumed no cost of ageism. Also, we did not
include the secondary costs that are associated with health
conditions, such as lost hours of employment for those with
the health conditions as well as their caregivers. Moreover,
ageism examples are found in numerous domains besides
health (Butler, 2010; Harris, Krygsman, Waschenko, &
Laliberte Rudman, 2018; Neumark, Burn, & Button, 2016;
Palmore, 2015).
Several of the predictor–outcome associations that were
found in this study have not been previously reported.
Among them are the association of age discrimination and
negative self-perceptions of aging with diabetes mellitus
and with musculoskeletal disorders.
The results of this study make a strong case for interven-
tions. A comprehensive approach would involve addressing
the societal sources of injurious images about and behaviors
toward the old. An intervention of this type would require
a large-scale campaign. Given the magnitude of the health
Table 1: Costs of Ageism on Most-Expensive Health Conditions among Older Persons in 1Yeara
Effect of Age Discrimination (AD) on Economic Costs
Cost per person ($) Prevalence (%)
Excess Cost of High
Ageism ($ billions)
High AD Low AD High AD Low AD
Cardiovascular Disease 2,901 2,700* 29.34% 27.25%* 3.527
Chronic Respiratory Disease 1,098 962* 17.06% 14.93%* 2.379
Musculoskeletal Disorders 986 864* 37.14% 32.63%* 2.131
Injuries 700 643* 21.73% 19.94%* 0.995
Diabetes Mellitus 944 889* 30.49% 28.72%* 0.960
Mental Disorders 323 270* 12.14% 10.30%* 0.928
Non-communicable Disease 1,148 1,085* 69.74% 67.91%* 1.192
Treatment of Smoking 0.40 0.32* 11.18% 8.94%* 0.001
Effect of Negative Age Stereotypes (AS) on Economic Costs
Negative AS Positive AS Negative AS Positive AS
Cardiovascular Disease 2,840 2,629* 28.68% 26.55%* 7.918
Mental Disorders 348 187* 12.76% 7.85%* 6.050
Chronic Respiratory Disease 1,052 922* 16.34% 14.30%* 4.901
Musculoskeletal Disorders 945 828* 35.61% 31.29%* 4.384
Diabetes Mellitus 935 858* 30.20% 27.73%* 2.875
Injuries 681 626* 21.13% 19.40%* 2.076
Non-communicable Disease 1,127 1,066* 69.14% 67.34%* 0.140
Treatment of Smoking 0.31 0.30* 10.39% 8.32%* .020
Effect of Negative Self-perceptions of Aging (SPA) on Economic Costs
Negative SPA Positive SPA Negative SPA Positive SPA
Cardiovascular Disease 3,235 2,284* 32.82% 22.91%* 13.003
Chronic Respiratory Disease 1,268 737* 19.71% 11.40%* 7.268
Musculoskeletal Disorders 1,139 661* 43.16% 24.76%* 6.539
Diabetes Mellitus 1,045 765* 33.76% 24.74%* 3.828
Mental Disorders 338 232* 12.58% 9.07%* 1.458
Non-communicable Disease 1,122 940* 73.56% 63.36%* 0.874
Injuries 687 632* 21.32% 19.58%* .762
Treatment of Smoking 0.38 0.31* 10.64% 8.51%* .001
a
Based on population of Americans aged 60 or older in 2013.
*These differences are significant at p < .001 after adjusting for age and sex.
The Gerontologist, 2020, Vol. 60, No. 1 179
7. care costs resulting from ageism, even if such an interven-
tion had a limited impact on ageism, its potential could be
substantial—not only financially, but also by enhancing the
lives of older persons.
Supplementary Material
Supplementary data are available at The Gerontologist online.
Funding
This research was supported by a grant from the National Institute
on Aging (U01AG032284) to Becca R. Levy.
Acknowledgements
We thank Mark Saba for his creation of the tables and figure.
Conflict of Interest
None reported.
References
Butler, R. N. (2010). The longevity revolution: The benefits and chal-
lenges of living a long life. New York: Public Affairs.
Chonody, J. M. (2015). Addressing ageism in students: A systematic
review of the pedagogical intervention research. Educational
Gerontology, 41, 859–887. doi:10.1080/03601277.2015.1059
139
Dieleman, J. L., Baral, R., Birger, M., Bui, A. L., Bulchis, A., Chapin,
A., … Murray, C. J. (2016). US spending on personal health
care and public health, 1996-2013. JAMA, 316, 2627–2646.
doi:10.1001/jama.2016.16885
Harris, K., Krygsman, S., Waschenko, J., & Laliberte Rudman, D.
(2018). Ageism and the older worker: A scoping review. The
Gerontologist, 58, e1–e14. doi:10.1093/geront/gnw194
Hehman, J. A. & Bugental, D. B. (2015). Responses to patroniz-
ing communication and factors that attenuate those responses.
Psychology and Aging, 30, 552–560. doi:10.1037/pag0000041
Horton, S., Baker, J., Pearce, G. W., & Deakin, J. M. (2008).
On the malleability of performance: Implications for sen-
iors. Journal of Applied Gerontology, 27, 446–465.
doi:10.1177/0733464808315291
Institute for Health Metrics and Evaluation (IHME). (2018).
Tracking personal health care spending in the US. Seattle, WA:
IHME, University of Washington. Retrieved from http://vizhub.
healthdata.org/dex. Accessed March 10, 2018.
Kim, D. D. & Basu, A. (2016). Estimating the medical care costs
of obesity in the United States: Systematic review, meta-anal-
ysis, and empirical analysis. Value in Health, 19, 602–613.
doi:10.1016/j.jval.2016.02.008
Kim, E. S., Moored, K. D., Giasson, H. L., & Smith, J. (2014).
Satisfaction with aging and use of preventive health ser-
vices. Preventive Medicine, 69, 176–180. doi:10.1016/j.
ypmed.2014.09.008
Lamont, R. A., Swift, H. J., & Abrams, D. (2015). A review and
meta-analysis of age-based stereotype threat: Negative stereo-
types, not facts, do the damage. Psychology and Aging, 30, 180–
193. doi:10.1037/a0038586
Lawton, M. P. (1975). The Philadelphia geriatric center morale scale:
A revision. Journal of Gerontology, 30, 85–89. doi:10.1093/
geronj/30.1.85
Lee, K., & Lee, H. (2018). Priming effects of age stereotypes
on memory of older adults in Korea. Asian Journal of Social
Psychology. Advance online publication. doi:10.1111/
ajsp.12343
Levy, B. (2009). Stereotype embodiment: A psychosocial approach
to aging. Current Directions in Psychological Science, 18, 332–
336. doi:10.1111/j.1467-8721.2009.01662.x
Levy, B. R. & Bavishi, A. (2018). Survival advantage mechanism:
Inflammation as a mediator of positive self-perceptions of
aging on longevity. Journal of Gerontology B: Psychological
Sciences and Social Sciences, 73, 409–412. doi:10.1093/
geronb/gbw035
Levy, B. R., Ferrucci, L., Zonderman, A. B., Slade, M. D., Troncoso,
J., & Resnick, S. M. (2016). A culture-brain link: Negative age
stereotypes predict Alzheimer’s disease biomarkers. Psychology
and Aging, 31, 82–88. doi:10.1037/pag0000062
Levy, B. R., Hausdorff, J. M., Hencke, R., & Wei. J. Y. (2000).
Reducing cardiovascular stress with positive self-stereotypes
of aging. Journal of Gerontology B: Psychological Science
and Social Science, 55, 205–213. doi:10.1093/geronb/55.
4.P205
Levy, B. R. & Leifheit-Limson, E. (2009). The stereotype-matching
effect: Greater influence on functioning when age stereotypes
correspond to outcomes. Psychology and Aging, 24, 230–233.
doi:10.1037/a0014563
Levy, B. R., Moffat, S., Resnick, S. M., Slade, M. D., & Ferrucci,
L. (2016). Buffer against cumulative stress: Positive age
Table 2: Number of Health-Condition Cases due to Ageism among Older Individuals, According to Model
Age Discrimination Negative Age Stereotypes Negative Self-perceptions of Aging
Cardiovascular Disease 366,365 799,617 1,355,463
Mental Disorders 322,075 1,848,253 480,521
Chronic Respiratory Disease 371,723 765,505 1,136,724
Musculoskeletal Disorders 789,516 1,625,494 2,517,869
Diabetes Mellitus 309,528 929,077 1,233,518
Injuries 311,940 650,559 238,830
Non-communicable Disease 319,758 677,614 1,395,782
Treatment of Smoking 391,360 782,590 291,167
The Gerontologist, 2020, Vol. 60, No. 1
180
8. self-stereotypes predict lower cortisol across 30 years. Journal
of Gerontopsychology and Geriatric Psychiatry, 29, 141–146.
doi:10.1024/1662–9647/a000149
Levy, B. R. & Myers, L. M. (2004). Preventive health behaviors
influenced by self-perceptions of aging. Preventive Medicine, 39,
625–629. doi:10.1016/j.ypmed.2004.02.029
Levy, B. R., Pilver, C., Chung, P. H., & Slade, M. D. (2014).
Subliminal strengthening: Improving older individuals’
physical function over time with an implicit-age-stereo-
type intervention. Psychological Science, 25, 2127–2135.
doi:10.1177/0956797614551970
Levy, B. R., Slade, M. D., Chung, P. H., & Gill, T. M. (2015).
Resiliency over time of elders’ age stereotypes after encounter-
ing stressful events. Journal of Gerontology B: Psychological
Sciences and Social Sciences, 70, 886–890. doi:10.1093/geronb/
gbu082
Levy, B. R., Slade, M. D., & Kasl, S. V. (2002). Longitudinal benefit
of positive self-perceptions of aging on functional health. Journal
of Gerontology B: Psychological Science and Social Science, 57,
409–417. doi:10.1093/geronb/57.5.P409
Levy, B. R., Slade, M. D., Pietrzak, R. H., & Ferrucci, L. (2018).
Positive age beliefs protect against dementia even among elders
with high-risk gene. PLoS One, 13, e0191004. doi:10.1371/
journal.pone.0191004
Levy, B. R., Zonderman, A. B., Slade, M. D., & Ferrucci, L.
(2009). Age stereotypes held earlier in life predict cardiovas-
cular events in later life. Psychological Science, 20, 296–298.
doi:10.1111/j.1467-9280.2009.02298.x
Liang, J. & Bollen, K. A. (1983). The structure of the Philadelphia
geriatric center morale scale: A reinterpretation. Journal of
Gerontology, 38, 181–189. doi:10.1093/geronj/38.2.181
Marchiondo, L. A., Gonzales, E., & Williams, L. J. (2017).
Trajectories of perceived workplace age discrimination and
long-term associations with mental, self-rated, and occupa-
tional health. [Epub ahead of print]. Journal of Gerontology B:
Psychological Sciences and Social Sciences. doi:10.1093/geronb/
gbx095
Markus, H. (1977). Self-schemata and processing information about
the self. Journal of Personality and Social Psychology, 35, 63–78.
doi:10.1037/0022-3514.35.2.63
Meisner, B. A. (2012). A meta-analysis of positive and negative age
stereotype priming effects on behavior among older adults.
Journal of Gerontology B: Psychological Sciences and Social
Sciences, 67, 13–17. doi:10.1093/geronb/gbr062
Moher, D., Liberati, A., Tetzlaff, J., Altman, D. G., & the
PRISMA Group. (2009). Preferred reporting items for sys-
tematic reviews and meta-analyses: The PRISMA state-
ment. Annals of Internal Medicine, 151, 264–269, W64.
doi:10.7326/0003-4819-151-4-200908180-00135
Neuman, P. J., Sanders, G. D., Russell, L. B., Siegel, J. E., & Ganiats,
T. G. (Eds.). (2016). Cost effectiveness in health and medicine.
New York, NY: Oxford University Press.
Neumark, D. A., Burn, I., & Button, P. (2016). Experimental
age discrimination evidence and the Heckman critique.
American Economic Review, 106, 303–308. doi:10.1257/aer.
p20161008
Organisation for Economic Co-operation and Development (2017).
Health at a glance 2017: OECD indicators. Paris: OECD
Publishing. doi:10.1787/health_glance-2017-en
Palmore, E. (2015). Ageism comes of age. Journal of Gerontology
B: Psychological Sciences and Social Sciences, 70, 873–875.
doi:10.1093/geronb/gbv079
Petersen, L. E., Stahlberg, D., & Dauenheimer, D. (2000). Effects
of self-schema elaboration on affective and cognitive reac-
tions to self-relevant information. Genetic, Social, and General
Psychology Monographs, 126, 25–42.
Sargent-Cox, K. A., Anstey, K. J., & Luszcz, M. A. (2012). The re-
lationship between change in self-perceptions of aging and
physical functioning in older adults. Psychology and Aging, 27,
750–760. doi:10.1037/a0027578
Sarkisian, C. A., Steers, W. N., Hays, R. D., & Mangione, C. M.
(2005). Development of the 12-item expectations regarding
aging survey. The Gerontologist, 45, 240–248. doi:10.1093/
geront/45.2.240
Sonnega, A. & Weir, D. R. (2014). The Health and Retirement Study:
A public data resource for research on aging. Open Health Data,
2, e7. doi:10.5334/ohd.am
Tsai, A. G., Williamson, D. F., & Glick, H. A. (2011). Direct med-
ical cost of overweight and obesity in the USA: A quan-
titative systematic review. Obesity Reviews, 12, 50–61.
doi:10.1111/j.1467-789X.2009.00708.x
United Nations (2012). General assembly resolution 67/139,
Towards a comprehensive and integral international legal instru-
ment to promote and protect the rights and dignity of older per-
sons, A/RES/67/139. Retrieved from undocs.org/A/RES/67/139.
Accessed May 15, 2017.
United Nations. (2014). Open-ended working group on ageing, US
statement, delivered by Kathy Greenlee: Existing international
framework on the human rights of older persons and identifi-
cation of existing gaps at the international level. Retrieved from
https://social.un.org/ageing-working-group/documents/fifth/
United%20States.pdf. Accessed May 15, 2018.
United Nations. (2017). Open-ended working group on aging, US
statement, delivered by Mr. Martin Garcia Moritan. Retrieved
from https://social.un.org/ageing-working-group/documents/
eighth/Inputs%20Member%20States/UnitedStates.pdf.
Accessed May 15, 2018.
Westerhof, G. J., Miche, M., Brothers, A. F., Barrett, A. E., Diehl, M.,
Montepare, J. M., … Wurm, S. (2014). The influence of sub-
jective aging on health and longevity: A meta-analysis of longi-
tudinal data. Psychology and Aging, 29, 793–802. doi:10.1037/
a0038016
Williams, D. R., Yu, Y., Jackson, J. S., & Anderson, N. B. (1997).
Racial differences in physical and mental health: Socio-economic
status, stress and discrimination. Journal of Health Psychology,
2, 335–351. doi:10.1177/135910539700200305
Wurm, S., Tesch-Römer, C., & Tomasik, M. J. (2007). Longitudinal
findings on aging-related cognitions, control beliefs, and
health in later life. Journal of Gerontology B: Psychological
Sciences and Social Sciences, 62, P156–P164. doi:10.1093/
geronb/62.3.P156
The Gerontologist, 2020, Vol. 60, No. 1 181