Charts
•Download as DOCX, PDF•
0 likes•404 views


Recommended
Recommended
More Related Content
Viewers also liked
Viewers also liked (10)
Similar to Charts
Similar to Charts (20)
More from Florida Blue Ribbon Task Force on State Higher Education Reform
More from Florida Blue Ribbon Task Force on State Higher Education Reform (20)
Charts
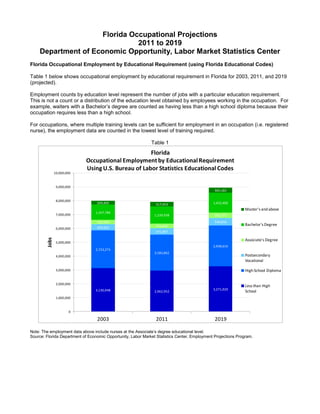
- 1. Florida Occupational Projections 2011 to 2019 Department of Economic Opportunity, Labor Market Statistics Center Florida Occupational Employment by Educational Requirement (using Florida Educational Codes) Table 1 below shows occupational employment by educational requirement in Florida for 2003, 2011, and 2019 (projected). Employment counts by education level represent the number of jobs with a particular education requirement. This is not a count or a distribution of the education level obtained by employees working in the occupation. For example, waiters with a Bachelor’s degree are counted as having less than a high school diploma because their occupation requires less than a high school. For occupations, where multiple training levels can be sufficient for employment in an occupation (i.e. registered nurse), the employment data are counted in the lowest level of training required. Table 1 Florida Occupational Employment by Educational Requirement Using U.S. Bureau of Labor Statistics Educational Codes 10,000,000 9,000,000 365,181 8,000,000 269,405 317,453 1,422,400 Master's and above 1,107,789 7,000,000 1,239,938 392,377 292,940 548,856 333,646 Bachelor's Degree 6,000,000 463,562 475,897 Jobs Associate's Degree 5,000,000 2,938,616 2,723,273 2,583,862 4,000,000 Postsecondary Vocational 3,000,000 High School Diploma 2,000,000 Less than High 3,130,948 3,271,020 2,962,952 School 1,000,000 0 2003 2011 2019 Note: The employment data above include nurses at the Associate’s degree educational level. Source: Florida Department of Economic Opportunity, Labor Market Statistics Center, Employment Projections Program.
- 2. Florida Occupational Employment by Educational Requirement (using U.S. Bureau of Labor Statistics Educational Codes) Table 2 below shows the same occupational employment from table 1 in Florida for 2003, 2011, and 2019 (projected). However, this table assigns an educational code to each occupation using the U.S. Bureau of Labor Statistics methodology (BLS). BLS also assigns educational codes based on the typical entry-level education required for the occupation, even though the actual distribution of workers by educational attainment shows workers with other levels of achievement. Table 2 Florida Occupational Employment by Educational Requirement Using U.S. Bureau of Labor Statistics Educational Codes 10,000,000 9,000,000 365,181 8,000,000 269,405 317,453 1,608,371 Master's and above 7,000,000 1,238,092 1,396,426 206,406 162,637 548,856 Bachelor's Degree 6,000,000 463,562 177,158 475,897 Jobs Associate's Degree 5,000,000 2,938,616 2,723,273 2,583,862 4,000,000 Postsecondary Vocational 3,000,000 High School Diploma 2,000,000 Less than High 3,130,948 3,271,020 2,962,952 School 1,000,000 0 2003 2011 2019 Note: The employment data above include nurses at the Associate’s degree educational level. Source: Florida Department of Economic Opportunity, Labor Market Statistics Center, Employment Projections Program.
- 3. Production of Bachelor’s Degrees vs. Job Openings Requiring a Bachelor’s Degree The production of Bachelor’s degrees below uses two methods for calculating growth. The first method uses historical growth rates of bachelor’s degree production and extrapolates the same rate for future periods through 2019. The second method uses the target set by SUS of achieving 90,000 by 2025 and assumes a gradual increase of Bachelor’s degree production throughout this period. Thus, the analysis assumes approximately 75,000 Bachelor’s degrees will be produced in 2019. The representation of job openings requiring a Bachelor’s degree also uses two approaches. The first approach estimates job openings requiring this degree using Florida educational codes. These codes were developed with the Florida Department of Education. The second approach uses education codes used by the U.S. Bureau of Labor Statistics. Tables 3 and 4 below show Bachelor’s degree production vs. job openings from growth and replacement need. Both show cumulative growth between 2011 and 2019. Table 3 uses Florida educational codes, while table 4 uses federal educational codes. Both tables show different estimates based on whether job openings include registered nurses as requiring a Bachelor’s degree or as requiring only an Associate’s degree to enter the profession. Table 3 Florida Production of Bachelor's Degrees vs. Job Openings Requiring a Bachelor's Cumulative Growth 2011-2019 (FL Education Codes) 700000 590,352 600000 566,423 500000 400000 301,536 300000 251,073 200000 100000 0 Bachelor's Bachelor's Job openings Job openings production production requiring a requiring a (assuming (planned increase Bachelor's (RNs as Bachelor's (RNs as historical growth to 90,000 in 2025) Bachelor's) Associate's) rate continues) Tables 4 below show the same data as above using BLS codes instead of FL educational codes. Table 4 Florida Production of Bachelor's Degrees vs. Job Openings Requiring a Bachelor's Cumulative Growth 2011-2019 (BLS Education Codes) 700,000 590,352 600,000 566,423 500,000 438,489 388,134 400,000 300,000 200,000 100,000 0 Bachelor's Bachelor's Job openings Job openings production production requiring a requiring a (assuming (planned increase Bachelor's (RNs as Bachelor's (RNs as historical growth to 90,000 in 2025) Bachelor's) Associate's) rate continues)
- 4. Cost of Tuition vs. Inflation Tuition cost per credit hour is calculated as a weighted average of the total tuition and fees for 30 semester credit hours per year for each university, weighted by university undergraduate enrollment. Table 5 Florida Tuition Cost Per Credit Hour Growth Rate vs. Inflation (South Region, U.S.) 16.0 14.0 Tuition and Fees Growth Rate (Annual Percent Change of Tuition and Fees per Credit Hour) Inflation (Percent Change in Consumer Price Index-Urban, South Region) 12.0 10.0 8.0 Percent 6.0 4.0 2.0 0.0 -2.0 1991 1992 1993 1994 1995 1996 1997 1998 1999 2000 2001 2002 2003 2004 2005 2006 2007 2008 2009 2010 2011 Sources: State University System of Florida, Board of Governors data, Local Fee History and Enrollment by University, www.flbog.edu. U.S. Department of Labor, Bureau of Labor Statistics, Consumer Price Index, www.bls.gov. Prepared August 2012