Question 5The financial statements of The Hershey Company and .docx
Revisedstatements
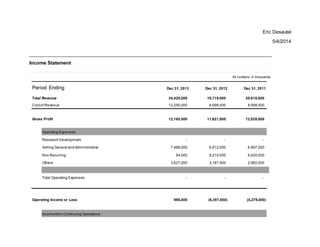
1. Eric Desautel
5/4/2014
Income Statement
All numbers in thousands
Period Ending Dec 31, 2013 Dec 31, 2012 Dec 31, 2011
Total Revenue 24,420,000 19,719,000 20,618,000
Costof Revenue 12,255,000 8,098,000 8,598,000
Gross Profit 12,165,000 11,621,000 12,020,000
Operating Expenses
Research Development - - -
Selling General and Administrative 7,488,000 6,612,000 6,897,000
Non Recurring 54,000 8,219,000 6,420,000
Others 3,627,000 3,187,000 2,982,000
Total Operating Expenses - - -
Operating Income or Loss 996,000 (6,397,000) (4,279,000)
Income from Continuing Operations
2. Total Other Income/Expenses Net 278,000 72,000 15,000
Earnings Before InterestAnd Taxes 1,274,000 (6,325,000) (4,264,000)
InterestExpense 1,223,000 661,000 670,000
Income Before Tax 51,000 (6,986,000) (4,934,000)
Income Tax Expense 16,000 350,000 (216,000)
Minority Interest - - -
Net Income From Continuing Ops 35,000 (7,336,000) (4,718,000)
Non-recurring Events
Discontinued Operations - - -
Extraordinary Items - - -
Effect Of Accounting Changes - - -
Other Items - - -
Net Income 35,000 (7,336,000) (4,718,000)
Preferred Stock And Other Adjustments - - -
Net Income Applicable To Common Shares 35,000 (7,336,000) (4,718,000)
3. Balance Sheet
Period Ending
Dec 31, 2013 Dec 31, 2012 Dec 31, 2011
Assets
CurrentAssets
Cash And Cash Equivalents 5,891,000 394,000 1,943,282
Short Term Investments - - 299,972
Net Receivables 4,499,000 4,015,000 85,237
Inventory 586,000 457,000 239,648
Other Current Assets 1,252,000 675,000 175,454
Total Current Assets 12,228,000 5,541,000 2,743,593
Long Term Investments - - 6,319
Property Plantand Equipment 15,349,000 12,807,000 4,017,999
Goodwill 1,683,000 - -
Intangible Assets 19,326,000 14,629,000 2,539,041
Accumulated Amortization - - -
Other Assets 1,367,000 645,000 175,979
Deferred Long Term Asset Charges - - -
Total Assets 49,953,000 33,622,000 9,482,931
Liabilities
4. CurrentLiabilities
Accounts Payable 4,766,000 5,094,000 512,346
Short/CurrentLong Term Debt 244,000 - 33,460
Other Current Liabilities 798,000 498,000 270,917
Total Current Liabilities 5,808,000 5,592,000 816,723
Long Term Debt 16,841,000 2,461,000 4,711,021
Other Liabilities 6,301,000 13,952,000 90,453
Deferred Long Term Liability Charges 6,758,000 5,502,000 937,134
Minority Interest - - -
Negative Goodwill - - -
Total Liabilities 35,708,000 27,507,000 6,555,331
Stockholders' Equity
Misc Stocks Options Warrants - - -
Redeemable Preferred Stock - - -
Preferred Stock - - -
Common Stock - - 36
Retained Earnings (23,088,000) (23,123,000) 1,159,418
Treasury Stock - - (6,832)
Capital Surplus 37,330,000 29,197,000 1,784,273
Other Stockholder Equity 3,000 41,000 (9,295)
Total Stockholder Equity 14,245,000 6,115,000 2,927,600
5. Net Tangible Assets (6,764,000) (8,514,000) 388,559
Cash Flow
All numbers in thousands
Period Ending Dec 31, 2013 Dec 31, 2012 Dec 31, 2011
Net Income 35,000 (7,336,000) (4,718,000)
Operating Activities, Cash Flows Provided By or Used In
Depreciation 3,565,000 3,106,000 2,898,000
Adjustments To Net Income 1,011,000 9,092,000 7,075,000
Changes In Accounts Receivables (1,315,000) (700,000) (558,000)
Changes In Liabilities 752,000 18,000 299,000
Changes In Inventories 42,000 (2,000) 166,000
Changes In Other Operating Activities (545,000) (316,000) (182,000)
Total Cash Flow From Operating Activities 3,545,000 3,862,000 4,980,000
Investing Activities, Cash Flows Provided By or Used In
Capital Expenditures (4,025,000) (2,901,000) (2,729,000)
Investments 267,000 (673,000) (2,022,000)
Other Cash flows from Investing Activities 1,666,000 (341,000) 52,000
Total Cash Flows From Investing Activities (2,092,000) (3,915,000) (4,699,000)
Financing Activities, Cash Flows Provided By or Used In
6. Dividends Paid (41,000) (2,403,000) -
Sale Purchase of Stock 1,924,000 - -
Net Borrowings 2,250,000 2,469,000 -
Other Cash Flows from Financing Activities (89,000) (9,000) -
Total Cash Flows From Financing Activities 4,044,000 57,000 -
Effect Of Exchange Rate Changes - - -
Change In Cash and Cash Equivalents 5,497,000 4,000 281,000