The Centre of Performance Infographic
•
0 likes•444 views

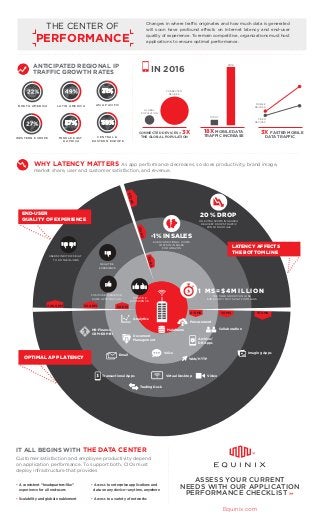
This infographic looks at why latency matters and how Equinix can help you assess your current application needs.
Report
Share
Report
Share
Download to read offline
Recommended
Recommended
More Related Content
Recently uploaded
Recently uploaded (20)
Discovering OfficialUSA.com Your Go-To Resource.pdf
Discovering OfficialUSA.com Your Go-To Resource.pdf
SOC Analyst Guide For Beginners SOC analysts work as members of a managed sec...
SOC Analyst Guide For Beginners SOC analysts work as members of a managed sec...
100^%)( POLOKWANE))(*((+27838792658))*))௹ )Abortion Pills for Sale in Sibasa,...
100^%)( POLOKWANE))(*((+27838792658))*))௹ )Abortion Pills for Sale in Sibasa,...
The Rise of Subscription-Based Digital Services.pdf
The Rise of Subscription-Based Digital Services.pdf
APNIC Policy Roundup presented by Sunny Chendi at TWNOG 5.0
APNIC Policy Roundup presented by Sunny Chendi at TWNOG 5.0
TORTOGEL TELAH MENJADI SALAH SATU PLATFORM PERMAINAN PALING FAVORIT.
TORTOGEL TELAH MENJADI SALAH SATU PLATFORM PERMAINAN PALING FAVORIT.
TOP 100 Vulnerabilities Step-by-Step Guide Handbook
TOP 100 Vulnerabilities Step-by-Step Guide Handbook
Featured
Featured (20)
Product Design Trends in 2024 | Teenage Engineerings
Product Design Trends in 2024 | Teenage Engineerings
How Race, Age and Gender Shape Attitudes Towards Mental Health
How Race, Age and Gender Shape Attitudes Towards Mental Health
AI Trends in Creative Operations 2024 by Artwork Flow.pdf
AI Trends in Creative Operations 2024 by Artwork Flow.pdf
Content Methodology: A Best Practices Report (Webinar)
Content Methodology: A Best Practices Report (Webinar)
How to Prepare For a Successful Job Search for 2024
How to Prepare For a Successful Job Search for 2024
Social Media Marketing Trends 2024 // The Global Indie Insights
Social Media Marketing Trends 2024 // The Global Indie Insights
Trends In Paid Search: Navigating The Digital Landscape In 2024
Trends In Paid Search: Navigating The Digital Landscape In 2024
5 Public speaking tips from TED - Visualized summary
5 Public speaking tips from TED - Visualized summary
Google's Just Not That Into You: Understanding Core Updates & Search Intent
Google's Just Not That Into You: Understanding Core Updates & Search Intent
The six step guide to practical project management
The six step guide to practical project management
Beginners Guide to TikTok for Search - Rachel Pearson - We are Tilt __ Bright...
Beginners Guide to TikTok for Search - Rachel Pearson - We are Tilt __ Bright...
The Centre of Performance Infographic
- 1. ANTICIPATED REGIONAL IP TRAFFIC GROWTH RATES NORTH AMERICA WESTERN EUROPE MIDDLE EAST & AFRICA CENTRAL & EASTERN EUROPE ASIA PACIFICLATIN AMERICA USERS FIND IT DIFFICULT TO DO THEIR JOBS NEGATIVE EXPERIENCE AN EXTRA 500MS IN SEARCH DELIVERY DROPS TRAFFIC 20% FOR GOOGLE EVERY ADDITIONAL 100 MS COSTS 1% IN SALES FOR AMAZON HR-Finance CRM-ERP-BI Transactional Apps Voice Video Email Collaboration Document Management Archive/ DR Apps POSITIVE EXPERIENCE; SOME APPS MAY LAG Analytics POSITIVE EXPERIENCE THE TABB GROUP CAN LOSE $4M EVERY 1 MS ITS PLATFORM LAGS OPTIMAL APP LATENCY END-USER QUALITY OF EXPERIENCE LATENCY AFFECTS THE BOTTOM LINE Procurement Web/HTTP 2,000 KM 500 KM 50 KM 500MS 100MS 50MS -1% INSALES 20% DROP 1 MS=$ 4MIL L IO N 0-5 MS 50 MS 100 MS Equinix.com Changes in where traffic originates and how much data is generated will soon have profound effects on Internet latency and end-user quality of experience. To remain competitive, organizations must host applications to ensure optimal performance. ASSESS YOUR CURRENT NEEDS WITH OUR APPLICATION PERFORMANCE CHECKLIST >> IT ALL BEGINS WITH THE DATA CENTER Customer satisfaction and employee productivity depend on application performance. To support both, CIOs must deploy infrastructure that provides: WHY LATENCY MATTERS As app performance decreases, so does productivity, brand image, market share, user and customer satisfaction, and revenue. THE CENTER OF PERFORMANCE • A consistent “headquarters-like” experience for all end-users • Scalability and global enablement • Access to enterprise applications and data on any device—anytime, anywhere • Access to a variety of networks Mainframe Virtual Desktop Imaging Apps Trading Desk IN 2016 CONNECTED DEVICES = 3X THE GLOBAL POPULATION 18X MOBILE DATA TRAFFIC INCREASE 3X FASTER MOBILE DATA TRAFFIC MOBILE DEVICES FIXED DEVICES TODAY 2016 CONNECTED DEVICES GLOBAL POPULATION