Recommended

Recommended
More Related Content
Similar to Use of a Weather Generator for analysis of projections of future daily temperature and its validation with climate change indices Annalisa Di Piazza , Emanuele Cordano , Emanuele Eccel
Similar to Use of a Weather Generator for analysis of projections of future daily temperature and its validation with climate change indices Annalisa Di Piazza , Emanuele Cordano , Emanuele Eccel (20)
More from Emanuele Cordano
More from Emanuele Cordano (6)
Recently uploaded
Recently uploaded (20)
Use of a Weather Generator for analysis of projections of future daily temperature and its validation with climate change indices Annalisa Di Piazza , Emanuele Cordano , Emanuele Eccel
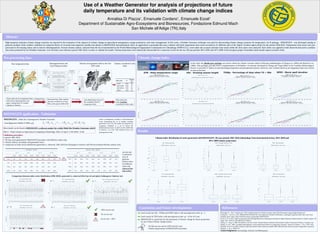
- 1. Use of a Weather Generator for analysis of projections of future daily temperature and its validation with climate change indices Annalisa Di Piazza , Emanuele Cordano , Emanuele Eccel 1 1 1 Department of Sustainable Agro-Ecosystems and Bioresources, Fondazione Edmund Mach San Michele all'Adige (TN),Italy Abstract High temporal resolution climate change scenarios are required in the evaluation of the impacts of climate change on agricultural management, energy production, and water management. In this work, a Weather Generator technique was used for downscaling climate change scenarios for temperature. An R package - RMAWGEN - was developed aiming to generate synthetic daily weather conditions by using the theory of vectorial auto-regressive models (see details in RMAWGEN documentation). Here, an application is presented that uses a dataset with daily temperature time series recorded at 41 different sites of the Alpine Trentino region (Italy) for the period 1958-2010. Temperature time series were pre- processed to fill missing values and to remove inhomogeneities. Several climatic indices, selected from the list recommended by the World Meteorological Organization Commission for Climatology (WMO-CCL), were taken into account and their time trends within the time series were analyzed. Each index was applied to both observed data and to synthetic time series produced by the Weather Generator, over the thirty year reference period 1981-2010, in order to validate the model. Climate projections were statistically downscaled for a selection of sites for the two 30-year periods 2021-2050 and 2071-2099 of the European project Ensembles multi-model output (scenario A1B). Pre-processing data Climatic change index Raw temperature data Homogenenization and Patterns of temperature field as the first Stations considered in this In this study the climdex.pcic package was used to obtain the climatic extremes indices following methodologies of Zhang et al. (2005) and Haylock et al. Gap Filling procedure EOF mode study (2006). This packages provides PCIC's implementation of RClimdex 1.0 software developed by Zhang and Yang (2004) at the Canadian Meteorological Service. It provides 27 indices in total (including temperature and precipitation indices). However, only 4 indices based on air temperature data were chosen for discussion here: DTR - Daily temperature range GSL - Growing season length TX90p - Percentage of days when TX < 90p WSDI - Warm spell duration Time series of raw temperature data, Homogenenization - Processed data. Only stations PCA analysis Gap Filling procedure map identifying 4 areas of Data reduction: affected by inhomogenities and that have worked for at least the variability field of only 4 stations gaps, coming from 41 weather 90% of the period 1958-2010 temperature data considered in this study stations in Trentino RMAWGEN application - Validation RMAWGEN – Multi-Site Autoregressive Weather Generator where xt (endogenous variable) is a K-dimensional vector representing the set of weather variables Auto-Regressive Model (VAR(K, p)): x t =A1⋅x t−1 +…+A p⋅x t− p +C⋅d t +u t generated at day t by the model, dt (composed by exogenous variables) is a set of known K- More details can be found at RMAWGEN: a software project for a daily Multi-Site Weather Generator with R dimensional processes, A and C are the coefficients of matrices, ut is the VAR residual and p is the HS3.3 – Poster session on Open Source Computing in Hydrology /Wed, 25 April, 17:30-19:00 / A138 autoregression order Results Validation procedure: period: 1981-2010; Climate index distribution of series generated with RMAWGEN: 30-year periods 1981-2010 (climatology from instrumental series), 2021-2050 and 30 time series generated by RMAWGEN procedure with different values of p; 2071-2099 (climate projections) climatic indices calculation with generated series; Discussion and results comparison of index series distribution (generated vs. observed, 1981-2010) by Kolmogorov-Smirnov and Wilcoxon-Mann-Whitney statistic tests. success rate to statistical tests of generate indices series for different value of p (autocorrela- tion order) Comparison between index series distribution (1981-2010): generated vs. observed (first bar of each plot). Kolmogorov-Smirnov test p=1 p=1 p=1 p = 10 p=1 100% success rate Conclusion and Future developments References Good results for GSL, TX90p and WSDI indices with autoregression order p = 1; Bronaugh, D., 2011. climdex.pcic: PCIC implementation of Climdex routines. http://CRAN.R-project.org/package/climdex.pcic 0% success rate Cordano E., Eccel, E., 2011. RMAWGEN (R Multi-site Auto-regressive Weather GENerator): a package to generate daily time series from Good results for DTR index with autoregression order p = 10 for K-S test; monthly mean values. http://CRAN.R-project.org/package=RMAWGEN success rate < 100% RMAWGEN is a good tool for the assessment of climatic change for future projections Eccel, E. et al. 2012. Data reconstruction and homogenization for reducing uncertainties in high-resolution climate analysis in Alpine regions. Th. Appl. Clim., DOI 10.1007/s00704-012-0624-z by use of these climatic change indices . Zhang, X., Yang, F.,2004. RClimDex (1.0) User Guide. Climate Research Branch Environment Canada. Downsview (Ontario, Canada), 22p Zhang, X. et al., 2005. Avoiding inhomogeneity in percentile-based indices of temperature extremes. Journal of Climate, v. 18, p. 1641–1651 No full success rate for DTR with K-S test; Haylock, M. R. et al, 2006. Trends in total and extreme South American rainfall 1960-2000 and links with sea surface temperature. Journal of Further improvement of RMAWGEN procedure. Climate, v. 19, p. 1490-1512 Acknowledgements: Envirochange, ACESAP, CLITRE50 projects