1. High fire
frequency
High fire
frequency
High fire
frequency
Low fire
frequency
Moderate
fire
frequency
Low fire
frequency
Variable fire
frequency
Elizabeth Freeman and Rebecca Teed
Department of Earth & Environmental Science, Wright State University
Observing Patterns in Pittsburg Basin, Illinois, Pollen Data
Using Detrended Correspondence Analysis
Acknowledgements:
A very special thank you to Dr. Schmidt & Dr. Bennett
Upcoming & Ongoing Research
• Increase charcoal counts to decrease error.
• Conduct variation and confidence interval analysis.
• Use understanding of modern plant taxon ranges to understand what
eigenvector one indicates about the climate.
Introduction
• Pittsburg Basin, central Illinois, contains a long pollen record, which
includes assemblages indicating a period as warm as the present last
interglacial ; dating back at least 130,000 years.(Teed,2000)
• Detrended Correspondence Analysis (DCA) was used to summarize the
pollen data in order to analyze relationships among climate, vegetation,
and fire frequency.
Results & Discussion
• Ecological forces like summer temperatures drive vegetation
changes which are summarized into vectors.
• 82.5% of the variation in the Pittsburg Basin data for pollen taxa
which make up at least 2% of the main sum for at least one level is
accounted for by eigenvectors 1 and 2.
• 53.7% of the variation is explained by the first eigenvector
• 28.8% of the variation is accounted for by the second
eigenvector.
• The first eigenvector separates boreal taxa from temperate trees.
Undergrad student,
Elizabeth Freeman,
using the point-count
method to measure
charcoal concentrations.
References
• Bennett, K.D. 1994. ‘Psimpoll’ version 2.23: A C program for analyzing pollen data
and plotting diagrams. INQUA Commission for the Study of the Holocene: Working
Group on Data-Handling Methods, Newsletter 11, 4-6.
• Clark, J.S., and T.C. Hussey. 1996. Estimating the mass flux of charcoal from
sedimentary records: effects of particle size, morphology, and orientation. The
Holocene 6: 129-144.
• Clark, R.L. 1982: Point count estimation of charcoal in pollen preparations and thin
sections of sediments. Pollen et Spores 24, 523–535.
• Hill, M.O. and Gauch, H.G. 1980. Detrended Correspondence Analysis: An
Improved Ordination Technique. Vegetatio 42, 47–58.
• Teed, R. 2000. A > 130,000-Year-Long Pollen Record from Pittsburg Basin, Illinois."
Quaternary Research 542 : 264-274.
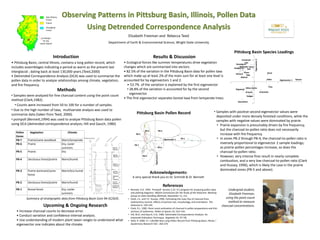
Eigenvector2
Eigenvector 1
Pittsburg Basin Pollen Record2
-2
-1 1 2 3
PB-5
PB-6
PB-2
PB-1
PB-4
PB-7
PB-3
-2.5
-2
-1.5
-1
-0.5
0
0.5
1
1.5
2
2.5
3
-2 -1 0 1 2 3 4
Eigenvector2
Eigenvector 1
Pittsburg Basin Species Loadings
Spruce
Artemisia
Pine
Birch
Alder
Oak
Goosefoot
Hickory
Walnut
Hackberry
Elm
Ash
Plane
Ironwood
Sweetgum
Redcedar Hazel
Grasses
Other Herbs
Ragweed
Sedges
Methods
• Samples were analyzed for fine charcoal content using the point count
method (Clark,1982).
• Counts were increased from 50 to 100 for a number of samples.
• Due to the high number of taxa, multivariate analysis was used to
summarize data (taken from Teed, 2000).
• psimpoll (Bennett,1994) was used to analyze Pittsburg Basin data pollen
using DCA (detrended correspondence analysis; Hill and Gauch, 1980)
Pollen
Zones
Vegetation Climate
PB-7 Prairie/some woodland Warm/temperate
PB-6 Prairie Dry, cooler
summers
PB-5 Prairie Dry
PB-4 Deciduous forest/prairie Warm/humid
PB-3 Prairie dominant/some
forest
Warm/less humid
PB-2 Deciduous forest/prairie Warm/humid
PB-1 Boreal forest Dry, cooler
summers
Summary of stratigraphic data from Pittsburg Basin Core 94-5C/D/G.
• Samples with positive second eigenvector values were
deposited under more densely forested conditions, while the
samples with negative values were dominated by prairie.
• Prairie expansion is presumably driven by fire frequency,
but the charcoal-to-pollen ratio does not necessarily
increase with fire frequency.
• In zones PB-2 through PB-4, the charcoal-to-pollen ratio is
inversely proportional to eigenvector 2 sample loadings;
as prairie-pollen percentages increase, so does the
charcoal-to-pollen ratio.
• However, very intense fires result in nearly complete
combustion, and a very low charcoal-to-pollen ratio (Clark
and Hussey, 1996), which is likely the case in the prairie
dominated zones (PB-5 and above).
Ice Margin
for the
Latest Glacial
Prairie
Oak-Hickory
Forest
Floodplain
Forest