An Empirical Study to Investigate the Reasons for the Increase in the Household Debt Level in Canada
1. 1
An Empirical Study to Investigate the Reasons for the Increase in the Household Debt Level in Canada
Abstract
This Paper investigates the factors that affect household debt level in Canada by employing the
Multiple Linear Regression Model. Based on the results, GDP growth rate and the housing price index
have a positive relation with the level of household debt in Canada while the unemployment rate,
Inflation rate and Interest rate negatively affect the household debt level. Among these variables, the
unemployment rate and interest rate are significantly effective on the debt level while other factors seem
to have less significant contribution in determining the household debt level in Canada. By looking at the
experience of the 2007-08 financial crisis, we find how important and at the same time dangerous
household debt level can be for the financial sector and the whole economy. This implies that it would be
more logical for policy makers and financial corporates to have a more controlling role on the household
debt level by choosing timely and reasonable monetary policies, and being more observant over financial
markets while the economy is experiencing its upward trend.
1. Introduction
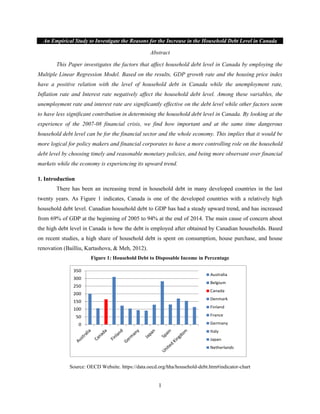
There has been an increasing trend in household debt in many developed countries in the last
twenty years. As Figure 1 indicates, Canada is one of the developed countries with a relatively high
household debt level. Canadian household debt to GDP has had a steady upward trend, and has increased
from 69% of GDP at the beginning of 2005 to 94% at the end of 2014. The main cause of concern about
the high debt level in Canada is how the debt is employed after obtained by Canadian households. Based
on recent studies, a high share of household debt is spent on consumption, house purchase, and house
renovation (Bailliu, Kartashova, & Meh, 2012).
Figure 1: Household Debt to Disposable Income in Percentage
0
50
100
150
200
250
300
350
Australia
Belgium
Canada
Denmark
Finland
France
Germany
Italy
Japan
Netherlands
Source: OECD Website. https://data.oecd.org/hha/household-debt.htm#indicator-chart
2. 2
Although borrowing increases the welfare of the households, and keeps the level of consumption
on a stable trend, there is a dark side to a high level of household debt. We should notice that the stability
of the financial system depends on the ability of households to make their debt payments if any sudden
economic shocks happen. High debt level makes households more vulnerable to the adverse economic
shocks such as unemployment shock or a negative shock to house prices. In the event of default on
household debts due to any sudden shock, there is the concern that Canadian households would be unable
to make their payments on a regular basis. In the worst scenario, the spread of debt defaults would cause
dangerous consequences to the financial sector and the whole economy. The experience of the 2008
financial crisis enlightened economists about the danger of systemic risk, which is defined as the risk
which starts from one sector of the economy and contaminates other sectors consequently. Although the
Canadian economy went mostly safely through the financial crisis, the soundness of households’ finances
is an important factor in determining Canada’s economic and financial well-being. In order to prevent the
same crisis that happened to the United States and many other developed economies, it is essential to
recognize the determinants of increase in Canadian household debt level.
The remainder of the paper includes the following parts. In section 2, previous studies about
household debt in Canada, household debt in some other countries and the contributors to the increase in
debt level in those countries will be reviewed. Section 3 discusses the dataset characteristics. Section 4
shows the model and methodology, and discusses the findings based on statistical tests and estimates on
the model. Section 5 analyzes the results and findings of the model. Finally, in section 6, I will make a
conclusion based on empirical study findings, and give some suggestions to face the problem of high
household debt in Canada.
2. Literature Review
The increasing trend of household debt has been under more scrutiny since twenty years ago, and
there are few studies conducted on this topic before 1990. As was mentioned in the introduction, the
increasing trend of household debt is a phenomenon that has been happening in many economies around
the world. Therefore, in the last twenty years, a considerable number of papers and academic articles have
been published in different countries on the household debt issue and its determinants.
An empirical study about Australian household debt and its determinants used quarterly time
series data from 1988Q2 to 2011Q2 (Meng, Hoang, & Siriwardana, 2013). They collected their data
mainly from the Australian Bureau of Statistics, and the Reserve Bank of Australia. They concluded that
housing price, GDP and the population have a positive relation with the level of household borrowing. On
the other hand, increase in interest rates, number of new dwellings and inflation have a negative impact
3. 3
on Australian household debt level. Of these, they showed that the interest rate was the most significant
determinant of debt level. In South Africa, Christelle Meniago and Janine Mukuddem-Petersen
investigated the prominent factors contributing to the rise in the level of household debt (Meniago &
Mukuddem-Petersen, 2013). In their research, they constructed a model for South Africa household debt
through applying the Vector Error Correction Model. They employed time series data throughout the
timeline 1985 Q1 to 2012 Q1. Results indicated that the changes in CPI, GDP and household
consumption have a direct positive relation with the South African debt level. They also showed the
negative relation between household borrowing, and income and interest rate. In their model also, interest
rate was the significant factor in determining the household debt level.
Debelle used cross sectional data from different countries to determine the effective factors on
household debt level (Debelle, 2004). He argues that much of the increase in household debt is related to
two main factors: “the decrease in the prevalence of credit rationing that followed from the financial
deregulation of the early 1980s, and the reduction in interest rates, both in real and nominal terms, as
inflation declined over the past decade.” (Page 51)
In Canada, along with the increasing level of household debt, there have been some studies
conducted by financial institutions and the Canadian government. The bank of Canada has conducted
financial analysis of Canadian household debt (Bank of Canada, 2012). In their analysis, they concluded
that favorable income growth, financial innovation, higher house price and low interest rate have
supported significant increase in household debt level. Research conducted by Mario Fortin of the
Sherbrooke University defines interest rate, house price, inflation rate and disposable income as the main
determinants of the increasing trend of the household debt in Canada (Fortin, 2014).
3. Dataset
There are two sides in determining the level of household debt, the supply side and the demand
side. The supply side stands for the people or institutions that provide funding for households, and the
demand side refers to the households who take on debts. All determinants of household debt level that I
consider in this paper will affect both supply and demand sides.
On the demand side of the household debt level, there are families and households whose purpose
of borrowing is to keep their consumption level at a smooth trend, or to invest their money. An important
determinant on the demand side would be households’ disposable income which plays an important role
on whether to borrow or not. In this paper, GDP shows an approximation of disposable income. Inflation
is another factor that determines the level of consumption for households, and to keep the consumption
level stable, households might decide to borrow. Therefore, this paper investigates inflation as another
4. 4
determinant. Moreover, as recent studies show, housing is one main investment goal for Canadian
households (Bailliu, Kartashova, & Meh, 2012). So, the housing price index may be another factor in
determining household debt level. The interest rate also affects if households decide to make an
investment or not. The unemployment rate is an element that has an impact on consumers’ spending.
Therefore it may affect consumers’ debt level.
In considering the supply side of debts, the interest rate is the main factor that affects the fund
providers’ decision to lend their money or not. Moreover, inflation, GDP (as approximation of
households’ income) and the unemployment rate are other factors that determine the level of risk the fund
providers have to tolerate. So, by considering all these factors, this paper studies the following factors as
potential determinants of household debt level:
X (Independent Variables) = {GDP, HPI, I, R, U} , Y (Dependent Variable) = {HDTGDP}
In which GDP stands for Gross Domestic Product; HPI = Housing Price Index; I = Inflation;
U = Unemployment Rate; R = Interest Rate; Y = Household Debt to GDP
Data provided for this research is a quarterly time series data from 2005 Q1 to 2014 Q3. All
required data for determinants of household debt, except for HPI, was provided from the Organisation for
Economic Co-operation and Development (OECD) database (OECD, 2015). Data related to Housing
Price Index was provided through the Bank of Canada website (Bank of Canada, 2015). Also, the
household debt level was measured as a ratio of Canada GDP, and the data related to this variable was
collected from the Federal Reserve Bank of St. Louis database (FRED, 2015). In order to preserve
consistency in the model, all data provided was measured in percentage.
4. The Empirical Model
This study uses the Multiple Linear Regression Model to predict the relation between household
debt and explanatory variables. As Figure 3 in the Appendix shows, there is a linear relation between
household debt and each of the explanatory variables. The Population Multiple Linear Regression Model
can be expressed as follows:
𝑌𝑖 = 𝛽0 + 𝛽1 𝑋1𝑖 + 𝛽2 𝑋2𝑖 + ⋯ + 𝛽 𝑘𝑖 𝑋 𝑛𝑖 + 𝑢𝑖 𝑖 = 1, … . , 𝑛
𝛽0is known as intercept in this model and implies that if all other variables are equal to zero, the
value of the dependent variable would be equal to 𝛽0; this implication sometimes does not make any
economic sense and must be ignored in analysis. 𝛽1 is the slope coefficient of 𝑋1𝑖, which indicates the
change in 𝑌𝑖 for 1 unit change in 𝑋1, holding other variables constant.
5. 5
Population regression line before the change: 𝑌𝑖 = 𝛽0 + 𝛽1 𝑋1𝑖 + 𝛽2 𝑋2𝑖 + ⋯ + 𝛽 𝑘𝑖 + 𝑢𝑖
Population regression line after the change: 𝑌𝑖 + ∆𝑌𝑖 = 𝛽0 + 𝛽1(𝑋1 + ∆𝑋1) + 𝛽2 𝑋2𝑖 + ⋯ + 𝐵 𝑘𝑖 + 𝑢𝑖
Difference: ∆𝑌 = 𝛽1∆𝑋1 , So: 𝐵1 =
∆𝑌
∆𝑋1
, holding other variables(X) constant
The same proof could be applied to the rest of the slope coefficients in the model. Also, the
method used in this regression model is Ordinary Least Squares (OLS) method which solves for the
following:
𝑀𝑖𝑛 𝑏0 𝑏1 𝑏 𝑘
∑[𝑌𝑖 − (𝑏0 + 𝑏1 𝑋1 + ⋯ + 𝑏 𝑘 𝑋 𝑛)]2
𝑛
𝑖=1
The OLS model estimators minimize the average squared difference between the actual value of
𝑌𝑖 and the prediction (predicted value) based on the estimated line.
It is vital that all the slope coefficients’ signs follow the economic theories. Thus, I have shown
the expected sign of each parameter in Table 1 below:
Table 1
Expected Signs of Coefficients
Variable GDP U I HPI R
Expected Sign + ± ± + −
The reason the GDP expected sign is positive is that higher GDP shows higher income for
families. Higher income increases families’ confidence to borrow more. Thus, the increase in GDP is
expected to increase the household debt to GDP ratio. Also, increase in GDP affects the suppliers of funds
in the sense that they will be more confident that the money they lend will be returned. So, they are more
interested in lending money to households. Unemployment rate can affect Debt to GDP ratio in both
positive and negative manner. Higher unemployment rate means lower income for households. To keep
their level of consumption on a smooth trend, households are encouraged to borrow more. On the other
hand, the households who are unemployed are less likely to be able to make debt payments on time. Thus,
they are discouraged from borrowing more. Like unemployment, inflation has a bilinear impact on
household debt level. At the time of increasing inflation, it is more sensible for households to do their
investments through borrowed money. In the supplier side of financial markets, increasing inflation
discourages the fund suppliers to lend their money. It is because of diminishing effect on the return rate
they receive. HPI is expected to have the same direction with level of debt. The higher the housing price,
the more expensive it is for households to buy a house. So, households have to borrow more to perform
their investment. Increasing interest rate means higher cost of money for borrowers. Thus, higher interest
rate causes households to borrow less. This means interest rate is expected to have a negative sign.
6. 6
Next, the Multiple Linear Regression Model is estimated by using Stata software. Table 2 shows
the results of running the model:
Table 2
The Result of Multiple Linear Regression Test and Diagnostic Tests
Table 3
Correlation between Explanatory Variables
Figure 2
Durbin Watson d-test
As Table 2 suggests, the model has a relatively significant R-squared (0.7561). This means 75.61% of
variances in household debt to GDP ratio is explained by independent variables. Based on Table 3 results,
7. 7
there is a high (but not perfect) level of multicollinearity between unemployment rate and interest rate,
unemployment rate and HPI, and interest rate and HPI. This can be the explanation for few significant t-
ratios in this model. Also, by conducting Durbin Watson test through Stata, model shows 0.3034857 of
serial correlation. Durbin Watson d-test has a range of 0 to 4 and 2 in the middle; the d-test value in our
sample which is close to zero is not very significant.
5. Analysis of Model Results
5.1. Negatively Related Determinants of the Increase in Canada Household Debt
Interest rate is the most significant negatively related determinant of household debt level. Both t-
test and the slope coefficient of interest rate show that in comparison with other factors, change in interest
rate yields the biggest impact on the household debt level. One unit change in interest rate would result in
almost (-7.8) unit change in household debt to GDP ratio. The reason that explains this relation is that as
the interest rate increases, households have to pay back more money for the debt they borrow. So,
households have less incentive for borrowing more. Also, increasing interest rate will decrease
households’ enthusiasm in investment. Consequently, reduction in investments will slow down the
economy which results in a higher unemployment rate and lower households’ income. All these would
result in households having less enthusiasm for borrowing more.
The second important factor with negative impact on household debt level is the unemployment
rate. The estimates indicate that if the unemployment rate increases by 1%, household debt to GDP ratio
would decrease approximately 4.41%. Moreover, both t-test and interval estimates at 95% of confidence
demonstrate that the unemployment rate is a significant determinant of increase in household debt to GDP
ratio. An increase in unemployment would result in households having less income which leads them to
be less confident to borrow more. Also, a higher unemployment rate shows vulnerable economic situation
in which lenders are less interested in lending their money.
Finally, inflation rate is the insignificant factor that affects household debt level negatively. Based
on the interval estimate at 95% of confidence, we cannot reject the null hypothesis for this variable. In
theory, inflation can cause both positive and negative effects on household debt level. Higher inflation
makes it more reasonable to households to borrow more to make their investments. On the other hand,
higher inflation discourages fund providers to lend more money, which decreases the debt level. Based on
this paper’s estimations, inflation negative effect dominates its positive effect on household debt to GDP
ratio. Thus, any increase in inflation causes reduction in household debt level.
8. 8
5.2. Positively Related Determinants of the Increase in Canada Household Debt
GDP has an insignificant positive effect on increase in household debt in Canada as the interval
estimation and t-test show in Table 2. This result is not in line with previous studies about household debt
level in Canada. For instance, in the study conducted by Bank of Canada analysts, higher GDP is one
main contributor to increase in household debt level (Bank of Canada, 2012). One source of this
difference could be the existing multicollinearity between variables in my model. Increase in GDP shows
a healthy economic condition in which people benefit from higher income level, therefore they are more
confident to borrow. Also, increase in GDP encourages suppliers to provide more funds to borrowers
based on the fact that lenders are more optimistic that borrowers would pay off their debts on time.
Finally, the model indicates that housing price has the least significant positive effect on the
Canadian household debt to GDP ratio. According to this study, one percent increase in housing price
results in 0.37% increase in household debt level. Also, t-test and interval estimation show that this
variable is an insignificant variable affecting household debt in Canada. Simply, increase in housing price
forces people to borrow more in order to be able to invest in housing. This finding is consistent with
previous studies such as the Bank of Canada study (Bank of Canada, 2012).
6. Conclusion
Based on the empirical results and the model used in this study, the paper concludes that the
driving factors of the increasing household debt level in Canada are favorable interest rates and low
unemployment rates. These factors have encouraged households to borrow more to conduct their
investments specially in housing, and to smooth their spending. It is critical to prevent household debt
reaching a level that imposes systemic risk to the whole economy.
The author of this paper would suggest that government should approve more regulations on
financial markets and financial institutions to enhance transparency in their debt contracts. By reinforcing
the regulations and increasing standard over financial markets, governments can decrease the level of risk
that the economy might face due to financial bubbles. Improving transparency by approving proper
regulations could be helpful in maintaining a healthy financial system. Also, by employing decisive
monetary policies, governments can use interest rate as an effective means to control the economy going
in dangerous directions. By proper control over interest rate, governments can keep households’ spending
and investment at an ideal level.
10. 10
References
Bailliu, J., Kartashova, K., & Meh, C. (2012). Household Borrowing and Spending in Canada. Ottawa:
Bank of Canada.
Bank of Canada. (2012). What Explains Trends in Household Debt in Canada? 2012: Bank of Canada.
Bank of Canada. (2015, 06 27). Historical Data. Retrieved 06 17, 2015, from Bank of Canada:
http://www.bankofcanada.ca/rates/indicators/capacity-and-inflation-pressures/real-estate-market-
definitions/real-estate-market-historical-data/
Debelle, G. (2004). Household debt and the macroeconomy. BIS Quarterly Review, 51-64.
Fortin, M. (2014). Why has the mortgage debt increased by so much in Canada? Sherbrooke: Groupe de
Recherche en Économie et Développement International.
FRED. (2015, 06 27). Household Debt to GDP for Canada. Retrieved 06 17, 2015, from FRED:
https://research.stlouisfed.org/fred2/series/HDTGPDCAQ163N/downloaddata
Meng, X., Hoang, N. T., & Siriwardana, M. (2013). The determinants of Australian household debt: A
macro level study. Journal of Asian Economics, 80-90.
Meniago, C., & Mukuddem-Petersen, J. (2013). What causes household debt to increase in South Africa?
Economic Modelling, 482-492.
OECD. (2015, 06 27). OECD StatExtracts. Retrieved 06 17, 2015, from OECD:
http://stats.oecd.org/index.aspx?r=236919