1. Please see page 83 for rating definitions, important disclosures and
required analyst certifications. All estimates/forecasts are as of 02/06/18
unless otherwise stated. 02/06/18 16:49:54 ET
Wells Fargo Securities, LLC does and seeks to do business with companies covered
in its research reports. As a result, investors should be aware that the firm may
have a conflict of interest that could affect the objectivity of the report and
investors should consider this report as only a single factor in making their
investment decision.
February 6, 2018 | Equity Research
The Basin Book: Supply Vs. Takeaway
Permian, Northeast, Eagle Ford, Bakken,
Niobrara & W. Canada
Summary. We are updating our supply versus takeaway analysis for all
basins we have analyzed to date: Permian (oil, gas, NGLs, processing),
Marcellus/Utica (gas, NGLs, processing), Eagle Ford (oil), Bakken (oil),
Niobrara (oil, NGLs), and Western Canada (oil).
Supply Versus Takeaway Tightening. Supply vs. takeaway
tightened across a number of basins/commodities that we analyzed
relative to our last update in June 2017. What changed? Production did
not dip as much as we had forecasted and the rate of supply growth
has increased. Of the 12 basins/commodities we analyzed, 8 require
additional infrastructure (i.e., above what’s already been announced)
over the next 3-5 years. In total, we see the need for additional
takeaway of 0.5 MMBbls/d of crude, 2.5 Bcf/d of gas, 0.2 MMBbls/d of
NGLs, and 4.2 Bcf/d of processing. The basins with the greatest change
and/or most acute takeaway constraints are listed below.
Northeast Processing. Based on our analysis, processing capacity
could get tight as early as H2’19. We project the need for 2.8 Bcf/d of
incremental processing capacity (beyond what’s been announced) for
2019-2023, representing $2.4B of investment. This bodes well for
MPLX, AM, WMB/WPZ, in our view.
Niobrara NGLs. NGL takeaway could become full by H2’18. We see the
need for 100-200 MBbls/d of additional natural gas liquids (NGL)
takeaway, which could be solved by a combination 1-2 of the following
potential projects: Front Range expansion (benefits EPD/DCP/WES, in
our view), a lateral into the DJ off the Elk Creek pipeline (OKE), White
Cliffs conversion to NGL service (SEMG), and/or other possible
solutions (e.g. DCP-backed pipeline).
Bakken Oil. Production is significantly ahead of our prior forecast. We
now think the Bakken crude takeaway could get tight as soon as 2019.
This is a positive for firms with crude pipelines in the region (EEP, ETP,
KMI, PAA, and TEP) and potentially a positive for companies with crude
by rail assets in the Bakken (ANDX, CEQP, EEP, GLP, PAA, and PSXP).
Permian Oil. Takeaway could get tight in Q3’18-Q2’19 before new
pipes are placed into service. Takeaway could get tight again in Q2’20,
suggesting the need for 200-400 MBbls/d of new pipelines. This is a
positive for the various midstream companies with proposed Permian
pipes on the drawing board, in our view: BPL, ENB/PSX, MMP, and NS.
Permian Natural Gas. We see the need for 2-3 new Permian gas pipes
to the East (Gulf Coast markets). At least one project will likely need to
go to a market other than Agua Dulce. BWP’s project seems promising
in this regard as it targets the Houston/Katy market.
Permian Processing. Delaware build-out appears sufficient. However,
we believe more infrastructure is needed on the Midland side as
processing capacity could get tight by mid-2019. We see the need for
up to 1.3 Bcf/d of additional processing expansions in the Midland. We
believe this bodes well for ETP, DCP, and TRGP.
Midstream/MLPs
Michael Blum
Senior Analyst|212-214-5037
michael.j.blum@wellsfargo.com
Sharon Lui, CPA
Senior Analyst|212-214-5035
sharon.lui@wellsfargo.com
Praneeth Satish
Senior Analyst|212-214-8056
praneeth.satish@wellsfargo.com
Ned Baramov, CFA
Senior Analyst|212-214-8021
ned.baramov@wellsfargo.com
Eric Shiu
Associate Analyst|212-214-5038
eric.shiu@wellsfargo.com
Nicholas Daly
Associate Analyst|212-214-8012
nicholas.daly@wellsfargo.com
Zachary Cantor
Associate Analyst|212-214-5050
zachary.cantor@wellsfargo.com
5. The Basin Book: Supply Vs. Takeaway Equity Research
Wells Fargo Securities, LLC | 5
Executive Summary
Permian Crude Oil – Pockets of crude tightness are expected over the next five years. Takeaway is
projected to become significantly constrained during Q3’18-Q2’19, which could result in wider basis
differentials. This would be a temporary positive for companies with marketing businesses in the Permian,
including PAA and ETP. In Q3’19-Q1’20, we see ample takeaway as the Cactus II and EPIC pipelines are
placed into service. Takeaway could become tight again in Q2’20 and thereafter. We see the need for an
additional 200-400 MBbls/d of takeaway starting in Q2’20, which supports the construction of 1-2 more
Permian pipes. This is a positive for the various midstream companies with proposed Permian pipes on the
drawing board – BPL, ENB/PSX, MMP, and NS.
Permian Natural Gas – We see the need for 2-3 new Permian gas pipes to the East (Gulf Coast
markets). At least one project will likely need to go to a market other than Agua Dulce. BWP’s project
seems promising in this regard as it targets the Houston/Katy market and the major interstate pipelines
that traverse it.
Permian NGL – Takeaway appears sufficient over the next few years following the construction of TRGP’s
Grand Prix and EPD’s Shin Oak pipelines. Pipeline utilization could exceed 90% in 2022+, suggesting
additional pipelines could be required longer term.
Permian Processing – The recent wave of processing build-out in the Delaware Basin appears sufficient
as we do not see any meaningful bottlenecks until mid-2023. However, we believe more infrastructure is
needed on the Midland side as we project that processing capacity could get tight by mid-2019. We see
the need for up to 1.3 Bcf/d of additional processing expansions in the Midland, or around 7 additional
processing plants, representing ~$1.2B of potential investments for incumbent midstream companies in
the region, including DCP, ETP, and TRGP.
Northeast Natural Gas - Production has trended better than forecast so supply/demand is tighter than
our previous model projects. However, we still see the basin as having about 4.2 Bcf/d of excess takeaway
capacity by 2023. By 2023E, we forecast 38.7 Bcf/d of production, compared to 42.8 Bcf/d of takeaway.
(prior outlook assumed supply of 33.7 Bcf/d and demand of 42.4 Bcf/d or excess capacity of 8.7 Bcf/d).
For the first time since 2013, the Northeast has more takeaway than supply, which should improve
netbacks.
Northeast NGLs – There are currently significant constraints for NGLs in the Northeast, as evidenced by
the level of ethane rejection and propane+ movements by rail. Mariner East 2/2X has the potential to
alleviate these bottlenecks if the pipeline’s full design capacity is used to transport and ultimately export
NGLs. However, details of the pipeline’s contractual structure, in-service date, related downstream
infrastructure, and NGLs/refined products split is very limited at this point. If ME 2/2X’s full design
capacity isn’t used to move only NGLs (we only assume 50% is used for NGLs in our base case), we think
this opens the door for another competing NGL takeaway solution in the Northeast. Potential competitors
could be ATEX (expansion – EPD) and Centennial reversal (MPLX/EPD).
Northeast Processing – We see the potential for significant investment opportunities as processing
capacity could get tight as early as H2’19. Net-net, we project the need for 2.8 Bcf/d of incremental
processing capacity (beyond what’s been announced) implying ~$2.4B of new investment opportunity for
2019-2023. We believe this bodes well for MPLX, AM, and WMB/WPZ.
Eagle Ford Crude Oil – Supply / demand dynamics in South Texas remain relatively unchanged. Based
on existing takeaway, we forecast crude takeaway capacity out of the Eagle Ford to be overbuilt through
2023. No new projects have been announced. The EPIC pipeline (200 MBbls/d of incremental capacity) is
to have a receipt point in Gardendale, Texas (in the Eagle Ford). However, based on our understanding,
the vast majority of EPIC’s throughput is to come from the Permian.
Bakken Crude Oil – Production is significantly exceeding our prior forecast. We now think Bakken crude
takeaway could get tight as soon as 2019. We see the need for 100-200 MBbls/d of additional pipeline
takeaway out of the Bakken. We believe this is a positive for companies with crude pipes in the region as
they should not only benefit from high utilization rates and reduced risk of re-contracting, but should also
be in an advantaged position to secure the next wave of expansion opportunities (EEP, ETP, KMI, PAA, and
TEP). If there is a delay in announcing pipe expansions and takeaway becomes full, we think companies
with crude by rail (CBR) assets in the region could see a benefit – ANDX, EEP, GLP, PAA, and PSXP.
6. Midstream/MLPs Equity Research
6 | Wells Fargo Securities, LLC
Niobrara Crude Oil – We estimate that the Niobrara has meaningful excess capacity through 2023;
specifically, we project total crude supply of 1,140 MBbls/d by 2023E, compared to existing takeaway of
1,330 MBbls/d. In the near term, excess takeaway capacity represents a risk to upcoming contract
expirations in 2019-2020. This could be a negative for SEMG, as White Cliffs contracts roll off in the next
18-24 months. However, given increasing production in the region (i.e., Platts has revised its projections
by an average of 7%) and if White Cliffs repurposes 125 MBbls/d of capacity, we believe takeaway could
become constrained by 2021. This is a long-term potential positive for all midstream companies with
pipeline assets (NGL, MMP, SEMG, SEP, and TEP).
Niobrara NGLs – By H2’18, NGL production could match takeaway capacity, suggesting an imminent
need for new takeaway capacity. In total, we see the need for around 100-200 MBbls/d of additional NGL
takeaway over the next 3-5 years, which could be solved by a combination 1-2 of the following potential
projects: a low-cost expansion of Front Range (benefits EPD/DCP/WES), a lateral into the DJ off the Elk
Creek pipeline (OKE), White Cliffs conversion to NGL service (SEMG), and/or another yet to be announced
solution (e.g., a DCP-backed pipeline).
Western Canada Crude Oil – Without any new projects entering service since our last update, heavy
takeaway capacity out of the basin remains tight. Western Canada needs two of the three projects: ENB’s
Line 3 Replacement (L3R), Kinder Morgan’s TransMountain Expansion (TMX), and TRP’s Keystone XL (KXL)
– to alleviate infrastructure constraints, which have weighed heavily on WCS basis differentials.
Consequently, we expect continued crude-by-rail utilization in the near term. If all three projects are
ultimately placed into service, Western Canada should have sufficient heavy crude takeaway capacity
through 2023, in our view. Light crude takeaway capacity continues to exceed supply.
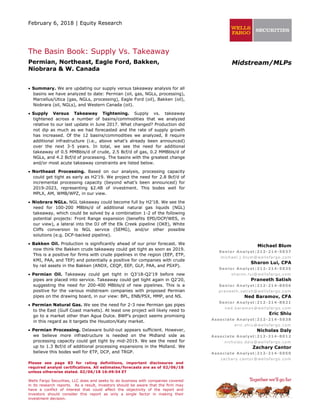
Summary Of Infrastructure Needs By Basin & Commodity
Of the 12 basins/commodities we analyzed, 8 require additional infrastructure (i.e., above what has
already been announced) by the 2021 time frame. In contrast, in our last Basin update report in June
2017, only 3 out of the 9 basins/commodities we analyzed needed more infrastructure.
In total, we see the need for 0.5 MMBbls/d of additional crude takeaway, 2.5 Bcf/d of additional gas
takeaway, 0.2 MMBbls/d of additional NGL takeaway, and 4.2 Bcf/d of additional processing expansions.
Exhibit 1. Incremental Infrastructure Needs By Basin & Commodity (2023E Snapshot)
2023E Infrastructure Needs (Assuming 100% Utilization)
Basin Crude Oil Natural Gas 2
NGLs Processing
Permian -237 MBbls/d -2500 MMcf/d Sufficient -1311 MMcf/d
Northeast - Sufficient -61 MBbls/d -2843 MMcf/d
Eagle Ford Sufficient - - -
Bakken -158 MBbls/d - - -
Niobrara Sufficient - -141 MBbls/d -
W. Canada1
-129 MBbls/d - - -
Total Infrastructure Needs -524 MBbls/d -2500 MMcf/d -202 MBbls/d -4153 MMcf/d
Note: Figures are based on supply versus takeaway projections for 2023 and reflect infrastructure needs beyond projects
already announced and proceeding.
Note 1: Analysis of heavy crude supply versus takeaway.
Note 2: Permian gas figures reflect the following utilization rates: East Corridor takeaway capacity is equal to 90% of
total pipeline capacity, Mexico Corridor incorporates 25% of total capacity in 2017 based on estimated utilization,
increasing to 55% by 2023.
Note 3: Northeast Processing infrastructure needs reflect full-year average production. Based on Q4’23E wet gas
production estimates, we forecast 3.2 Bcf/d of additional processing capacity needed.
Source: Wells Fargo Securities, LLC estimates
7. The Basin Book: Supply Vs. Takeaway Equity Research
Wells Fargo Securities, LLC | 7
Permian: Crude Oil
8. Midstream/MLPs Equity Research
8 | Wells Fargo Securities, LLC
Permian: Crude Oil
Key Conclusions. Based solely on existing pipelines and projects under construction, we see pockets
of crude takeaway tightness forming over the next few years. We believe takeaway could become
tight during the period Q3’18-Q2’19, adequate in Q3’19-Q2’20, and tight again in Q3’20 and
thereafter. In addition to pipelines under construction, a number of potential Permian pipelines are on
the drawing board. If we assume all of the potential pipeline projects under evaluation are
constructed and placed into service in mid- to late 2019, we project crude takeaway to be tight in
Q3’18-Q2’19, but foresee ample takeaway capacity in Q2’19 and beyond.
Production Tracking Our Forecast – Raising Long-Term Outlook. Q4’17 production averaged
2,652 MBbls/d, in line with our forecast of 2,610 MBbls/d. Based on data from Bentek and company
projections, we have raised our 2018-23 production estimates by an average of 3-8% relative to our
previous model.
Update On Identified/Likely Projects. Since our last update, several pipeline projects that were
previously under evaluation received sufficient commitments to proceed with construction. This
includes EPIC’s crude oil pipeline to Corpus, PAA’s Cactus 2 pipeline to Corpus, and ETP’s Permian
Express III (phase 1) to Nederland. Most of these pipelines received commitments in Q4’17-Q1’18,
which suggests that the pipelines may not be constructed fast enough to prevent basis differentials
from widening in the Q3’18-Q2’19 time frame, due to constrained takeaway capacity.
o Cactus II. On 1/22/18, PAA announced that it was proceeding with its Cactus II pipeline after
securing sufficient shipper commitments. The pipeline is to transport crude from the Permian
Basin to Corpus Christi/Ingleside and have an initial capacity of 585 MBbls/d. Trafigura is to be
the anchor shipper on the pipeline. The commodity trading firm has signed a 300 MBbls/d long-
term contract on Cactus II. We believe the duration of the contract is likely around 5 years.
Crude on Cactus II will be delivered into BPL’s and PAA’s terminals at Corpus. The pipeline is
expected to go into service in Q3’19.
o EPIC Pipeline. On 12/21/17, EPIC announced it was proceeding with its Permian to Corpus
pipeline. The pipeline is to transport crude from the Permian Basin to Corpus Christi. The pipeline
is to have an initial capacity of 590 MBbls/d. Noble Energy and another unnamed company are to
be the anchor shippers on the pipeline. Unlike other pipeline deals, Noble’s commitment to the
EPIC pipeline consists of an acreage dedication, rather than a standard firm volume commitment.
Noble also has the option to acquire a 30% ownership stake in the crude pipeline by January
2019. The other unnamed shipper on the pipeline has made a standard 75 MBbls/d firm volume
commitment (duration not disclosed). The pipeline is expected to go into service in 2019.
o Delaware To Cushing Pipeline. On 7/18/17, PAA announced it was proceeding with its Delaware
to Cushing pipeline after securing sufficient shipper commitments. The project is to involve
extending PAA’s existing Sunrise system from Colorado City to Wichita Falls. The pipeline is to
have an initial capacity of 120 MBbls/d. The pipeline is expected to go into service in H1’19.
Update On Potential Projects. There are currently seven potential Permian takeaway projects on
the drawing board, including the following:
o Permian Express III – phase II. ETP is evaluating a phased build-out of expansion potential on its
Permian Express system. The first phase of PE III was completed in Q4’17 and added 100
MBbls/d. Phase II would add an additional 200 MBbls/d of takeaway capacity from the Permian
(Delaware Basin) to ETP’s terminals in Nederland.
o Grey Oak (NEW since our last update). This pipeline is a joint venture between Phillips 66 and
Enbridge and is to transport crude from the Permian to Corpus Christi, Freeport, and Houston.
The pipeline is to have an initial capacity of 385 MBbls/d, with the potential to expand higher. An
open season for the pipeline was launched on 12/11/17.
o South Texas Gateway. This proposed pipeline by BPL would transport crude and condensate from
the Permian and Eagle Ford to BPL’s terminals in Corpus Christi (and other markets, including
Ingleside and Houston). The pipeline would have an initial capacity of 600 MBbls/d. An open
season for the project was announced on 12/21/17.
o Permian To Corpus Pipeline. This proposed pipeline by MMP would transport crude from the
Permian Basin and Eagle Ford Shale to Corpus Christi and Houston. The pipeline would have an
initial capacity of 350 MBbls/d (expandable to 600 MBbls/d). An open season for the pipeline was
launched on 12/1/17.
9. The Basin Book: Supply Vs. Takeaway Equity Research
Wells Fargo Securities, LLC | 9
o NS Potential Permian Pipeline. Nustar has noted the possibility of constructing a crude pipeline
out of the Permian to Corpus Christi. In the absence of details, we’ve assumed the pipeline could
have an initial capacity of 300 MBbls/d.
o Sinopec Potential Permian Pipeline. China’s oil major, Sinopec, announced last October that it was
evaluating building a crude pipeline out of the Permian. The announcement was made ahead of
President’s Trump visit to Beijing in November. The company would partner with Freepoint
Commodities and ArcLight to build the pipeline. In the absence of details, we’ve assumed the
pipeline could have an initial capacity of 300 MBbls/d.
We think it’s highly unlikely that all these projects are completed and instead anticipate joint ventures to
be formed to consolidate potential projects.
Supporting Charts
Exhibit 2. Permian Crude Takeaway Chart – Identified/Likely Projects
0
1,000
2,000
3,000
4,000
5,000
6,000
Q1'12A
Q2'12A
Q3'12A
Q4'12A
Q1'13A
Q2'13A
Q3'13A
Q4'13A
Q1'14A
Q2'14A
Q3'14A
Q4'14A
Q1'15A
Q2'15A
Q3'15A
Q4'15A
Q1'16A
Q2'16A
Q3'16A
Q4'16A
Q1'17A
Q2'17A
Q3'17A
Q4'17A
Q1'18E
Q2'18E
Q3'18E
Q4'18E
Q1'19E
Q2'19E
Q3'19E
Q4'19E
Q1'20E
Q2'20E
Q3'20E
Q4'20E
Q1'21E
Q2'21E
Q3'21E
Q4'21E
Q1'22E
Q2'22E
Q3'22E
Q4'22E
Q1'23E
Q2'23E
Q3'23E
Q4'23E
Crude
Oil
Production
/
Takeaway
Capacity
(MBbls/d)
Existing Pipelines
Refineries
Production
Identified / Likely
Projects
Q3'18E-Q2'19: Takeaway
constraints
Q3'20E+: Takeaway
constraints
Note: Production figures are based on a combination of Bentek projections and company presentations.
Source: Company data, Bentek, EIA, and Wells Fargo Securities, LLC estimates
10. Midstream/MLPs Equity Research
10 | Wells Fargo Securities, LLC
Exhibit 3. Permian Crude Takeaway Chart – Identified/Likely and Potential Projects
0
1,000
2,000
3,000
4,000
5,000
6,000
7,000
8,000
Q1'12A
Q2'12A
Q3'12A
Q4'12A
Q1'13A
Q2'13A
Q3'13A
Q4'13A
Q1'14A
Q2'14A
Q3'14A
Q4'14A
Q1'15A
Q2'15A
Q3'15A
Q4'15A
Q1'16A
Q2'16A
Q3'16A
Q4'16E
Q1'17E
Q2'17E
Q3'17E
Q4'17E
Q1'18E
Q2'18E
Q3'18E
Q4'18E
Q1'19E
Q2'19E
Q3'19E
Q4'19E
Q1'20E
Q2'20E
Q3'20E
Q4'20E
Q1'21E
Q2'21E
Q3'21E
Q4'21E
Q1'22E
Q2'22E
Q3'22E
Q4'22E
Q1'23E
Q2'23E
Q3'23E
Q4'23E
Crude
Oil
Production
/
Takeaway
Capacity
(MBbls/d)
Existing Pipelines
Refineries
Production
Identified / Likely
Projects
Q3'18-Q2'19: Takeaway
constraints
Potential Pipelines /
Expansions
Source: Company data, Bentek, EIA, and Wells Fargo Securities, LLC estimates
Exhibit 4. Tariffs And Netbacks On Existing Permian Lines
Netback Calculation ($/Bbl)
Contract Details 1
Basis Differential Committed Netback
Pipeline Operator Destination Type Length (Yrs) (Destination - Origin) Tariff Best Worst
West Texas Gulf SXL Houston Volumetric $5.42 $1.86 $3.56
Permian Express II SXL Nederland ToP N/A $5.42 $1.95 $3.47
Longhorn MMP Houston ToP 1 $5.42 $2.20 $3.22
BridgeTex MMP Houston ToP 7 $5.42 $2.60 $2.82
Cactus PAA EFS > Corpus ToP 5-8 $5.42 $3.26 $2.16
Basin PAA Cushing Volumetric ($0.26) $0.78 ($1.04)
Centurion OXY Cushing Volumetric ($0.26) $1.30 ($1.56)
Average of above $3.79 $1.99 $1.80
(-) (=)
Note: Basis differentials are based on the Q4’17 average
Note: Cactus tariff to Corpus Christi includes tariff on connecting third party pipelines
Note 1: ToP = take or pay; contract length = remaining duration
Source: Company data, FERC filings, Bloomberg, and Wells Fargo Securities, LLC estimates
11. The Basin Book: Supply Vs. Takeaway Equity Research
Wells Fargo Securities, LLC | 11
Exhibit 5. List Of Identified/Likely And Potential Permian Takeaway Pipelines
Permian Basin Est. Region/ In-
(MBbls/d) Capacity Destination Service 2014A 2015A 2016A 2017A 2018E 2019E 2020E 2021E 2022E 2023E
Permian Crude Oil Supply:
Permian Crude Oil Production NA NA 1,630 1,916 2,022 2,421 3,064 3,740 4,167 4,479 4,718 4,907
TexNew Mex Reversal 20 West Texas Q2'15 0 15 20 20 20 20 20 20 20 20
Total Permian Oil Supply 1,630 1,931 2,042 2,441 3,084 3,760 4,187 4,499 4,738 4,927
Permian Takeaway Capacity:
Identified Takeaway
Local Refineries:
Big Spring Refinery 73 - <Q1'11 73 73 73 73 73 73 73 73 73 73
Navajo Refinery 100 - <Q1'11 100 100 100 100 100 100 100 100 100 100
Pipelines In Service:
Amdel 40 Nederland <Q1'12 40 40 40 40 40 40 40 40 40 40
Line 80 28 North Texas <Q1'12 28 28 28 28 28 28 28 28 28 28
WA Line 104 North Texas <Q1'12 104 104 104 104 104 104 104 104 104 104
Wink Pipeline 145 West Texas <Q1'12 145 145 145 145 145 145 145 145 145 145
Basin Pipeline 400 Cushing <Q1'12 400 400 400 400 400 400 400 400 400 400
Basin Pipeline Expansion 50 Cushing Q1'12 50 50 50 50 50 50 50 50 50 50
Centurion - Line 2 80 Cushing <Q1'12 80 80 80 80 80 80 80 80 80 80
Centurion - Line 1 60 Cushing Q3'14 30 60 60 60 60 60 60 60 60 60
West Texas Gulf 250 Longview <Q1'12 250 250 250 250 250 250 250 250 250 250
West Texas Gulf Expansion - Houston 40 Houston Q2'13 40 40 40 40 40 40 40 40 40 40
West Texas Gulf Expansion - Longview 30 Longview Q2'13 30 30 30 30 30 30 30 30 30 30
West Texas Gulf Expansion - Nederland 40 Nederland Q2'13 40 40 40 40 40 40 40 40 40 40
Longhorn Pipeline Reversal Phase I 75 Houston Q2'13 75 75 75 75 75 75 75 75 75 75
Longhorn Pipeline Reversal Phase II 150 Houston Q3'13 150 150 150 150 150 150 150 150 150 150
Longhorn Pipeline Expansion 50 Houston Q3'14 25 50 50 50 50 50 50 50 50 50
BridgeTex Pipeline 300 Houston Q4'14 75 300 300 300 300 300 300 300 300 300
Cactus Pipeline 250 South Texas Q2'15 0 188 250 250 250 250 250 250 250 250
Cactus Pipeline Expansion I 50 South Texas Q2'16 0 0 38 50 50 50 50 50 50 50
Permian Express II 200 Nederland Q3'15 0 100 200 200 200 200 200 200 200 200
Permian Longview & Louisiana Ext. 100 South Texas Q3'16 0 0 50 100 100 100 100 100 100 100
BridgeTex Expansion II 100 Gulf Coast Q2'17 0 0 0 75 100 100 100 100 100 100
Cactus Pipeline Expansion II 90 South Texas Q4'17 0 0 0 23 90 90 90 90 90 90
Midland to Sealy Pipeline 450 Gulf Coast Q4'17 0 0 0 113 450 450 450 450 450 450
Permian Express III (phase 1) 100 Nederland Q4'17 0 0 0 25 100 100 100 100 100 100
Pipelines Under Construction:
BridgeTex Expansion III 40 Gulf Coast Q1'19E 0 0 0 0 0 40 40 40 40 40
Delaware Cushing Pipeline I (PAA) 120 Cushing Q2'19E 0 0 0 0 0 90 120 120 120 120
EPIC Pipeline (Permian leg) 590 Corpus Christi Q2'19E 0 0 0 0 0 443 590 590 590 590
Cactus II Loop (PAA) 585 Corpus Christi Q3'19E 0 0 0 0 0 293 585 585 585 585
Total Permian Takeaway - Identified/Likely 1,735 2,303 2,553 2,850 3,355 4,220 4,690 4,690 4,690 4,690
Over/(Under) Built 105 371 510 409 271 460 503 191 (48) (237)
% utilization 94% 84% 80% 86% 92% 89% 89% 96% 100% 100%
Potential Takeaway
Potential Low Cost Expansions:
Permian Express III (phase 1I) 200 Nederland Q1'19E 0 0 0 0 0 200 200 200 200 200
Potential Newbuild Pipelines:
South Texas Gateway (BPL) 600 Corpus Christi Q4'19E 0 0 0 0 0 150 600 600 600 600
Gray Oak Pipeline (ENB/P66) 385 Corpus Christi Q4'19E 0 0 0 0 0 96 385 385 385 385
NGL to Crude Pipe Conversion (EPD) 145 Gulf Coast Q4'19E 0 0 0 0 0 36 145 145 145 145
Permian to Corpus (MMP) 350 Corpus Christi >Q4'19E 0 0 0 0 0 88 350 350 350 350
Potential Corpus Pipeline (NS) 300 (E) Corpus Christi >Q4'19E 0 0 0 0 0 75 300 300 300 300
Potential Corpus Pipeline (Sinopec) 300 (E) Corpus Christi >Q4'19E 0 0 0 0 0 75 300 300 300 300
(+) Refining demand (net) 173 173 173 173 173 173 173 173 173 173
(+) Pipeline takeaway (existing) 1,562 2,130 2,380 2,677 3,182 3,182 3,182 3,182 3,182 3,182
(+) Pipeline expansions ( secured ) 0 0 0 0 0 865 1,335 1,335 1,335 1,335
(+) Pipeline expansions ( potential ) 0 0 0 0 0 720 2,280 2,280 2,280 2,280
Total Permian Takeaway - Identified/Likely & Potential 1,735 2,303 2,553 2,850 3,355 4,940 6,970 6,970 6,970 6,970
Over/(Under) Built 105 371 510 409 271 1,180 2,783 2,471 2,232 2,043
% utilization 94% 84% 80% 86% 92% 80% 60% 65% 68% 71%
Note: Companies listed are the primary owners for the assets; additional companies may own economic interests
Note: The Borger Refinery is excluded from local refineries since it is outside of the Permian Basin and receives crude
from a number of sources including Line 80 and WA Line (above)
Note: Permian Express I is excluded since it receives crude from the Plains Basin pipeline (above)
Source: EIA, Bentek, and Company reports and Wells Fargo Securities, LLC estimates
12. Midstream/MLPs Equity Research
12 | Wells Fargo Securities, LLC
Exhibit 6. Map Of Existing And Future Crude Oil Pipelines In The Permian Basin
Gardendale
Corpus
Midland
Colorado
City
Cushing
Houston
Nederland
Sealy
Note: Solid lines represent existing systems. Dotted lines represent expansion projects.
Source: Wells Fargo Securities, LLC
13. The Basin Book: Supply Vs. Takeaway Equity Research
Wells Fargo Securities, LLC | 13
Permian: Natural Gas
14. Midstream/MLPs Equity Research
14 | Wells Fargo Securities, LLC
Permian: Natural Gas
A Note On The Basin: While there is ample natural gas takeaway capacity from the Permian basin to the
North, West, and South (Mexico), natural gas demand (and therefore, netbacks) is strongest to the east
(Gulf Coast/East Texas), creating a tight supply/demand balance on pipelines pointed to East Texas.
Consequently, our traditional supply versus takeaway analysis charts and tables show that ample excess
takeaway does not entirely provide an accurate depiction of basin dynamics.
Key Conclusions. We estimate ample natural gas pipeline takeaway out of the Permian Basin
through 2023, but only to regions with significant supply competition and limited demand (i.e., the
West and North corridors). Alternatively, takeaway is constrained to the East corridor, which benefits
from strong netbacks and demand growth. Reflecting this dynamic, midstream companies are
competing to build new pipelines to the East corridor and have proposed five projects with a
combined capacity of ~8.8 Bcf/d to date. If we assume that all pipeline takeaway capacity to the
North and West is fully utilized by 2023, our analysis implies that only one pipeline project to the East
is required (i.e., the current Gulf Coast Express). However, given that demand to the North and West
is muted and netbacks are unattractive, we assume that most of the incremental gas supply produced
will want to move east. If we assume that all incremental natural gas supply growth flows only to the
East, our analysis suggests that the market would require 7.0 Bcf/d of incremental capacity (or four
pipeline projects). With these two bookends, we assume that the ultimate outcome is somewhere in
between (i.e., 2-3 projects). In all scenarios, these market dynamics suggest that Permian (Waha)
prices are likely to remain somewhat depressed, and basis to Gulf Coast (East) markets is likely to
remain wide, even accounting for Gulf Coast Express, in our view. To note, we forecast natural gas
demand to Mexico (and therefore, flows from the Permian) are modest, but should increase over
time.
Constraints To The East Driving Wider Basis. Takeaway to the East, where netbacks are more
favorable and gas demand is growing, is constrained. Given these constraints, we expect near-term
pipeline utilization to the west and north of the Permian to increase between 2017 and 2019 until new
pipeline projects to the East can be built. To incentivize gas to move to these markets, Waha pricing
may need to decrease further. This dynamic is already occurring. Katy-Waha and MidCon-Waha
differentials widened 18% and 32%, respectively, in Q4’17 versus H1’17.
Update On Potential Projects. Since our June 2017 update, two additional proposed pipeline
projects to the East have been announced: BWP’s/SRE’s Permian-to-Katy Pipeline (P2K) and TELL’s
Permian Global Access Pipeline (PGAP). There are now five proposed pipeline projects to the East with
a combined capacity of ~8.8 Bcf/d. Of these pipelines, only KMI’s/DCP’s/TRGP’s Gulf Coast Express
project (GCX) has issued a final investment decision (FID). Of the 2-3 projects that we believe will
move forward, we expect one of these projects to transport gas to Agua Dulce/Corpus Christi (i.e.,
GCX) and the other(s) to move gas to Houston/Katy and/or Louisiana (i.e., P2K or PGAP). While more
than one project to Houston/Katy/Louisiana could be completed, we do not foresee a need for more
than one new pipeline targeting the Agua Dulce/Corpus Christi market in the near term given the
limited market depth (few large customers, limited liquidity), uncertainty around Mexican demand
growth, and a lack of storage. If all four remaining pipelines are constructed, we project ample
takeaway to the East corridor, which could result in improved Waha pricing (i.e., a narrowing of basis)
beginning in 2020.
Update On The Gulf Coast Express Pipeline (GCX) Project. On 10/4/17, KMI and DCP added
TRGP as a partner on the project and announced that TRGP and DCP, two of the largest gas
processors in the Permian, would commit volumes to the project, including volumes provided by PXD,
one of the largest producers in the basin. With additional commitments from XTO, KMI’s Kinder
Morgan Texas Pipeline (KMTP), and APA (which holds an option to purchase 15% of the project from
KMI), the project has commitments for 85% of the planned capacity and subsequently announced FID
on 12/21/17. The partners expect to sign commitments for 100% of capacity by the end of Q1’18 and
place the pipeline into service by October 2019.
Overview Of Two Additional Pipeline Proposals. On 8/14/17, BWP and SRE announced plans to
construct a 1.7-2.25 Bcf/d pipeline from the Waha hub in the Permian to Katy/Houston with a lateral
to BWP’s Coastal Bend Header project, which supplies the Freeport LNG facility. The project has
currently signed commitments for approximately 40% of the capacity (midpoint). The partners plan to
sign shipper agreements by Q1’18, issue FID by Q2’18, and place the pipeline into service by Q3’20.
The rate is expected to be $0.45-0.55/MMBtu, which compares to ETP’s recently signed long-term
rates of ~$0.40/MMBtu. On 12/18/17, TELL announced plans to construct a 2.0 Bcf/d pipeline from
the Waha hub to Gillis, LA where it is to interconnect with several pipelines supplying LNG facilities
along the Gulf Coast, including TELL’s planned Driftwood Pipeline, which is to supply its Driftwood LNG
facility. TELL plans to sign necessary shipper commitments by YE2018 and place the project into
service by YE2022.
15. The Basin Book: Supply Vs. Takeaway Equity Research
Wells Fargo Securities, LLC | 15
Supporting Charts
Exhibit 7. Permian Natural Gas Takeaway Chart – Identified / Likely Projects
0
2,000
4,000
6,000
8,000
10,000
12,000
14,000
2014A 2015A 2016A 2017E 2018E 2019E 2020E 2021E 2022E 2023E
Natural
Gas
Production
/
Takeaway
Corridors
(MMcf/d)
West Corridor
East Corridor
Mexico Corridor
North Corridor
Production
Other Identified /
Likely Pipelines
East Corridor (Likely)
Source: Company data, EIA, and Wells Fargo Securities, LLC estimates
Exhibit 8. Permian Natural Gas Takeaway Chart – Identified/Likely and Potential Projects
0
2,000
4,000
6,000
8,000
10,000
12,000
14,000
16,000
18,000
20,000
2014A 2015A 2016A 2017E 2018E 2019E 2020E 2021E 2022E 2023E
Natural
Gas
Production
/
Takeaway
Corridors
(MMcf/d)
West Corridor
East Corridor (Proposed)
East Corridor
Mexico Corridor
Identified /
Likely
Pipelines
Production
East Corridor (Likely)
North Corridor
Source: Company data, EIA, and Wells Fargo Securities, LLC estimates
16. Midstream/MLPs Equity Research
16 | Wells Fargo Securities, LLC
Exhibit 9. Tariffs And Netbacks On Existing Permian Natural Gas Takeaway Pipelines
Basis Differential Committed Netback
Pipeline Operator Corridor 3
Origin Destination (Destination - Origin) 2
Tariff 1
Best Worst
EPNG KMI West Waha (El Paso) SoCal $0.90 $0.48 $0.42
Transwestern Pipeline ETP West Waha (El Paso) SoCal $0.90 $0.59 $0.31
NGPL KMI North Waha (El Paso) MidCon Avg $0.28 $0.14 $0.13
Oasis Pipeline ETP East Waha (Oasis) Katy $0.38 $0.30 $0.08
Atmos Pipeline Texas ATO East Waha (El Paso) Carthage $0.32 $0.26 $0.06
ET Fuel ETP East Waha (El Paso) Carthage $0.32 $0.26 $0.06
NNG BRK North Waha (El Paso) MidCon Avg $0.28 $0.36 ($0.08)
Average of above $0.48 $0.34 $0.14
(=)
(-)
Netback Calculation ($/MMBtu)
Note 1: Represents firm tariff plus fuel charges (interruptible tariff for intrastate pipelines).
Notes 2: Based on average basis for Q4’17
Note 3: We assume the transportation rate for Texas intrastate movements (i.e., East Corridor pipelines) equates to 80%
of the basis between Waha and Katy.
Note 4: The basis differential between Waha and SoCal was abnormally high in Q4’17 due to pipeline outages on SoCal’s
system.
Source: Company data, FERC filings, Bloomberg, and Wells Fargo Securities, LLC
17. The Basin Book: Supply Vs. Takeaway Equity Research
Wells Fargo Securities, LLC | 17
Exhibit 10. List Of Identified/Likely And Potential Permian Natural Gas Takeaway Pipelines
Permian Est. Est. In
(MMcf/d) Capacity Service 2014A 2015A 2016A 2017A 2018E 2019E 2020E 2021E 2022E 2023E
Permian Dry Natural Gas Production:
Total Natural Gas Production 3,967 4,558 4,990 5,883 7,446 9,065 10,434 11,442 12,022 12,371
Permian Takeaway Capacity:
Identified Takeaway
Takeaway Pipelines (Operator):
El Paso Natural Gas Pipeline Company - EPNG (KMI)
Plains Amarillo, TX 350 Q1'14 350 350 350 350 350 350 350 350 350 350
Plains Lincoln, NM (North Line) 460 Q1'14 460 460 460 460 460 460 460 460 460 460
Waha El Paso, TX (South Line) 2,480 Q1'14 2,480 2,480 2,480 2,480 2,480 2,480 2,480 2,480 2,480 2,480
Permian North Expansion 182 Q4'18 0 0 0 0 46 182 182 182 182 182
Natural Gas Pipeline Company Of America - NGPL (KMI)
St. 168 St. 169 240 Q1'14 240 240 240 240 240 240 240 240 240 240
Kinder Morgan Texas Pipeline - KMTP (KMI) 250 Q1'14 250 250 250 250 250 250 250 250 250 250
Northern Natural Gas Company - NNG (BRK) 450 Q1'14 450 450 450 450 450 450 450 450 450 450
Atmos Pipeline - Texas (ATO) 750 Q1'14 750 750 750 750 750 750 750 750 750 750
Transwestern Pipeline Company (ETP)
West Texas Lateral Gallup, New Mexico 500 Q1'14 500 500 500 500 500 500 500 500 500 500
West Texas Lateral Expansion 130 Q2'18 0 0 0 0 98 130 130 130 130 130
Oasis Pipeline (ETP) 1,200 Q1'14 1,200 1,200 1,200 1,200 1,200 1,200 1,200 1,200 1,200 1,200
Texas Intrastate systems
Waha E. Texas (JV b/w ETP/EPD; 36") 1,000 Q1'14 1,000 1,000 1,000 1,000 1,000 1,000 1,000 1,000 1,000 1,000
Waha SE. Texas (JV b/w EPD/DCP; 30") 1,000 Q1'14 1,000 1,000 1,000 1,000 1,000 1,000 1,000 1,000 1,000 1,000
ONEOK WesTex Transmission (OKS)
Culbertson Co. El Paso Co. 240 Q1'14 240 240 240 240 240 240 240 240 240 240
System Expansion 260 Q4'16 0 0 65 260 260 260 260 260 260 260
Roadrunner Gas Transmission (OKS/Fermaca)
Phase I 170 Q1'16 0 0 170 170 170 170 170 170 170 170
Phase II 400 Q4'16 0 0 100 400 400 400 400 400 400 400
Phase 3 - proposed 70 Q4'19 0 0 0 0 0 18 70 70 70 70
Comanche Trail Pipeline (ETP) 1,135 Q1'17 0 0 0 1,135 1,135 1,135 1,135 1,135 1,135 1,135
Trans Pecos Pipeline (ETP/MasTec/Carso) 1,356 Q2'17 0 0 0 1,017 1,356 1,356 1,356 1,356 1,356 1,356
Likely Pipelines (Operator/Owners):
Gulf Coast Express Pipeline - GCX (KMI/DCP/TRGP) 1,960 Q4'19 0 0 0 0 0 490 1,960 1,960 1,960 1,960
Total Permian Takeaway - Identified/Likely 1
8,920 8,920 9,255 11,902 12,384 13,061 14,583 14,583 14,583 14,583
Total Estimated Permian Takeaway - Identified/Likely 2
8,500 8,500 8,633 9,417 9,821 10,639 12,284 12,441 12,598 12,754
Over / (Under) Built 4,533 3,942 3,643 3,534 2,376 1,574 1,851 999 575 383
% utilization 3
47% 54% 58% 62% 76% 85% 85% 92% 95% 97%
Potential Takeaway
Proposed Pipelines (Operator/Owners):
Pecos Trail Pipeline (NAmerico) 1,850 Q4'19 0 0 0 0 0 463 1,850 1,850 1,850 1,850
Permian-to-Katy Pipeline - P2K (BWP/SRE) 2,000 Q3'20 0 0 0 0 0 0 1,000 2,000 2,000 2,000
Permian Global Access Pipeline - PGAP (TELL) 2,000 Q4'22 0 0 0 0 0 0 0 0 500 2,000
Permian-to-Gulf Coast Pipeline (EPD) 1,000 Q4'19 0 0 0 0 0 250 1,000 1,000 1,000 1,000
Total Permian Takeaway - Identified/Likely & Potential1
8,920 8,920 9,255 11,902 12,384 13,773 18,433 19,433 19,933 21,433
Total Estimated Permian Takeaway - Identified/Likely & Potential 2
8,500 8,500 8,633 9,417 9,821 11,352 16,134 17,291 17,948 19,604
Over / (Under) Built 4,533 3,942 3,643 3,534 2,376 2,287 5,701 5,849 5,925 7,233
% utilization 3
47% 54% 58% 62% 76% 82% 65% 66% 67% 63%
Note 1: Reflects 100% of pipeline capacity.
Note 2: Reflects estimates of takeaway capacity incorporated into our analysis. Our takeaway analysis assumes East
Corridor takeaway capacity is equal to 90% of total pipeline capacity. Our analysis of the Mexico Corridor incorporates
25% of total capacity in 2017 based on estimated utilization, increasing to 55% by 2023.
Note 3: Reflects utilization based on our estimates of takeaway capacity incorporated into our analysis.
Source: Company reports, EIA, Bentek, RBN energy, and Wells Fargo Securities, LLC estimates
18. Midstream/MLPs Equity Research
18 | Wells Fargo Securities, LLC
Exhibit 11. Map Of Existing And Future Natural Gas Pipelines In The Permian Basin
Waha
Hub
Katy
Agua
Dulce
EPD/ETP
Gulf Coast
Express (GCX)
ONEOK
Comanche
Trail
Trans-
Pecos
North Corridor
West
Corridor
East
Corridor
Cart-
hage
Permian To
Gulf Coast
Note: Solid lines represent existing systems. Dotted lines represent expansion projects.
Source: EIA, Company reports and Wells Fargo Securities, LLC estimates
19. The Basin Book: Supply Vs. Takeaway Equity Research
Wells Fargo Securities, LLC | 19
Permian: NGLs
20. Midstream/MLPs Equity Research
20 | Wells Fargo Securities, LLC
Permian: NGLs
Key Conclusions. Based solely on existing takeaway and projects under construction, we forecast
Permian NGL takeaway to exceed supply growth over the next five years. Utilization is projected to
average more than 90% by Q3’21, which suggests that additional takeaway could be required in
2022+. If we assume all potential low-cost expansions and new build pipelines are completed (Shin
Oak, Grand Prix, Sand Hills, West Texas LPG, Permico’s NGL pipeline, Rawhide NGL pipeline, and
South Texas Gateway), we project Permian NGL takeaway to meaningfully exceed supply growth into
the foreseeable future (utilization below 55% longer term).
Production Tracking In Line With Our Forecast. We calculate that Q4’17 Permian NGL production
averaged 790 MBbls/d, in line with our prior forecast of 788 MBbls/d. We are maintaining our long-
term Permian NGL production growth estimates. We forecast that total Permian NGL supply
(production + incoming volumes on MAPL) could increase to ~2,095 MBbls/d by 2023 from 1,075
MBbls/d currently.
Update On New Projects. In the wake of potential newbuild project announcements such as
Permico’s Texas NGL Pipeline, N’Americo’s Rawhide NGL pipeline, and BPL’s South Texas Gateway,
which are competing for commitments, Enterprise Products Partners L.P. (EPD) laid out plans to
convert one of its Permian NGL pipelines (Seminole or Chaparral) to crude oil service. The partnership
expects the repurposing to be completed in H1’20. We believe the following pipelines have the
potential for low-cost expansions: Sand Hills, West Texas LPG, Shin Oak, and Grand Prix. These
potential pipelines/expansions are incremental to what is already under construction. On the basis of
our analysis, we think it’s unlikely these pipelines/expansions get built in the near term. We believe a
second wave of NGL pipelines could start construction in the 2020-21 time frame, positioning for
completion in 2023, when takeaway is projected to become tight. A summary of identified/likely
pipelines include the following:
DCP Midstream’s Sandhills Expansion. DCP is overseeing two expansions of its Sandhills system.
The first expansion increases system capacity by 85 Mbbls/d to 365 MBbls/d, while the second takes
capacity up another 85 MBbls/d to 450 MBbls/d. We have assumed 20-30% of the incremental
capacity from these two expansions is used to transport NGLs from the Eagle Ford shale, leaving
around 140 MBbls/d of the incremental capacity available to transport Permian NGLs. The expansions
are expected to be complete by early 2018 and Q3’18, respectively.
Shin Oak - EPD is in the process of constructing a new 571-mile NGL pipeline between the Hobb’s
fractionation facility in the Permian Basin and Mont Belvieu. The 24-inch pipeline is to have an initial
capacity of 250 MBbls/d (expandable to 600 MBbls/d), of which we estimate 150-160 MBbls/d is to be
allocated to Permian NGLs, with the balance transporting NGLs from EPD’s processing plants in the
Rockies. The pipeline is to transport both y-grade NGLs and purity NGL products from Hobbs. Shin
Oak is expected to be in service in Q2’19.
Grand Prix – Grand Prix is a joint venture between Targa Resources Corp (TRGP; 75% interest) and
Blackstone (25% interest). The y-grade NGL pipeline is to have a capacity of 300 MBbls/d
(expandable to 550 MBbls/d) and run from the Permian Basin to Mont Belvieu, Texas. EagleClaw (a
Blackstone portfolio company) is to be the anchor shipper on the pipeline. We believe future NGL
production from Eagle Claw’s 275,000-acre position in the Delaware Basin will flow on Grand Prix,
while existing volumes will be transported to market on ETP’s NGL pipeline network. Grand Prix is
expected to be completed in Q2’19.
EPIC Pipeline - In late September, EPIC announced plans to construct a 650-mile NGL pipeline from
the Permian Basin and Eagle Ford Shale to the Corpus Christi area, where an EPIC affiliate intends to
build multiple fractionators. The pipeline is expected to have an initial capacity of at least 220 MBbls/d
and is to be anchored by commitments from BP Energy. We’ve assumed 70% of total pipeline
capacity is used to transport Permian NGLs, with the balance allocated to Eagle Ford NGLs. The
pipeline is expected to run parallel with EPIC’s crude oil Permian line. EPIC is a private company
formed by TexStar Midstream Logistics, LP and TexStar Midstream Services, LP. EPIC is expected to
be in-service in early 2018 and fully complete in 2019.
West Texas LPG Expansion. On 10/23/17, OKE and MMLP announced plans to expand the West
Texas LPG pipeline system by 40 MBbls/d and extend the pipeline into the Delaware Basin via a 110
MBbls/d lateral. OKE intends to sign additional customers and scale capacity of the West Texas LPG
mainline higher as new contracts are signed in the Delaware. This suggests an additional 70 MBbls/d
of potential expansion capacity above what’s already been announced. The expansion is expected to
be complete by Q3’18.
24. Midstream/MLPs Equity Research
24 | Wells Fargo Securities, LLC
Exhibit 16. Map Of Existing And Future NGL Pipelines In The Permian Basin
Mont
Belvieu
Sweeny
Hobbs
Midland
Corpus Christi
Note: Solid lines represent existing systems. Dotted lines represent expansion projects.
Source: Wells Fargo Securities, LLC
25. The Basin Book: Supply Vs. Takeaway Equity Research
Wells Fargo Securities, LLC | 25
Permian: Processing
26. Midstream/MLPs Equity Research
26 | Wells Fargo Securities, LLC
Permian: Processing
Key Conclusions. We project processing capacity in the Delaware and Midland Basins to become
tight by mid-2023 and mid-2019, respectively. In the Delaware, we project 4.9 Bcf/d of gross natural
gas production growth over the next five years (Q4’17-Q4’22E), which compares to 4.0 Bcf/d of
identified processing capacity expansions. In the Midland, we project 3.3 Bcf/d of gross natural gas
production growth over the next five years, which compares to 0.8 Bcf/d of identified processing
capacity expansions. Both regions will likely require additional processing capacity, but the majority of
the anticipated capacity addition announcements in the near term will likely be in the Midland basin.
In the Midland, we see the need for up to 1.4 Bcf/d of processing expansions, or around 7 additional
processing plants representing ~$1.2B of potential investments.
Production Outpacing Our Forecast. According to the EIA, gross natural gas production in the
Permian in Q4’17 averaged 9.2 Bcf/d, which was 3.8% above our forecast of 8.9 Bcf/d. Based on the
average forecasts from Bentek, RBN Energy, and a number of company reports, we have raised our
Q4’18 forecast by 5.6% and our 3-year production compound annual growth rate (CAGR - 2017E-
2020E) to 21.0% versus 16.9% previously. In addition, we have extended our production and
demand forecasts to 2023 and now estimate 2023 gross production of approximately 17.7 Bcf/d.
Update On Potential Plant Expansions/Additions. Currently, there are 26 processing plants that
are under construction or have been announced in the Permian, including 20 in the Delaware and 6 in
the Midland. Of the top five companies by processing capacity, EPD, TRGP, and WES are currently
adding the most capacity. EPD is building three plants with a combined 900 MMcf/d of capacity at its
Orla complex in Reeves County, TX (Delaware Basin), TRGP is constructing two plants in the Delaware
and one in the Midland with a combined gross capacity of 650 MMcf/d, and WES is building two plants
in the Delaware with a total of 400 MMcf/d of capacity. In aggregate, the 26 projects in development
represent 4.8 Bcf/d of additional processing capacity in the Permian. Based on construction time lines
provided by the operators, all 26 plants are expected to be placed in service by mid-2019.
27. The Basin Book: Supply Vs. Takeaway Equity Research
Wells Fargo Securities, LLC | 27
Supporting Charts
Exhibit 17. Total Midland Gas Volumes Versus Processing Capacity
0
1,000
2,000
3,000
4,000
5,000
6,000
7,000
8,000
9,000 Q1'14A
Q2'14A
Q3'14A
Q4'14A
Q1'15A
Q2'15A
Q3'15A
Q4'15A
Q1'16A
Q2'16A
Q3'16A
Q4'16A
Q1'17A
Q2'17E
Q3'17E
Q4'17E
Q1'18E
Q2'18E
Q3'18E
Q4'18E
Q1'19E
Q2'19E
Q3'19E
Q4'19E
Q1'20E
Q2'20E
Q3'20E
Q4'20E
Q1'21E
Q2'21E
Q3'21E
Q4'21E
Q1'22E
Q2'22E
Q3'22E
Q4'22E
Q1'23E
Q2'23E
Q3'23E
Q4'23E
Gas
Production
/
Processing
Capacity
(MMcfe/d)
Existing Processing
Capacity
Production
Processing Plants
Under Construction
Q3'19E+: Processing
constraints
Source: Company data, Platts, EIA, and Wells Fargo Securities, LLC estimates
Exhibit 18. Total Delaware Gas Volumes Versus Processing Capacity
0
2,000
4,000
6,000
8,000
10,000
12,000
Q1'14A
Q2'14A
Q3'14A
Q4'14A
Q1'15A
Q2'15A
Q3'15A
Q4'15A
Q1'16A
Q2'16A
Q3'16A
Q4'16A
Q1'17A
Q2'17E
Q3'17E
Q4'17E
Q1'18E
Q2'18E
Q3'18E
Q4'18E
Q1'19E
Q2'19E
Q3'19E
Q4'19E
Q1'20E
Q2'20E
Q3'20E
Q4'20E
Q1'21E
Q2'21E
Q3'21E
Q4'21E
Q1'22E
Q2'22E
Q3'22E
Q4'22E
Q1'23E
Q2'23E
Q3'23E
Q4'23E
Gas
Production
/
Processing
Capacity
(MMcfe/d)
Existing Processing
Capacity
Production
Processing Plants
Under Construction
Source: Company reports, Platts, EIA, and Wells Fargo Securities, LLC estimates
28. Midstream/MLPs Equity Research
28 | Wells Fargo Securities, LLC
Exhibit 19. Permian Processing Capacity By Company
Permian Processing Capacity By Company Total
Company 2014A 2015A 2016A 2017A 2018E 2019E 2020E Change
Targa Resources 1,095 1,218 1,339 1,517 1,972 2,107 2,107 590
Energy Transfer 931 1,141 1,266 1,666 1,916 1,966 1,966 300
DCP Midstream 1,363 1,463 1,563 1,563 1,563 1,563 1,563 0
Western Gas 300 300 550 750 1,050 1,300 1,300 550
Enterprise Products 170 170 408 445 820 1,270 1,345 900
Occidental 1,051 1,051 1,088 1,126 1,126 1,126 1,126 0
West Texas Gas (Private) 891 891 891 891 891 1,111 1,111 220
Eagle Claw (Private) 120 120 170 420 720 720 720 300
EnLink Midstream 287 343 418 556 693 793 793 238
Lucid Energy (Private) 95 95 95 283 545 545 545 263
Other Companies 1,116 1,399 1,730 2,237 3,873 4,430 4,530 2,293
Total Processing Capacity 7,419 8,191 9,517 11,454 15,169 16,931 17,106 5,653
Delaware Processing Capacity By Company Total
Company 2014A 2015A 2016A 2017A 2018E 2019E 2020E Change
Energy Transfer 831 906 1,031 1,231 1,331 1,331 1,331 100
Western Gas 300 300 550 750 1,050 1,300 1,300 550
Enterprise Products 170 170 408 445 820 1,270 1,345 900
Eagle Claw (Private) 120 120 170 420 720 720 720 300
Targa Resources 405 405 416 505 738 800 800 295
Other Companies 1,399 1,615 2,042 2,682 4,485 5,115 5,215 2,533
Total Processing Capacity 3,225 3,516 4,617 6,034 9,144 10,536 10,711 4,678
Midland Processing Capacity By Company Total
Company 2014A 2015A 2016A 2017A 2018E 2019E 2020E Change
Targa Resources 690 813 922 1,012 1,234 1,307 1,307 295
West Texas Gas (Private) 871 871 871 871 871 1,091 1,091 220
DCP Midstream 813 813 813 813 813 813 813 0
Occidental 681 681 681 681 681 681 681 0
Energy Transfer 100 235 235 435 585 635 635 200
Other Companies 1,039 1,262 1,378 1,608 1,841 1,868 1,868 260
Total Processing Capacity 4,194 4,675 4,900 5,420 6,025 6,395 6,395 975
Source for non-covered companies (OXY): For Occidental, processing capacity is based solely on announced expansions
to date.
Source: Company data and Wells Fargo Securities, LLC estimates
33. The Basin Book: Supply Vs. Takeaway Equity Research
Wells Fargo Securities, LLC | 33
Northeast: Natural Gas
34. Midstream/MLPs Equity Research
34 | Wells Fargo Securities, LLC
Northeast: Natural Gas
Key Conclusions. While Northeast production growth has been constrained by pipeline takeaway
(with production increasing in lock-step with new takeaway pipeline additions), this dynamic changed
in H2’17. We estimate that 4.3 Bcf/d of incremental capacity was placed into service in H2’17
compared to production growth of 3.0 Bcf/d in 2017. In addition, we forecast 6.1 Bcf/d of additional
capacity to enter service in 2018E. As a result, we believe there is more than enough pipeline
takeaway capacity to support production growth over the next few years. However, production is
tracking ahead of our prior projections (see below), and we now see the possibility of some takeaway
tightness longer term beginning in 2023. Since our last update in June, the Federal Energy Regulatory
Commission (FERC) reestablished quorum and approved all of the remaining major pipeline projects.
As a result, we expect the near-term conversation to be primarily focused on the potential shifting
time lines of these key projects. While material to E&P 2018-19 drilling budgets and basis differentials
in the near term, we expect these delays to have a minimal impact on the long-term supply-demand
dynamic in the region and forecast average excess takeaway capacity of approximately 6.0 Bcf/d in
2019-2023.
Raising Production Forecasts. Q4’17 production of 25.6 Bcf/d was 7.9% above our forecast of 23.8
Bcf/d. In both the near and long term, production appears to be tracking ahead of our prior forecast.
We have raised our Q4’18 forecast by 6.0% and our 3-year production compound annual growth rate
(CAGR) (2017E-2020E) to 10.9% (vs. 8.8% previously). In addition, we have extended our
production and demand forecasts to 2023 and now estimate 2023 production of approximately 38.7
Bcf/d. Based on this revised production forecast, the basin now appears to get tight by 2023, when
total takeaway of 42.2 Bcf/d implies basin utilization of 90%. Over the course of 2017, the rig count
and drilling activity in the Northeast rebounded, driving production growth of 13%. Production grew
by 3.0 Bcf/d in 2017, compared to 4.3 Bcf/d of incremental capacity placed into service in H2’17.
Update On Identified/Likely Projects. Since our last update in June 2017, the FERC reestablished
quorum on 8/10/17 and subsequently approved the following key projects (in chronological order):
NEXUS Pipeline (8/25/17), Atlantic Coast Pipeline (10/13/17), Mountain Valley Pipeline (10/13/17),
WB Xpress (11/17/17), Gulf Xpress (12/29/17), and PennEast Pipeline (1/19/18). Of these projects,
construction has officially commenced on NEXUS, WB Xpress, and Gulf Xpress. As a result, we have
revised our estimated in-service dates for several key projects, including Rover Pipeline Phase 2
[Q2’18 vs. Q1’18 previously, due to the FERC-mandated halt to certain HDD operations], Atlantic
Sunrise (Q3’18 vs. Q2’18, based on management commentary), PennEast Pipeline (Q2’19 vs. Q4’18
previously, due to uncertainty around the timing of the receipt of key permits), and Northern Access
2016 (Q1’20 vs. Q1’18). We see the potential for delays on several of the projects, due to numerous
issues including the issuance of state permits, tree-felling seasons, the mountainous terrain, and
availability of construction crews as reflected in the recent rising costs of projects.
35. The Basin Book: Supply Vs. Takeaway Equity Research
Wells Fargo Securities, LLC | 35
Supporting Charts
Exhibit 24. Northeast Natural Gas Takeaway Chart – Identified/Likely Pipelines
0
10,000
20,000
30,000
40,000
50,000
2014A 2015A 2016A 2017A 2018E 2019E 2020E 2021E 2022E 2023E
Natural
Gas
Production
/
Takeaway
Capacity
(MMcf/d)
Local Demand
Existing Pipelines
Identified / Likely
Pipelines
Production
Source: Company data, EIA, and Wells Fargo Securities, LLC estimates
NOTE: Our production estimate is based on the average forecasts from Bentek, RBN Energy, and company reports.
Exhibit 25. Northeast Natural Gas Takeaway Chart – Identified/Likely & Potential
Pipelines/Expansions
0
10,000
20,000
30,000
40,000
50,000
2014A 2015A 2016A 2017A 2018E 2019E 2020E 2021E 2022E 2023E
Natural
Gas
Production
/
Takeaway
Capacity
(MMcf/d)
Local Demand
Existing Pipelines
Identified / Likely
Pipelines
Production
Potential Pipelines
/ Expansions
Source: Company data, EIA, and Wells Fargo Securities, LLC estimates
NOTE: Our production estimate is based on the average forecasts from Bentek, RBN Energy, and company reports.
36. Midstream/MLPs Equity Research
36 | Wells Fargo Securities, LLC
Exhibit 26. Tariffs And Netbacks On Existing/Potential Northeast Gas Takeaway Pipelines
System / Netback
Pipeline / System Corridor Operator Type Origin Destination Best Worst
TGP Gulf Coast KMI TGP OH, PA, WV LA, MS $1.89 $0.35 $1.54
TETCO (Utica) Gulf Gulf Coast SEP TETCO OH, KY LA $1.72 $0.39 $1.33
TETCO (Utica) East East SEP TETCO OH NJ $1.37 $0.34 $1.03
Transco East East WPZ TRANSCO Leidy, PA NYC $0.69 $0.14 $0.55
TGT Gulf Coast BWP TGT Lebanon, OH LA $0.72 $0.37 $0.36
Transco Gulf Southeast WPZ TRANSCO Leidy, PA LA $0.61 $0.50 $0.11
CGT Gulf Coast TRP CGT TCO Pool Gulf Coast $0.20 $0.15 $0.05
TETCO (Marcellus) Gulf Gulf Coast SEP TETCO PA LA $0.35 $0.49 ($0.14)
TETCO (Marcellus) East East SEP TETCO PA NJ $0.00 $0.19 ($0.19)
Average Legacy Systems $0.84 $0.32 $0.52
TGP Utica Backhaul Gulf Coast KMI Brownfield Mercer, PA Gulf Coast $1.89 NA NA
CGT West Side Expansion (Line 100)
Gulf Coast TRP Brownfield Leach, KY Gulf Coast $0.20 NA NA
ANR Lebanon Lateral Midwest SEP Brownfield Lebanon, OH Sulphur Springs, IN $1.63 NA NA
TGP Niagara Expansion Canada KMI Brownfield Northwest PA Niagara, NY $1.95 $0.27 $1.68
TCO East Side Expansion Southeast TRP Brownfield Milford, PA NJ/MD $1.97 $0.37 $1.60
TETCO TEAM 2014 - East East SEP Brownfield PA NJ $1.80 $0.32 $1.48
TETCO TEAM South Gulf Coast SEP Brownfield PA Gulf Coast $1.72 $0.32 $1.40
TETCO TEAM 2014 - South Gulf Coast SEP Brownfield OH Gulf Coast $1.72 $0.32 $1.40
TETCO Uniontown to Gas City Midwest SEP Brownfield Uniontown, PA Gasy City, IN $1.63 $0.37 $1.26
NFG Northern Access 2015 Canada NFG Brownfield Northeast PA Canada $0.67 $0.27 $0.40
REX Seneca Lateral Midwest TEP Greenfield Clarington, OH Indiana $0.63 $0.30 $0.33
REX Seneca Lateral Expansion Midwest TEP Brownfield Clarington, OH Indiana $0.63 $0.30 $0.33
REX Zone 3 East-to-West Reversal
Midwest TEP Brownfield Clarington, OH Audrain Cty, MO $0.63 $0.50 $0.13
TRANSCO Leidy Southeast East WPZ Brownfield Leidy Line East / SouthEast $0.59 $0.70 ($0.11)
TETCO OPEN Gulf Coast SEP Brownfield OH Gulf Coast $0.35 $0.56 ($0.20)
TGP Broad Run Flexibility Gulf Coast KMI Brownfield West Virginia Gulf Coast $0.72 $1.01 ($0.29)
TRANSCO Virginia Southside Southeast WPZ Brownfield St. 210 VA ($0.10) $0.62 ($0.72)
Average First Wave Of Expansion Projects $1.10 $0.45 $0.62
Gulf Markets Gulf Coast SEP Brownfield OH Gulf Coast $1.72 $0.32 $1.40
Northern Supply Access Midwest BWP Brownfield Lebanon, OH Gulf Coast $1.72 $0.34 $1.38
Adair Southwest Gulf Coast SEP Brownfield OH Gulf Coast $1.72 $0.40 $1.32
Rover Pipeline Midwest ETP Greenfield Carroll Cty, OH Michigan $1.78 $0.65 $1.13
Access South Gulf Coast SEP Brownfield OH Gulf Coast $1.72 $0.64 $1.08
NEXUS Pipeline Midwest SEP Greenfield Columbiana Cty, OH Michigan $1.78 $1.03 $0.75
WB Xpress Southeast TRP Brownfield West Virginia Virginia $0.80 $0.25 $0.55
PennEast Pipeline East UGI Greenfield Luzerne Cty, PA Mercer Cty, NJ $0.69 $0.52 $0.17
Northern Access 2016 Canada NFG Greenfield McKean Cty, PA Canada / Wright, NY $0.53 $0.39 $0.14
Constitution Pipeline East WPZ Greenfield Susquehanna Cty, PA Wright, NY $0.76 $0.65 $0.11
Zone 3 Capacity Enhancement Midwest TEP Brownfield Clarington, OH Moultrie Ct, IL $0.63 $0.55 $0.08
Rayne Xpress Gulf Coast TRP Brownfield Leach, KY Gulf Coast $0.20 $0.14 $0.06
Leidy South Southeast D Brownfield Leidy, PA Loudoun, Virginia $0.59 $0.71 ($0.12)
New Market East D Brownfield Leidy, PA Schenectady Cty, NY $0.62 $0.76 ($0.14)
Gulf Xpress Gulf Coast TRP Brownfield Leach, KY Gulf Coast $0.20 $0.38 ($0.18)
Atlantic Sunrise Southeast WPZ Greenfield Columbia Cty, PA Choctaw Cty, AL $0.59 $0.80 ($0.21)
Mountain Valley Pipeline Southeast EQM Greenfield Wetzel Cty, WV Pittsylvania Cty, VA $0.70 $0.97 ($0.27)
Virginia Southside II Southeast WPZ Brownfield St. 210 VA ($0.10) $0.46 ($0.56)
Dalton Lateral Southeast WPZ Brownfield St. 210 GA ($0.10) $0.53 ($0.63)
Broad Run Expansion Gulf Coast KMI Brownfield West Virginia Gulf Coast $0.20 $1.01 ($0.81)
Atlantic Coast Pipeline Southeast D Greenfield Harrison Cty, WV VA/NC $0.70 $1.75 ($1.05)
Average Potential Export Pipeline Projects $0.83 $0.63 $0.20
Average for all projects $0.93 $0.51 $0.40
Second
Wave
Of
Expansion
Projects
First
Wave
Of
Expansion
Projects
Net Back Calculation ($/MMBtu)
Basis Differential
(Destination -
Origin)
(-) Committed
Tariff
(=)
Legacy
Systems
Note 1: All tariffs reflect export-bound flow on pipelines (i.e., from Marcellus-Utica to destination)
Note 2: Prices reflect median for 2017 given wide seasonal fluctuations in daily prices
Source: Bloomberg, Company reports, FERC filings, and Wells Fargo Securities, LLC
37. The
Basin
Book:
Supply
Vs.
Takeaway
Equity
Research
37
|
Wells
Fargo
Securities,
LLC
Exhibit 27. Regulatory Time Line of Major Marcellus-Utica Natural Gas Pipeline Projects
Major Milestones In Project Timeline1
Major Docket FERC FERC FERC FERC FERC Construction
Marcellus/Utica Projects Operator Number Pre-Filing Application NOS1
Draft EIS1
Final EIS/EA Permit In Service
DTI New Market Project D CP14-497 NA 06/02/14 08/04/15 10/20/15 04/28/16 03/17/17 Q4'17
PennEast Pipeline UGI CP15-558 10/17/14 09/24/15 03/29/16 07/22/16 04/07/17 Q2'18E Q2'19E
Constitution Pipeline WPZ CP13-499 04/05/12 06/13/13 09/07/12 02/12/14 10/24/14 NA Q4'18E
NFG Northern Access 2016 NFG CP15-115 07/01/14 03/17/15 04/14/16 NA 07/27/16 NA Q1'20E
Rover Pipeline ETP CP15-93 06/25/14 02/20/15 11/09/15 02/19/16 07/29/16 03/03/17 l Q2'18E
REX Zone 3 Cap. Enhancement TEP CP15-137 NA 03/31/15 07/09/15 NA 08/31/15 03/08/16 Q1'17
TGT Northern Supply Access BWP CP15-513 NA 06/05/15 12/23/15 NA 01/27/16 06/03/16 Q1'17
NEXUS Pipeline SEP CP16-22 01/09/15 11/20/15 05/17/16 07/08/16 11/30/16 10/11/17 Q3'18E
TETCO Gulf Markets Exp. I SEP CP15-90 NA 02/19/15 08/18/15 NA 10/05/15 02/05/16 Q4'16
TETCO Gulf Markets Exp. II SEP CP15-90 NA 02/19/15 08/18/15 NA 10/05/15 02/05/16 Q3'17
CGT Rayne Xpress TRP CP15-539 NA 07/29/15 02/10/16 NA 09/01/16 02/03/17 Q4'17
TETCO Access South SEP CP16-3 03/31/15 10/08/15 07/12/16 NA 08/08/16 01/19/17 Q4'17
TETCO Adair Southwest SEP CP16-3 03/31/15 10/08/15 07/12/16 NA 08/08/16 01/19/17 Q4'17
TGP Broad Run Expansion KMI CP15-77 NA 01/30/15 12/18/15 NA 03/11/16 12/07/16 Q2'18E
CGT Gulf Xpress TRP CP16-361 NA 04/29/16 09/14/16 02/27/17 07/28/17 Q1'18E Q4'18E
DTI Leidy South Project D CP15-492 NA 05/15/15 02/18/16 NA 03/30/16 10/05/16 Q4'17
Transco Dalton Lateral WPZ CP15-117 April 2014 03/19/15 03/07/16 NA 03/31/16 08/15/16 Q3'17
Transco Virginia Southside II WPZ CP15-118 NA 03/23/15 03/07/16 NA 05/13/16 10/05/16 Q4'17E
Transco Atlantic Sunrise WPZ CP15-138 Spring 2014 03/31/15 03/09/16 05/01/16 12/30/16 03/16/17 Q3'18E
Mountain Valley Pipeline EQM CP16-10 10/27/14 10/23/15 06/28/16 09/16/16 06/23/17 Q1'18E Q2'19E
TCO WB Xpress TRP CP16-38 04/16/15 12/30/15 NA 01/15/16 03/24/17 12/04/17 Q4'18E
Atlantic Coast Pipeline D CP15-554 11/13/14 09/18/15 08/12/16 12/30/16 07/21/17 Q1'18E Q4'19E
Note 1:
Pre-Filing - An optional stage in the process, which allows the FERC to review the project and point to any potential issues ahead of the application.
Application - a document that provides information on the proposed facilities, need for the project, agreements with shippers, costs/revenues/tariffs, compliance with National Environmental
Notice Of Schedule (For Environmental Impact Statement Or Environmental Assessment) - the FERC typically issues its NOS within 90 days of sending a notice of application.
Environmental Impact Statement - mostly applicable to greenfield projects (brownfield projects require an Environmental Assessment).
Permit - dates to the right of a green check reflects the date of receipt of the notice to proceed or the official commencement of construction; dates to the right of red "x" reflect either the 90
Note 2: Green check () signifies completion of milestone, red "x" () signifies that the pipeline has not completed the milestone.
Source: Company reports, FERC and Wells Fargo Securities, LLC
39. The Basin Book: Supply Vs. Takeaway Equity Research
Wells Fargo Securities, LLC | 39
Northeast: NGLs
40. Midstream/MLPs Equity Research
40 | Wells Fargo Securities, LLC
Northeast: NGLs
Key Conclusions. Ethane. Based solely on existing takeaway and projects under construction, we
forecast ethane takeaway capacity out of the Northeast region (Marcellus/Utica) to be constrained
over the next five years, resulting in some level of continued ethane rejection. Our analysis assumes
a 50% utilization rate on ME2/ME2X as visibility into the project’s contractual structure, split between
NGLs and refined products, and downstream infrastructure buildout are all uncertain at this juncture.
If we assume all potential projects under evaluation are constructed (and ME2/ME2X runs full with
100% of the capacity used for NGLs), we project ethane takeaway to be tight through mid-2019, but
sufficient thereafter. This could support full ethane recovery assuming a long-term ethane price of at
least $0.35-0.40/gallon.
Propane+. For propane+ (propane, normal butane, iso-butane, and natural gasoline), takeaway
capacity is currently very tight, resulting in continued NGL by rail movements. Takeaway is projected
to remain tight even as new identified projects are placed into service (Mariner East 2/2X – at 50%
utilization). However, if we assume ME2/2X runs at full capacity (100% of capacity used for NGLs)
and EPD’s potential Centennial project is completed, we believe takeaway capacity for propane+ will
be sufficient starting in 2019.
Production Tracking Below Our Forecasts. We calculate that Q4 Marcellus/Utica NGL production
averaged 593 MBbls/d, around 5% below our forecast. We’ve slightly reduced our estimates and now
project that Northeast NGL production could increase to approximately 985 MBbls/d by 2022 (versus
our previous estimate of 1,000 MBbls/d).
Update On Identified/Likely Projects. As noted, the biggest variable in our Northeast NGL
takeaway analysis is Mariner East 2/2X. In January, Pennsylvania’s Department of Protection
suspended ME2’s construction. ETP must submit details on how it plans to prevent further drilling mud
leakage. Given continued delays with construction, we have revised our in-service targets to Q4’18 for
ME2 and Q4’19 for ME2X. We also continue to assume only 50% of the projects’ stated capacities
(275 MBbls/d for ME2 and 250 MBbls/d for ME2X) are available for NGL takeaway given that a portion
of the pipeline could be used to transport refined products and details around contractual structure is
limited.