Downloaded 37 times


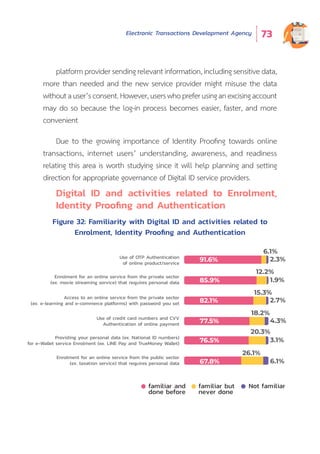
![Electronic Transactions Development Agency 29
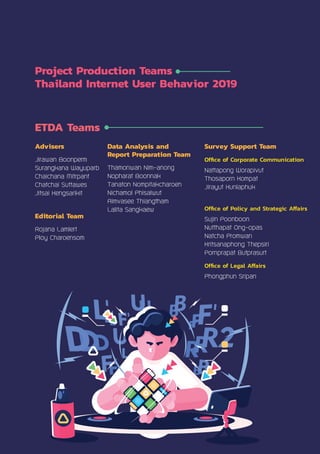
Internet User Behavior
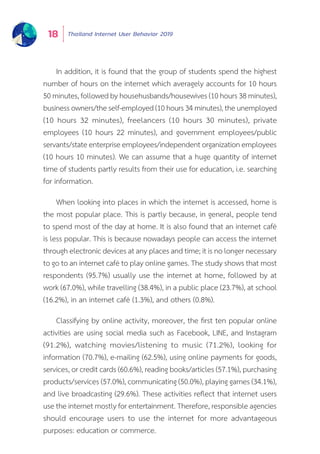
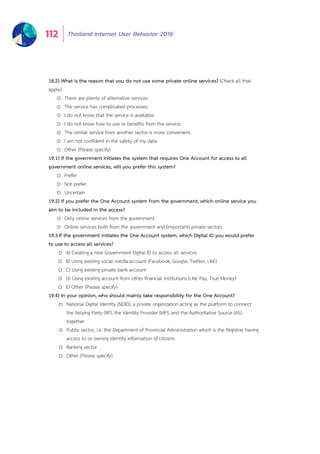
Nowadays we are completely living in the digital society which
everything changes by leaps and bounds, more people can easily access
to the internet, and the internet user behaviors alter through time. In 2018,
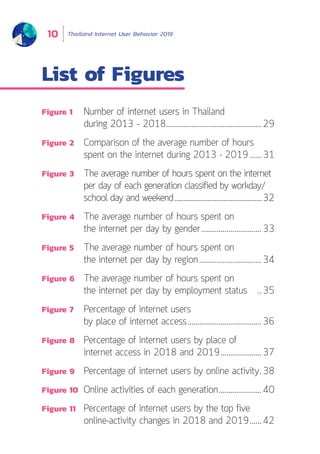
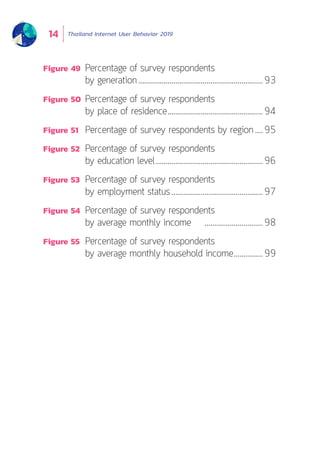
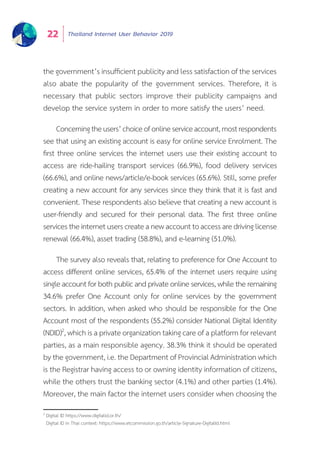
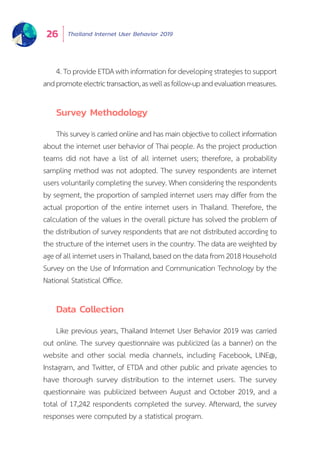
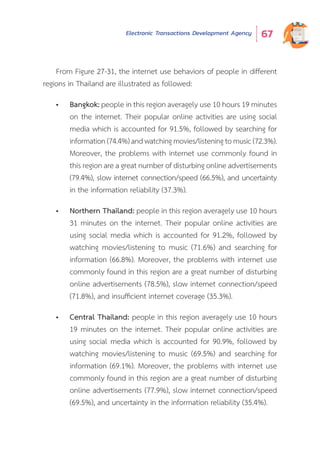
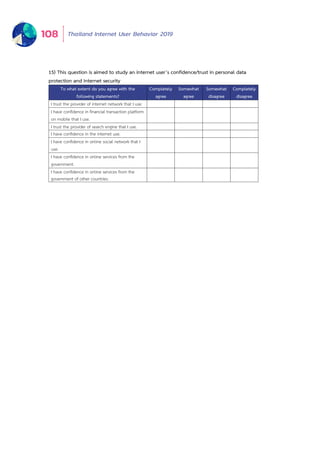
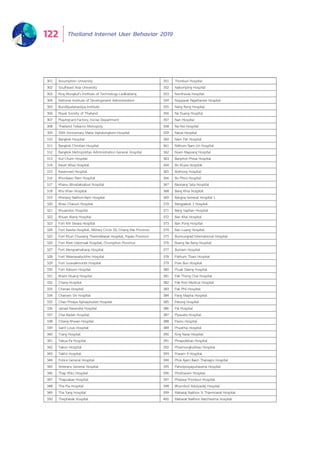
there are 47.5 million internet users in Thailand4
, accounting for 71.5% of
the entire population in Thailand (66.4 million)5
. This shows the high growth
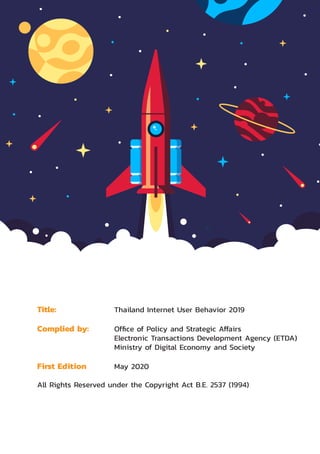
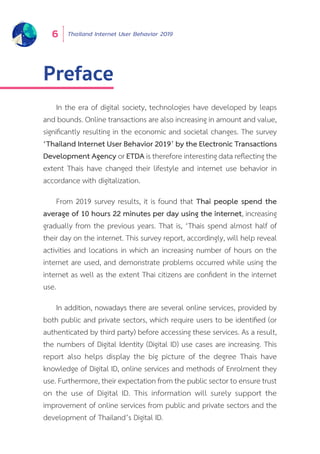
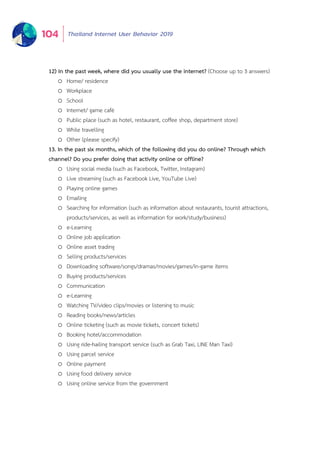
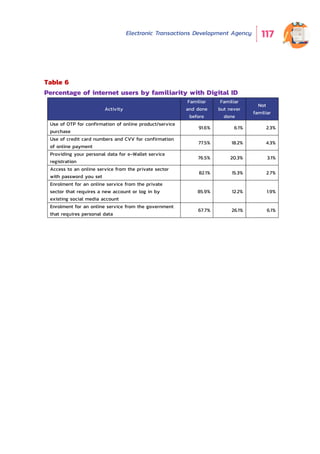
of internet users comparing to that number of 2013 (26.1 million). We can
see that from previous five years the number of internet users in Thailand
has been increasing averagely6
81.5% per year.
4
Number of internet users in Thailand during 2017-2018: http://webstats.nbtc.go.th/netnbtc/INTERNETUSERS.php
5
Number of populations in Thailand in 2018 is referred from Statistical Registration System, Department of
Provincial Administration, http://stat.dopa.go.th/stat/statnew/upstat_age_disp. php
6
CAGR (Compound Annual Growth Rate) has the formula as followed:
CAGR = [ (End year/ First year) ^1/(n-1)] – 1
When End year = data from the latest year, First year = data from the first year, ^ = the exponentiation
operator, n = number of years
Figure 1: Number of internet users in Thailand during 2013 – 2018
0
10
20
30
40
50
Number of internet users (million)
26.1
2013 2014 2015 2016 2017 2018
27.7
39.5
43.9
45.2
47.5](https://image.slidesharecdn.com/thailandiub2019byetdaen-200529093806/85/Thailand-Internet-User-Behavior-2019-30-320.jpg)
![Electronic Transactions Development Agency 31
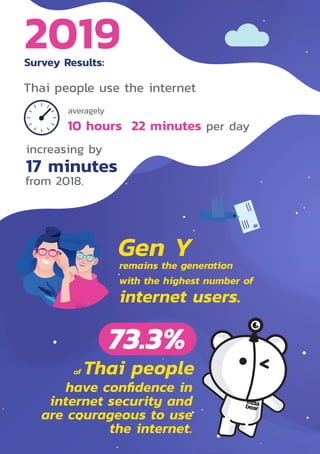
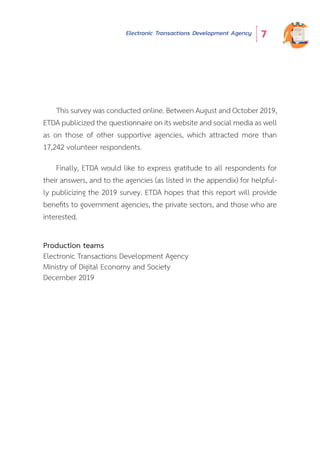
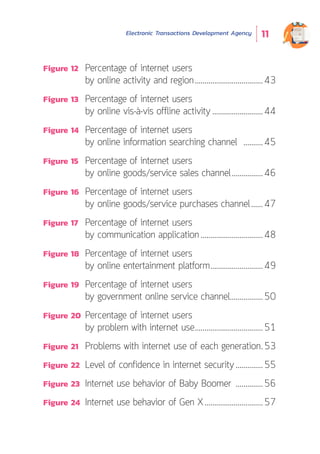
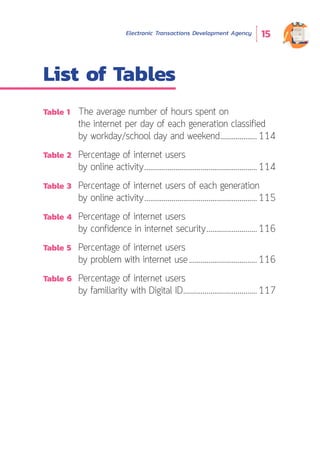
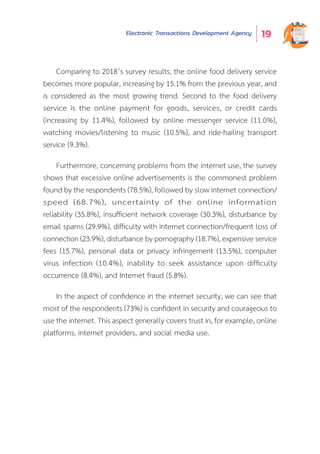
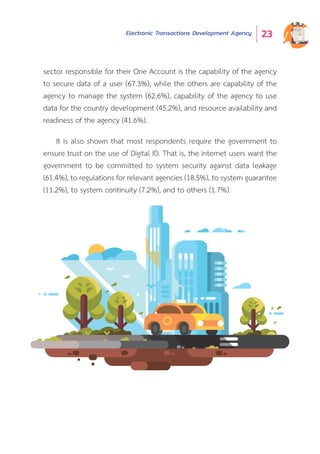
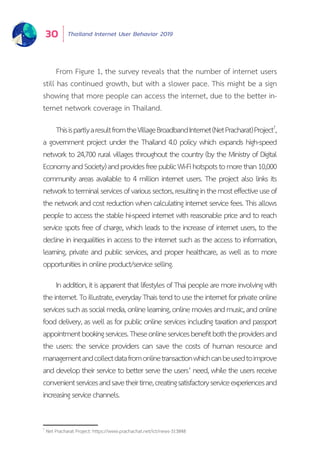
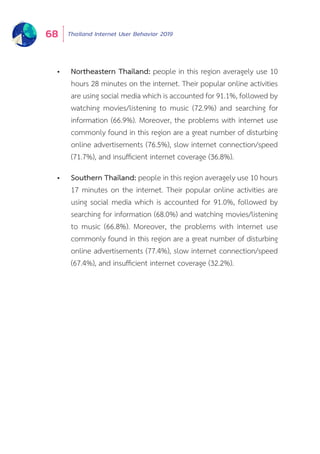
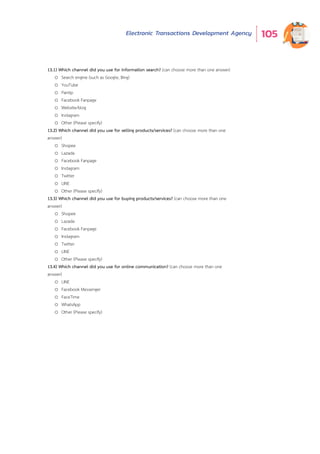
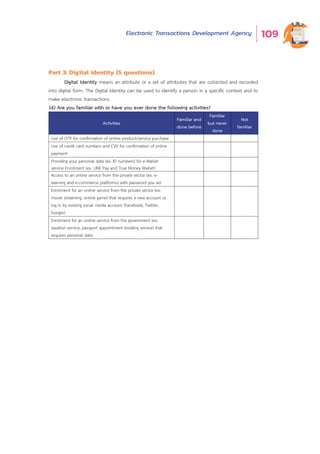
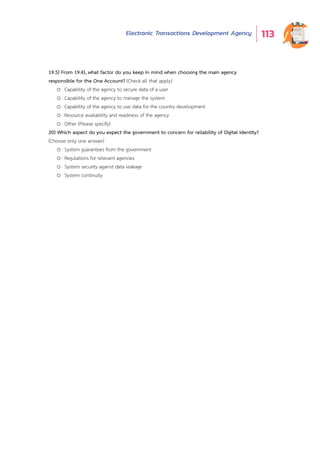
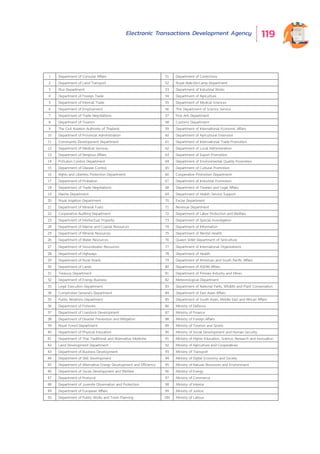
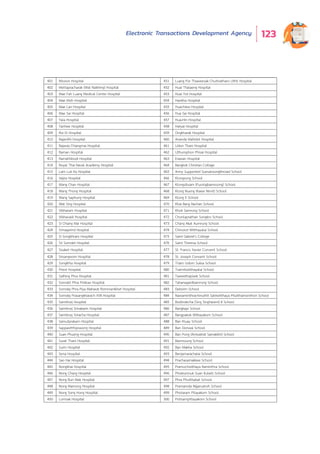
2013 2014 2015 2016 2017 2018 2019
4 hours
36 minutes
7 hours
12 minutes
6 hours
54 minutes 6 hours
24 minutes
6 hours
35 minutes
10 hours
5 minutes
10 hours
22 minutes
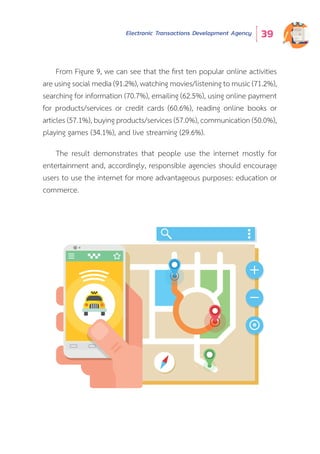
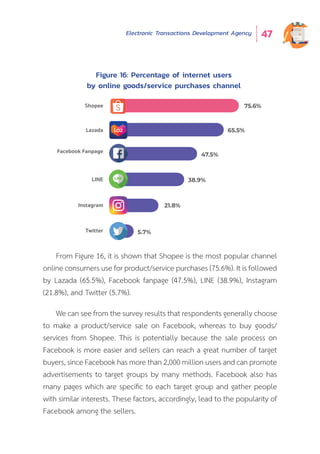
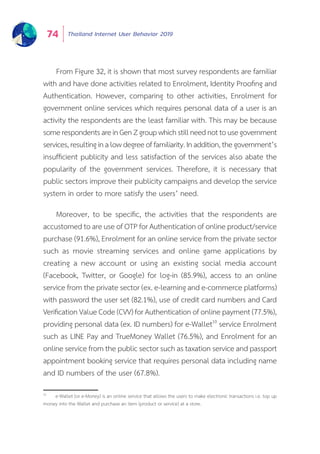
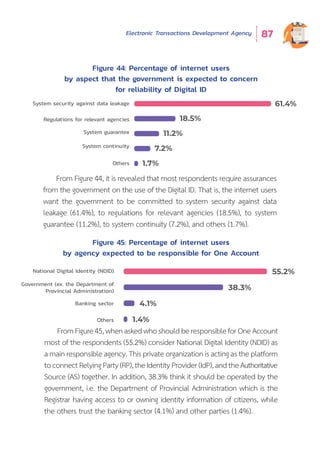
From Figure 2, the number of hours spent on the internet in Thailand
generally tends to increase with the average growth8
of 14.5% per year.
This rate is considerably high, and partly due to the expanding use of the
internet in every aspect of daily life.
8
CAGR (Compound Annual Growth Rate) has the formula as followed:
CAGR = [ (End year/ First year) ^1/(n-1)] – 1
When End year = data from the latest year, First year = data from the first year, ^ = the exponentiation
operator, n = number of years
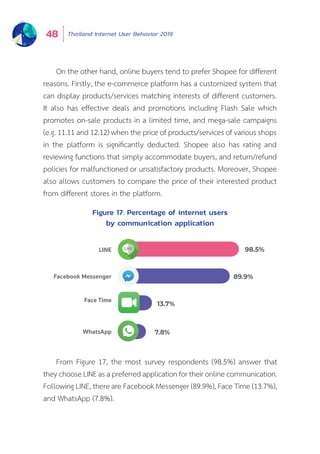
Furthermore, Different devices for the internet access are currently
availableinthemarketincludingmobilephones,notebooks,andcomputers,
and their price tends to be lower due to the increase of businesses and
services, high level of industry competition, and the lower cost to manufac-
ture the technological devices. Another factor, in addition, enabling more
peopletoaccesstheinternetisthatmanynetworkprovidershavelaunched
tempting internet promotions which attract more internet users.
Number of Hours Spent on the Internet
Figure 2 : Comparison of the average number of hours spent
on the internet during 2013 - 2019](https://image.slidesharecdn.com/thailandiub2019byetdaen-200529093806/85/Thailand-Internet-User-Behavior-2019-32-320.jpg)
![Thailand Internet User Behavior 201932
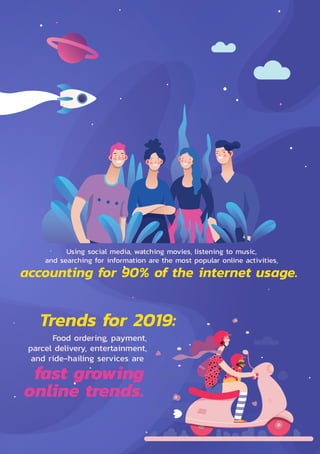
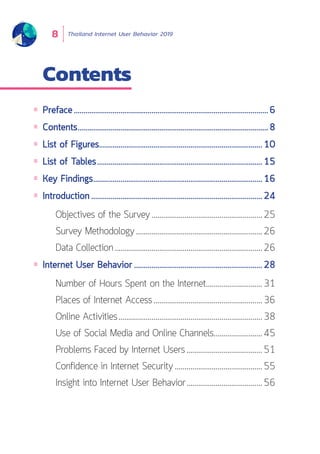
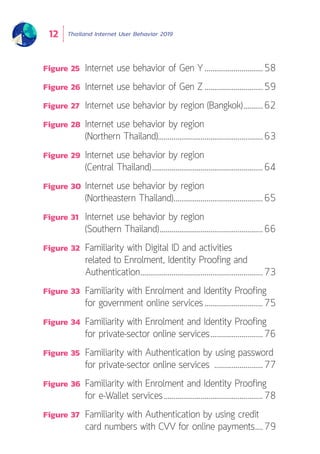
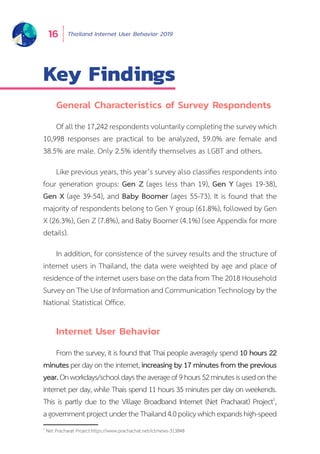
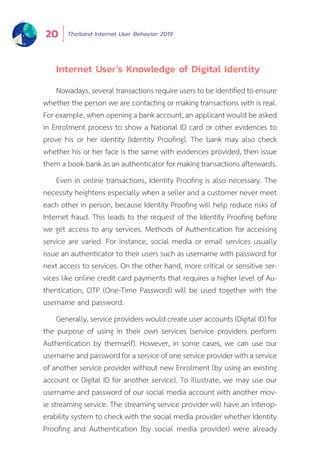
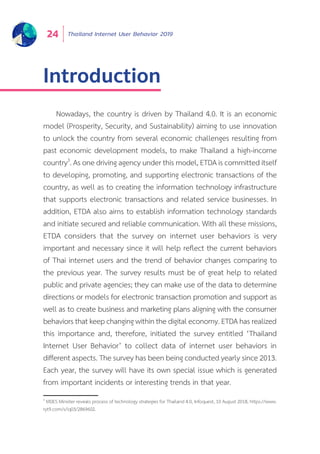
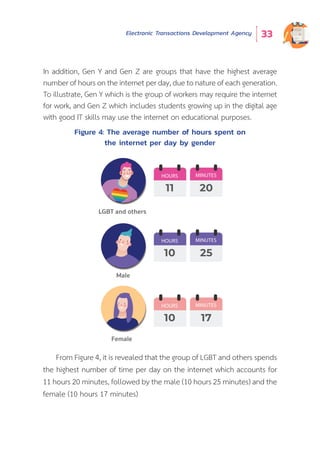
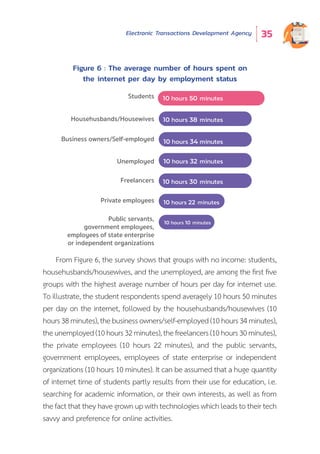
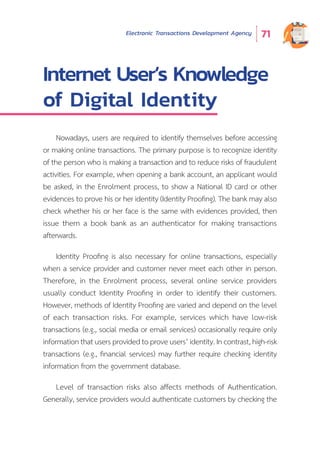
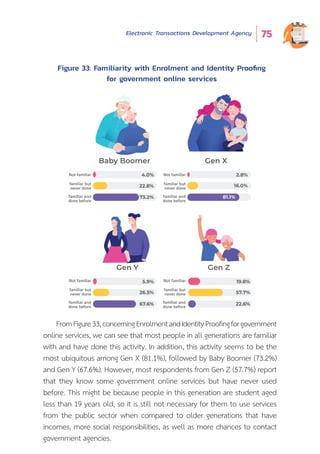
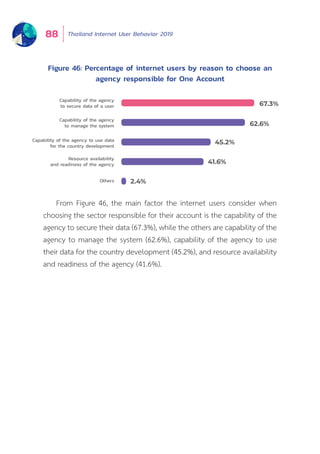
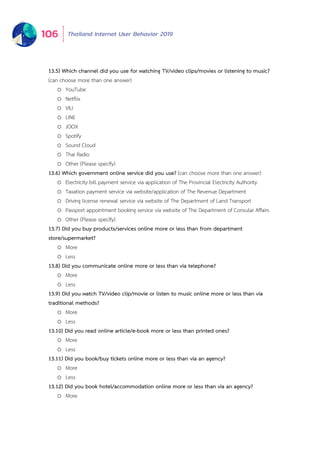
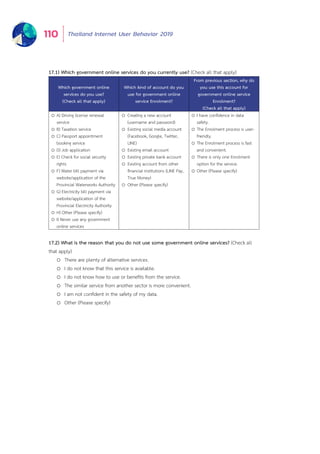
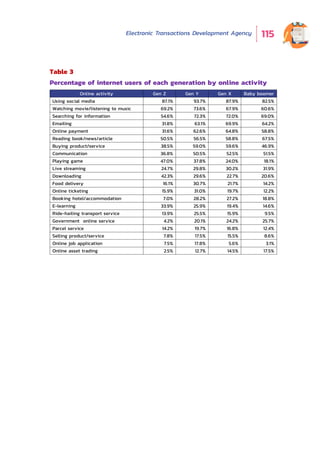
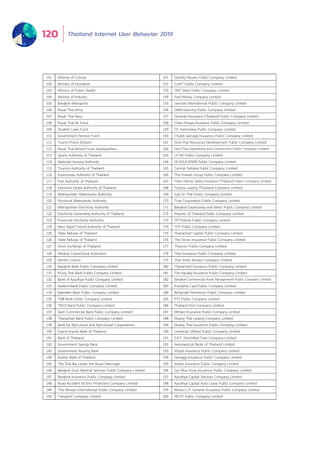
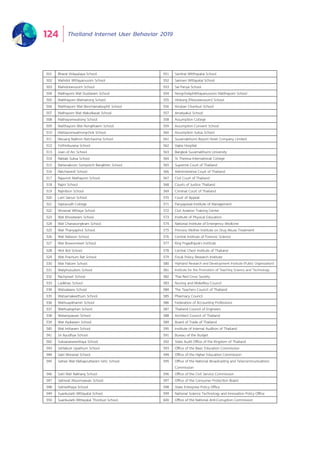
Figure 3: The average number of hours spent on
the internet per day of each generation classified
tvby workday/school day and weekend
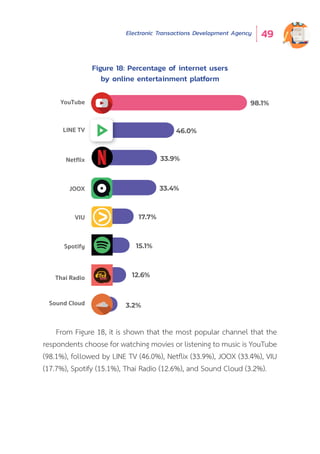
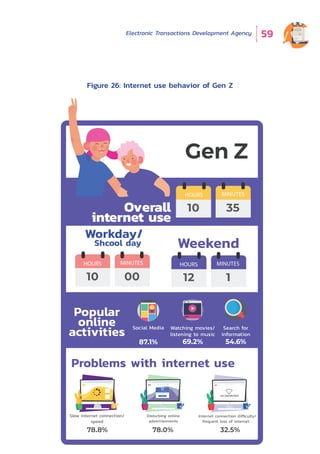
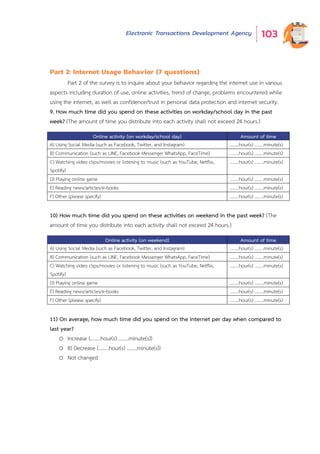
From Figure 3, it is found that Thai internet users averagely spend 10
hours 22 minutes per day on the internet9
, increasing by 17 minutes
from 2018. They spend 9 hours 52 minutes on the internet on workdays/
school days, and 11 hours 35 minutes on weekends. Looking into each
generation, the survey shows that the number of hours spent on the
internet of Gen Y (10 hours 36 minutes) outnumbers that of other
generations. Second to Gen Y is Gen Z (10 hours 35 minutes), followed by
Baby Boomer (10 hours) and Gen X (9 hours 49 minutes).
9
The average number of hours spent on the internet is the weighted average from the number of days on
workdays/school days (5 days) and weekends (2 days).The average number of hours spent on the internet =
[(hours on workdays/school days * 5) + (hours on weekends * 2)] / 7
HOURS MINUTES
9 52
HOURS MINUTES
11 35Weekend /
day
HOURS MINUTES
10 22
Average use
of the internet
per day in
2019Workday
School day day
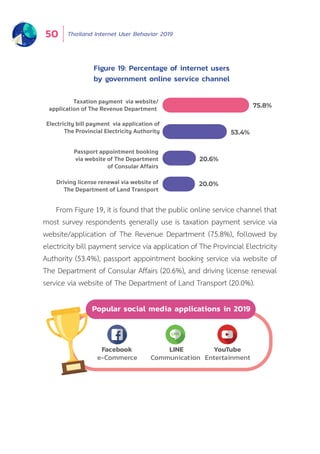
Overview
of the internet use
Baby Boomer Gen X Gen Y Gen Z
HOURS MINUTES
9 35
HOURS MINUTES
11 3
HOURS MINUTES
9 20
HOURS MINUTES
10 58
HOURS MINUTES
10 7
HOURS MINUTES
11 50
HOURS MINUTES
10 00
HOURS MINUTES
12 1
Workday
School day Day
Day
HOURS MINUTES
10 00
HOURS MINUTES
9 49
HOURS MINUTES
10 36
HOURS MINUTES
10 35Average per Day
(increasing 17 minutes from 2018)
Gen Y is the group with the highest number
of hours on the internet for consecutive 5 years
Weekend](https://image.slidesharecdn.com/thailandiub2019byetdaen-200529093806/85/Thailand-Internet-User-Behavior-2019-33-320.jpg)


![Thailand Internet User Behavior 2019114
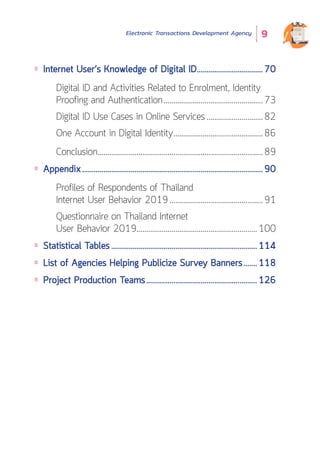
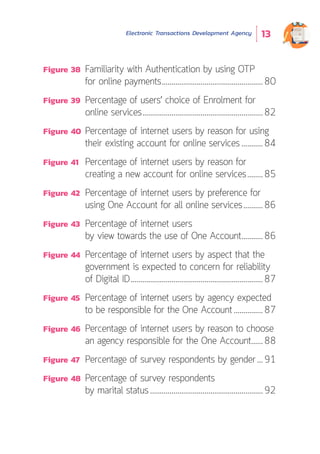
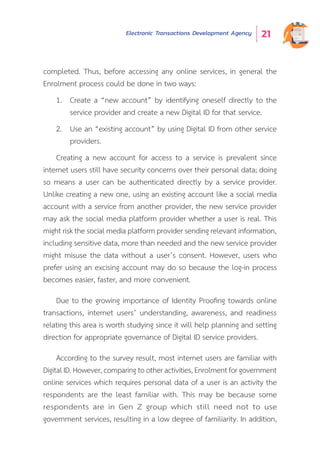
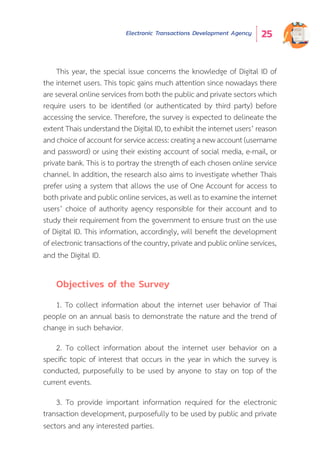
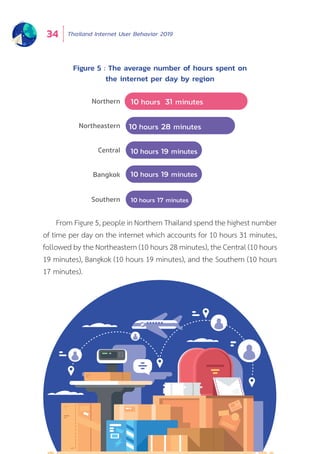
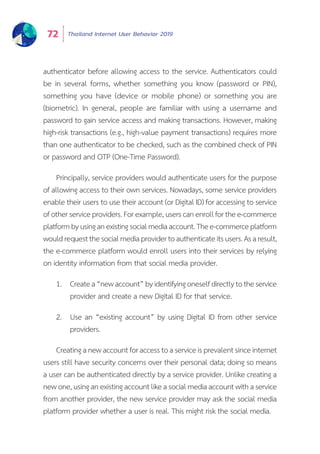
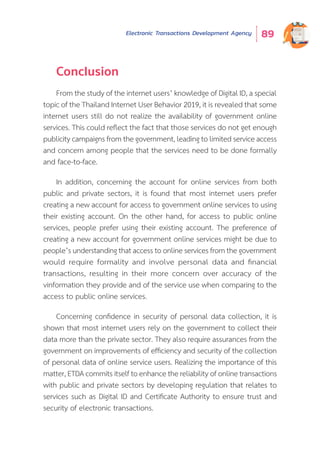
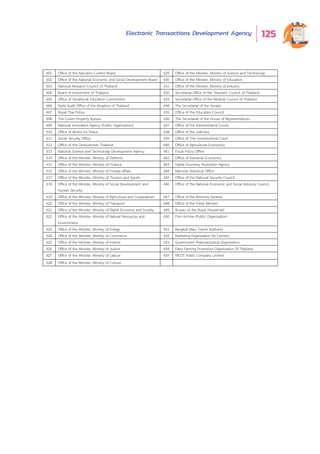
Statistical Tables
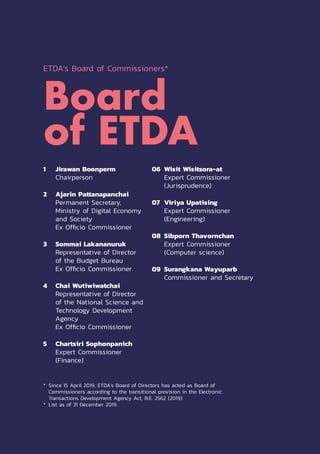
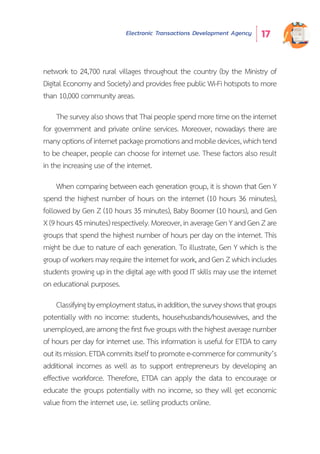
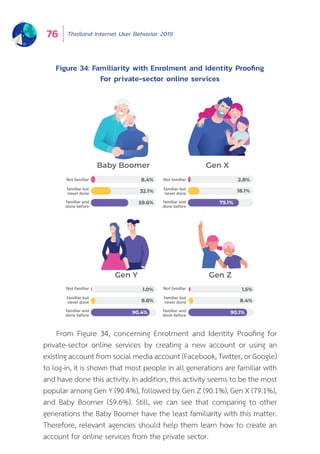
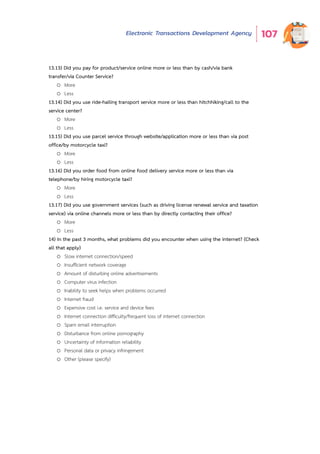
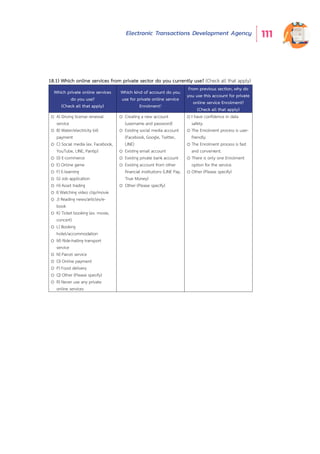
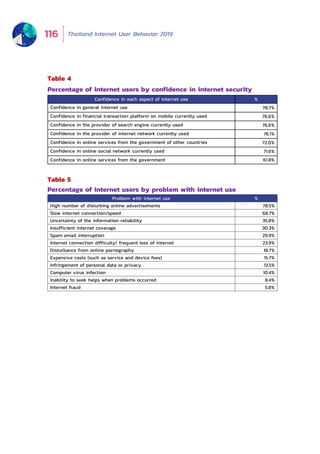
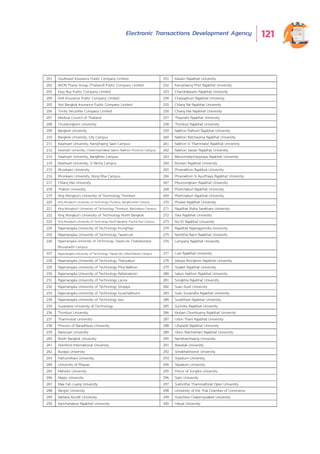
Table 1
The average number of hours spent on the internet per day of each
generation classified by workday/school day and weekend
Table 2
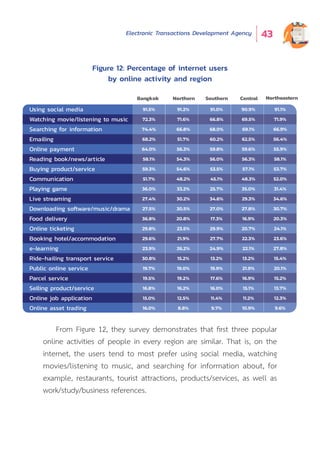
Percentage of internet users by online activity
1 The average number of hours spent on the internet is the weighted average from the number of days on workdays/school days (5 days) and weekends (2 days).
The average number of hours spent on the internet = [(hours on workdays/school days * 5) + (hours on weekends * 2)] / 7
Overall internet use 10 hours 22 minutes
Workday/school day 9 hours 52 minutes
Weekend 11 hours 35 minutes
The amount of time
used on the internet
of each generation
Baby boomer Gen X Gen Y Gen Z
Workday/school day 9 hours 35 minutes 9 hours 20 minutes 10 hours 7 minutes 10 hours
Weekend 11 hours 3 minutes 10 hours 58 minutes 11 hours 50 minutes 12 hours 1 minutes
Average per day 1 10 hours 9 hours 49 minutes 10 hours 36 minutes 10 hours 35 minutes
Details %
Using social media (such as Facebook, Twitter, Instagram) 91.2%
Watching movie/listening to music 71.2%
Searching for information 70.7%
Emailing 62.5%
Online payment 60.6%
Reading book/news/article 57.1%
Buying product/service 57.0%
Communication 50.0%
Playing game 34.1%
Live streaming (such as Facebook live, YouTube Live) 29.6%
Downloading software/music/drama/movie/game/in-game item 28.4%
Food delivery 26.5%
Online ticketing (such as movie, concert ticket) 26.1%
Booking hotel/accommodation 25.9%
E-learning 24.4%
Ride-hailing transport service (such as Grab Taxi, LINE Man Taxi) 21.4%
Government online service 20.1%
Parcel service 18.2%
Selling product/service 15.9%
Online job application 13.2%
Online asset trading 12.6%](https://image.slidesharecdn.com/thailandiub2019byetdaen-200529093806/85/Thailand-Internet-User-Behavior-2019-115-320.jpg)


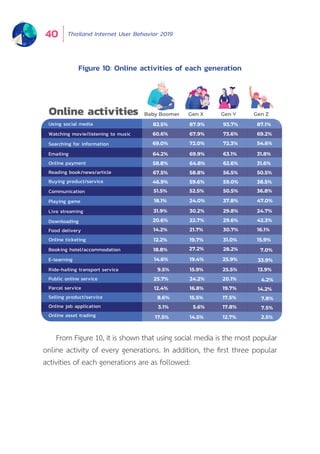
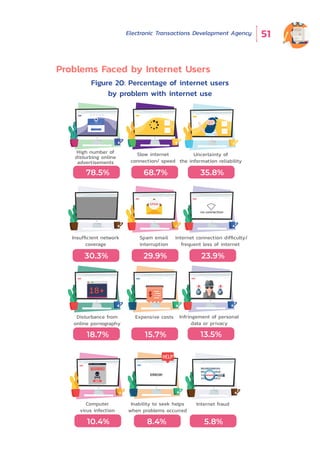
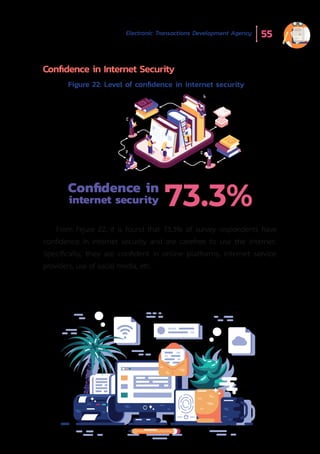
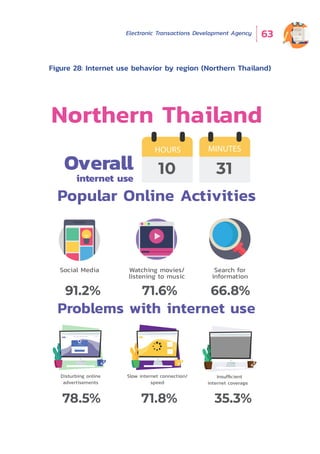
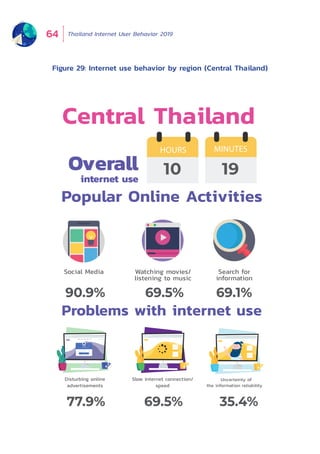
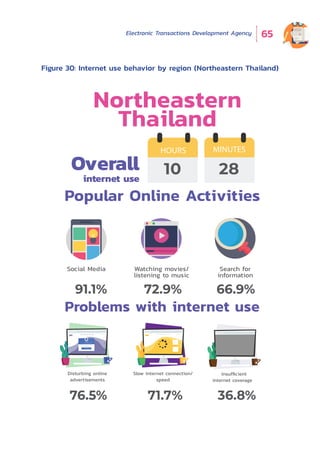
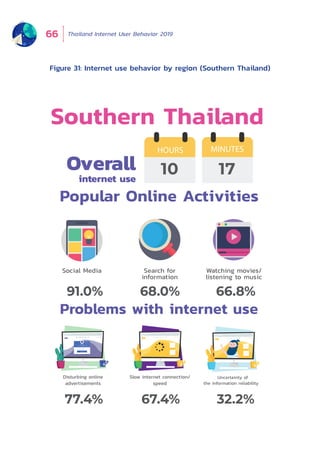
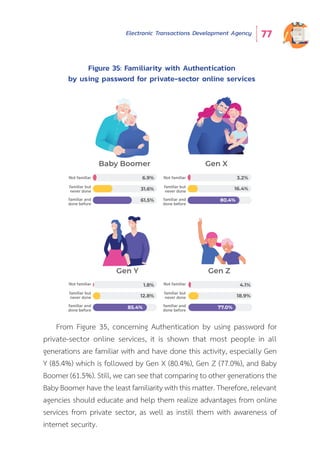
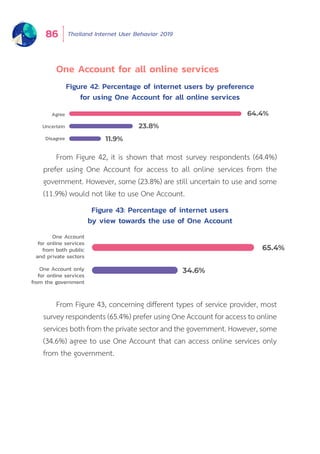
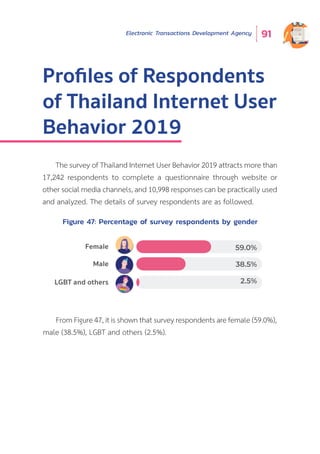
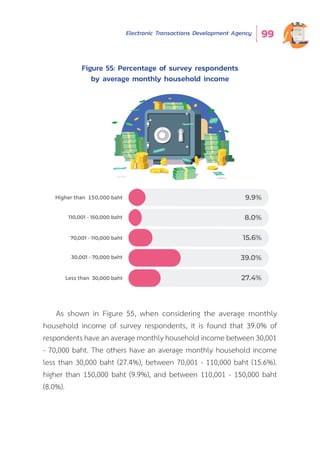
The Thailand Internet User Behavior 2019 report reveals that Thai individuals are spending an average of 10 hours and 22 minutes daily online, an increase from the previous year, with Gen Y showing the highest usage. Key online activities include social media engagement, streaming, and shopping, while concerns about internet security are prevalent, with 73% expressing confidence in online security. The report also highlights evolving trends in digital identity usage and the growing reliance on online services due to increased internet access and affordability.


![Getting Started with Apache Spark: Big Data Made Simple [Free Meetup]](https://cdn.slidesharecdn.com/ss_thumbnails/apachesparkgettingstarted-260203175547-8361bcc3-thumbnail.jpg?width=640&height=640&fit=bounds)


