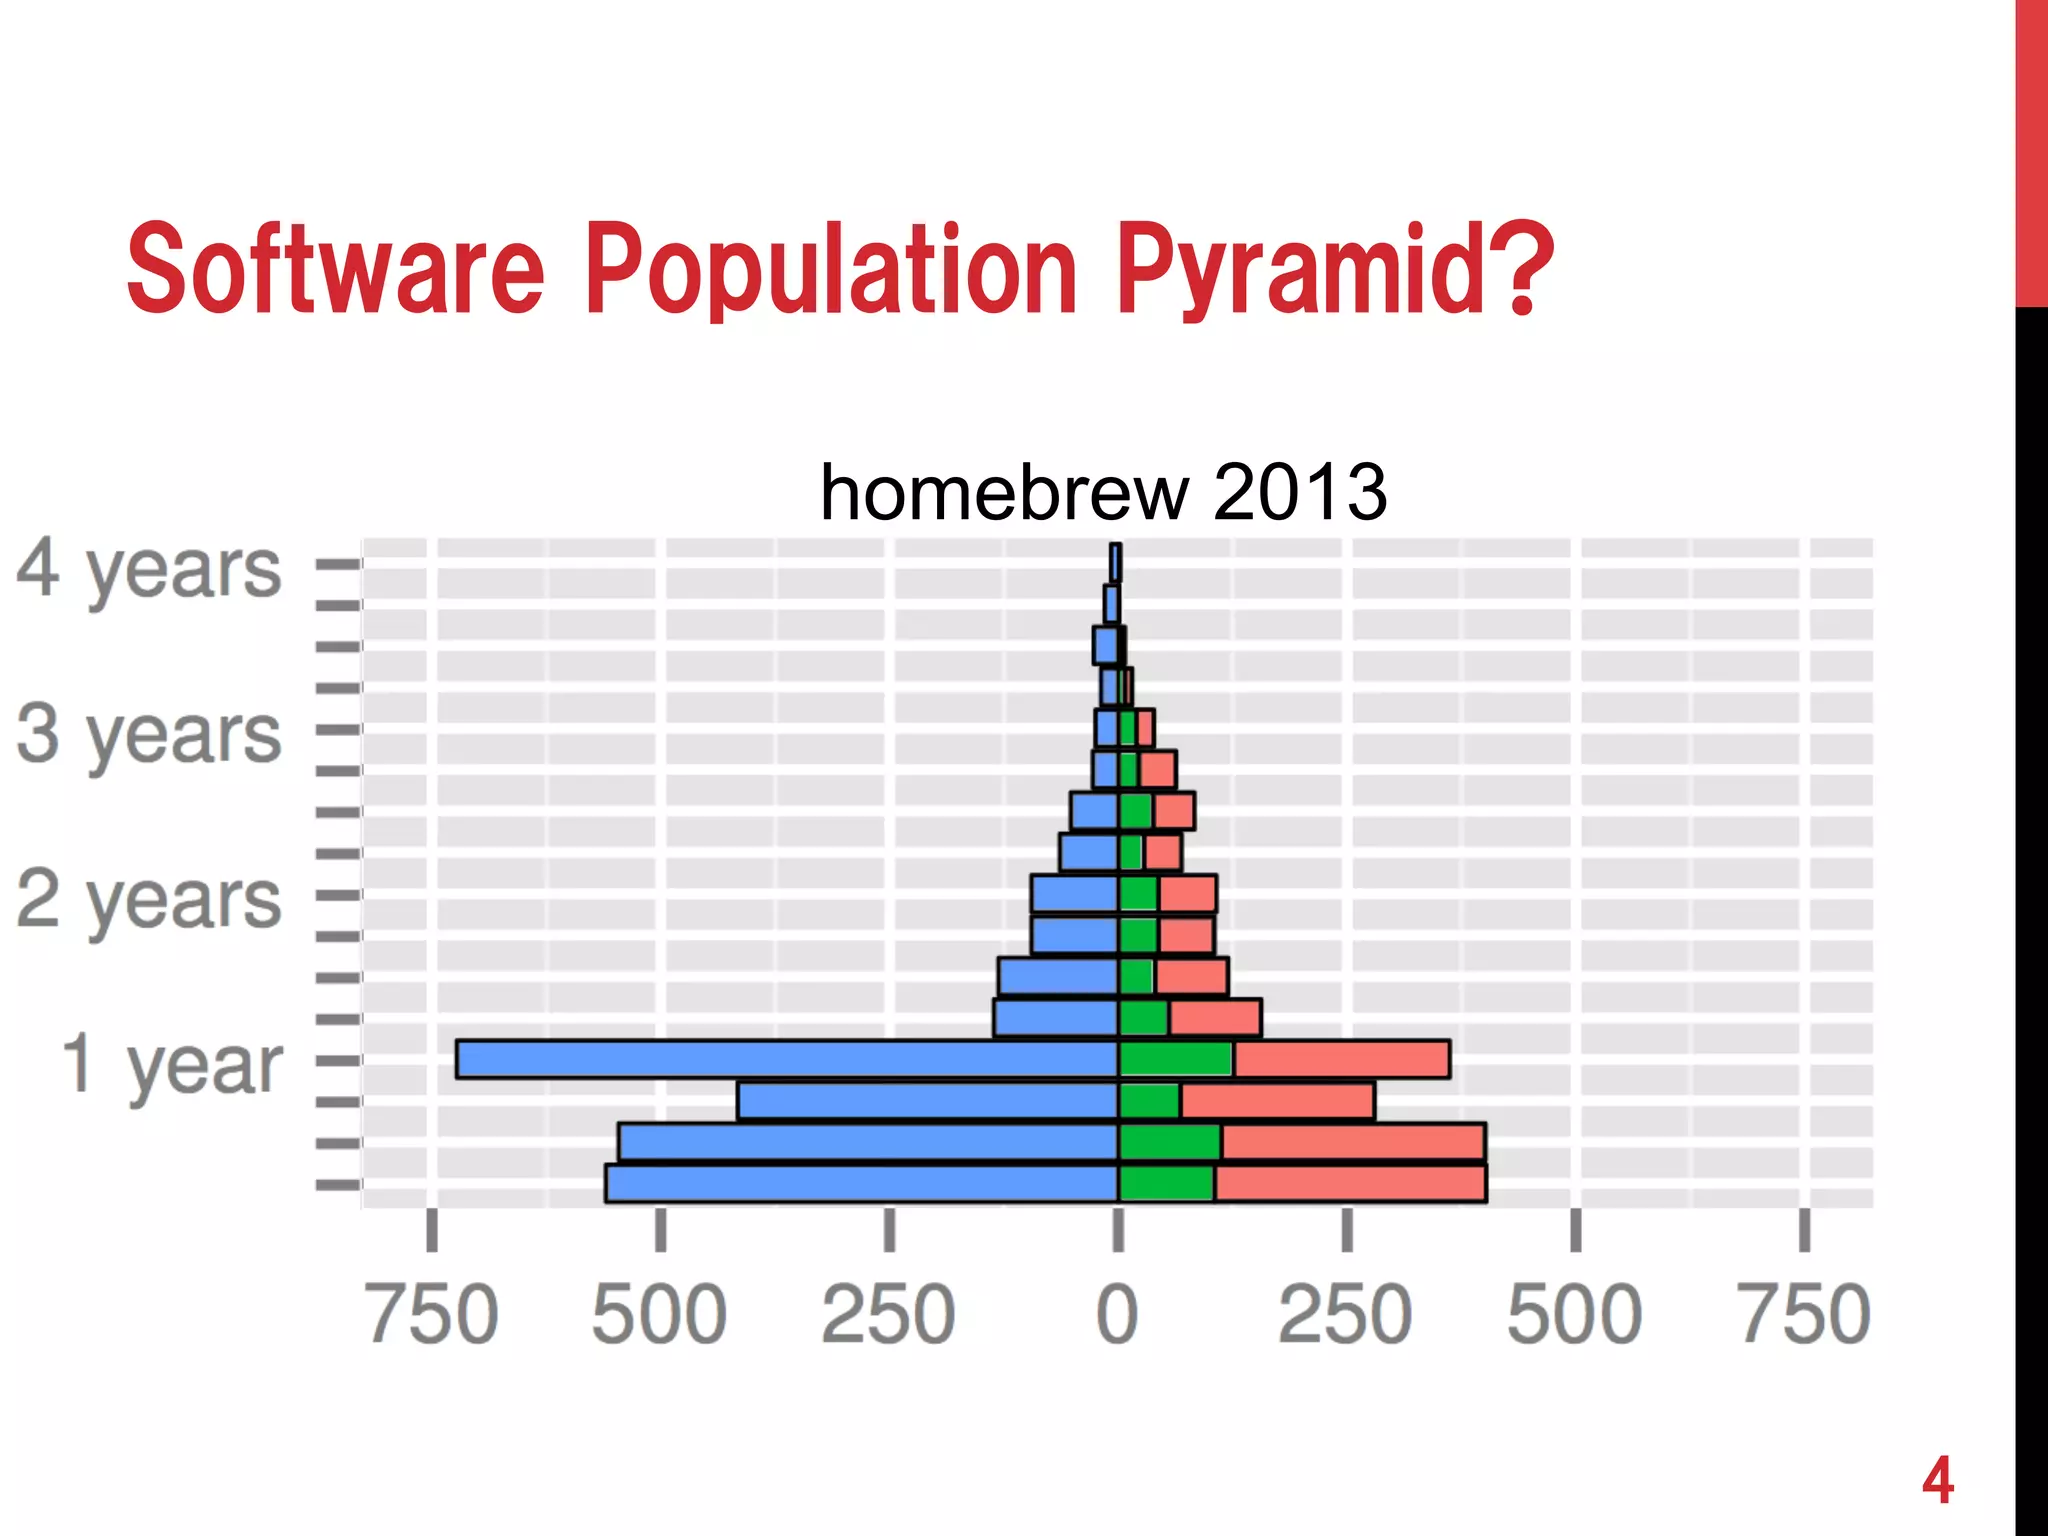
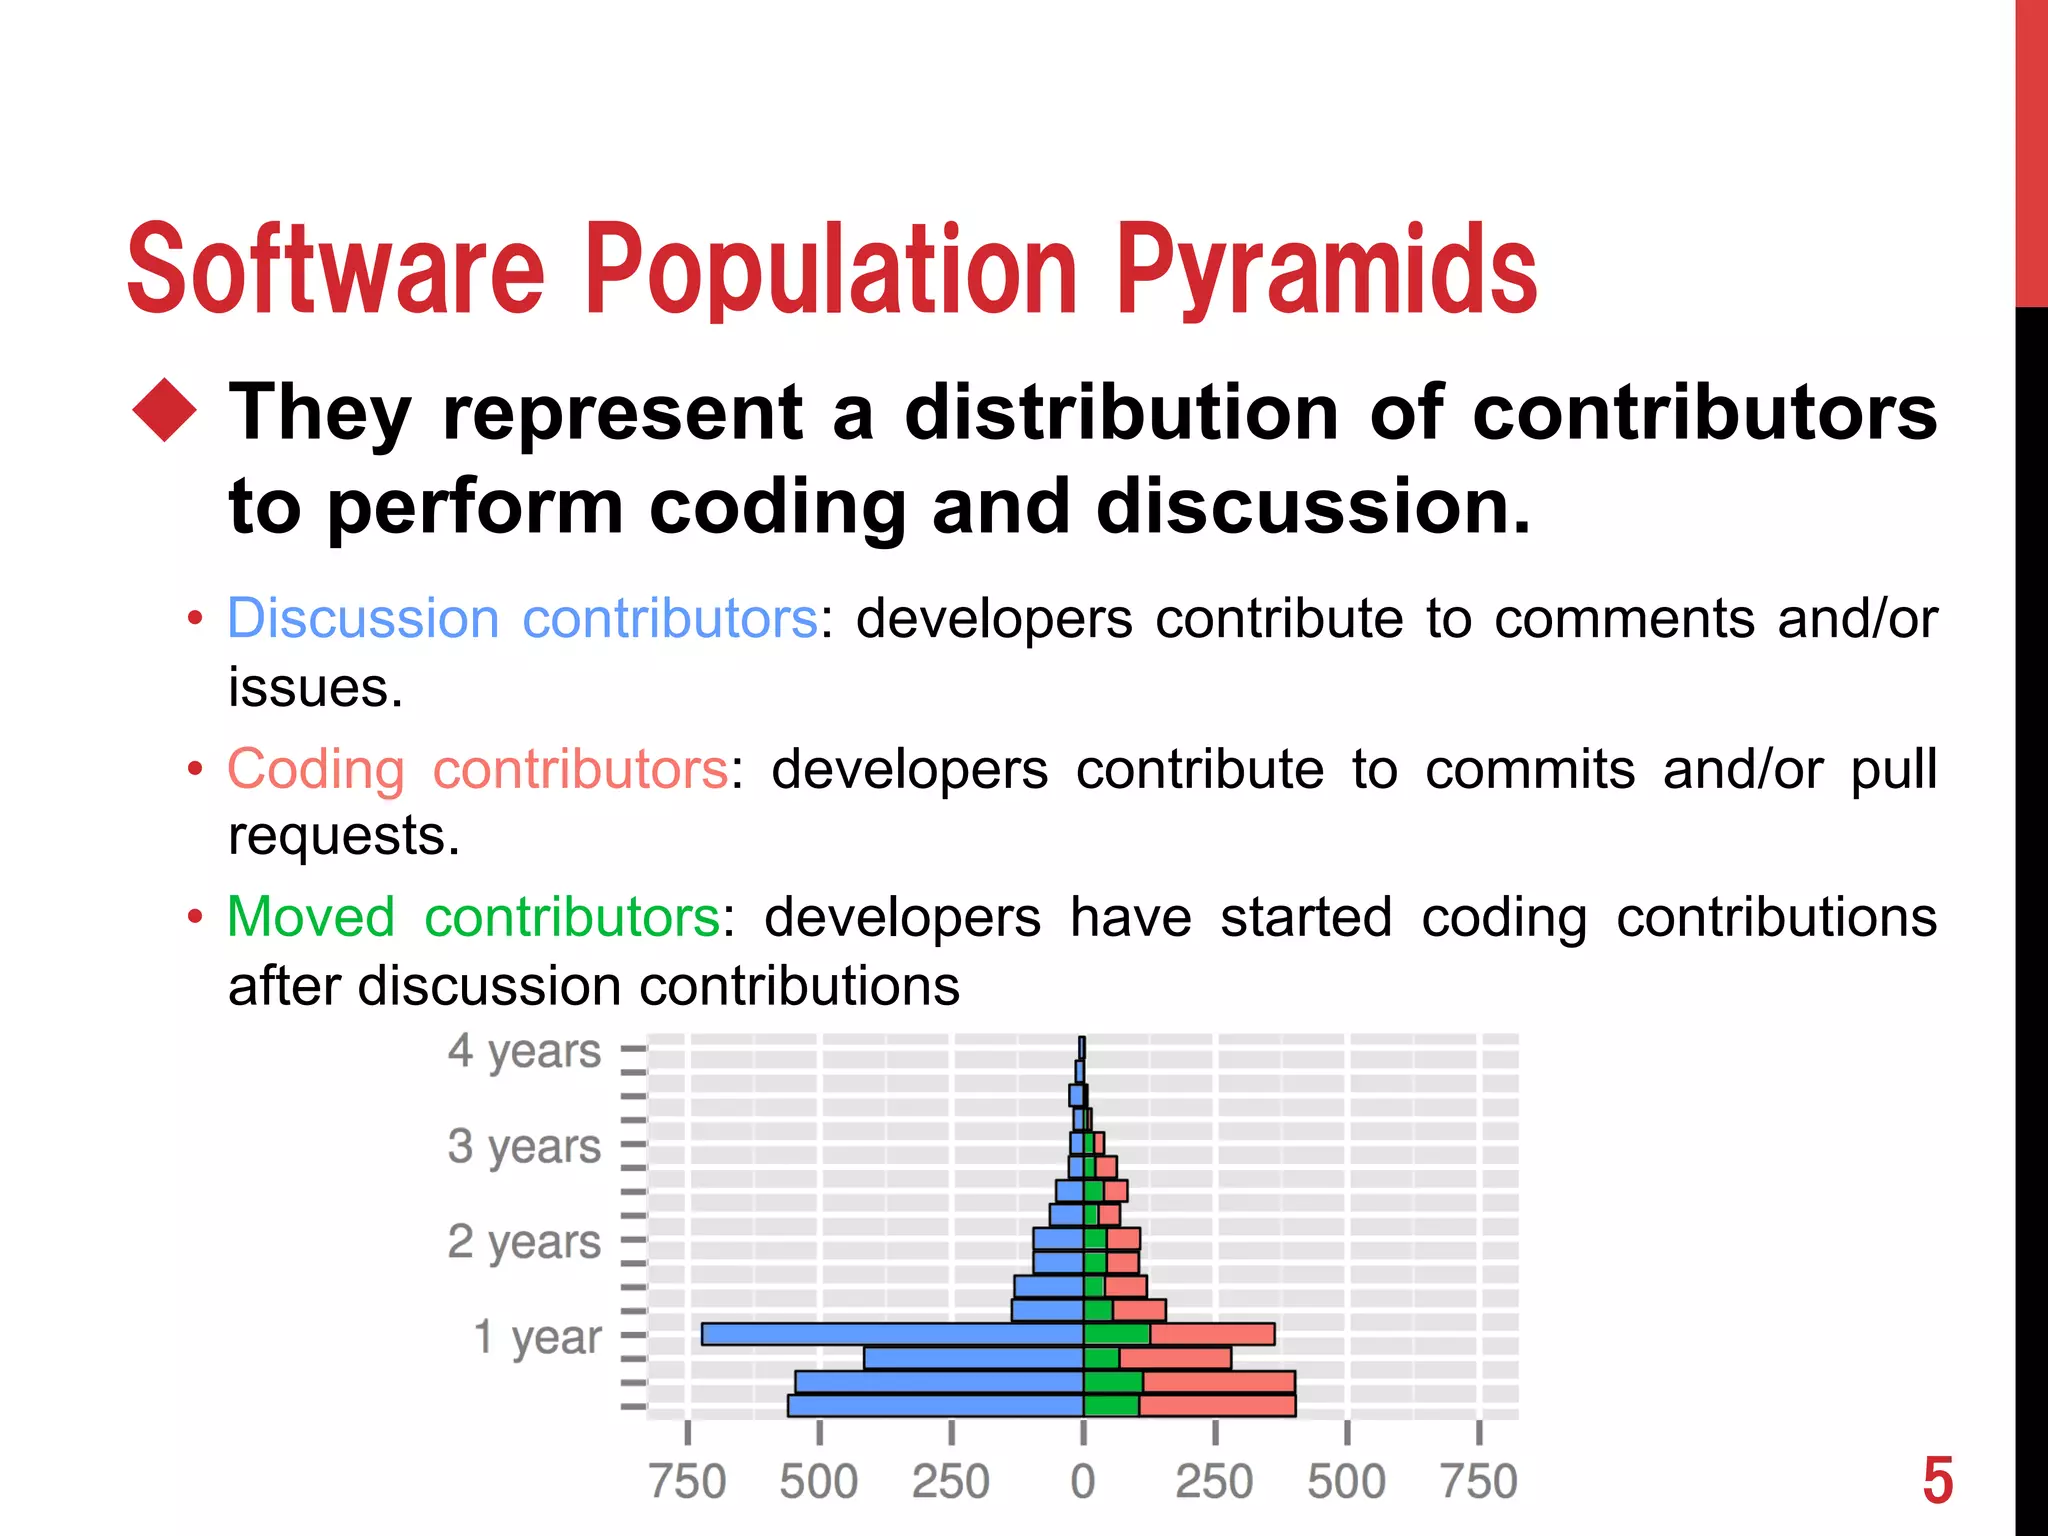
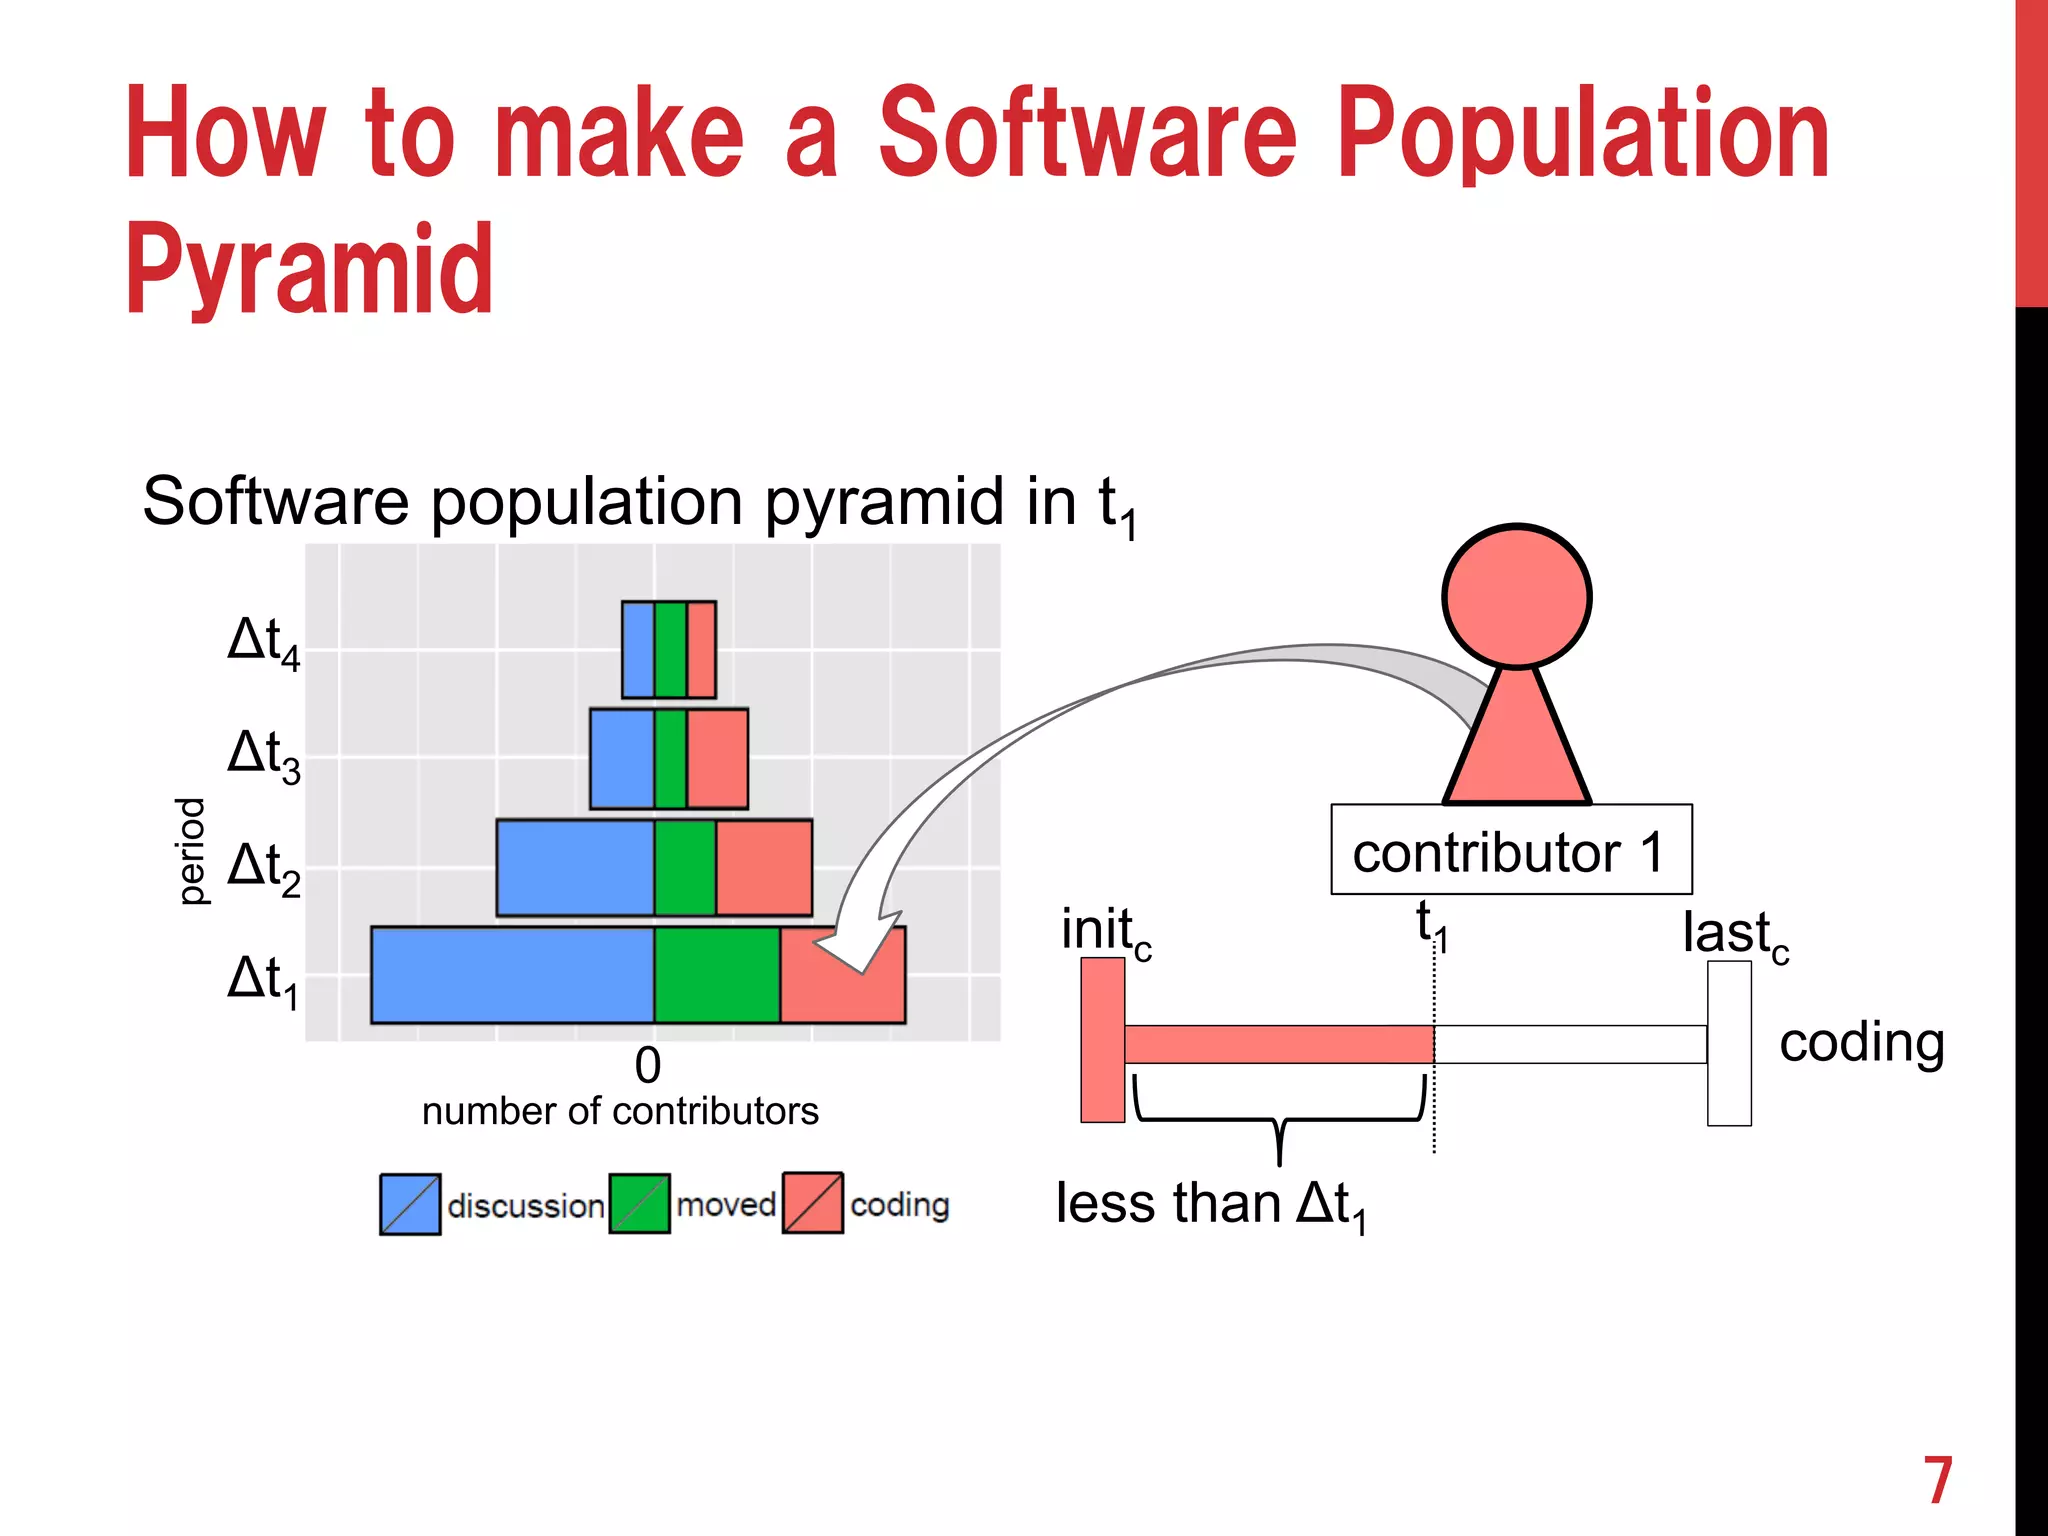
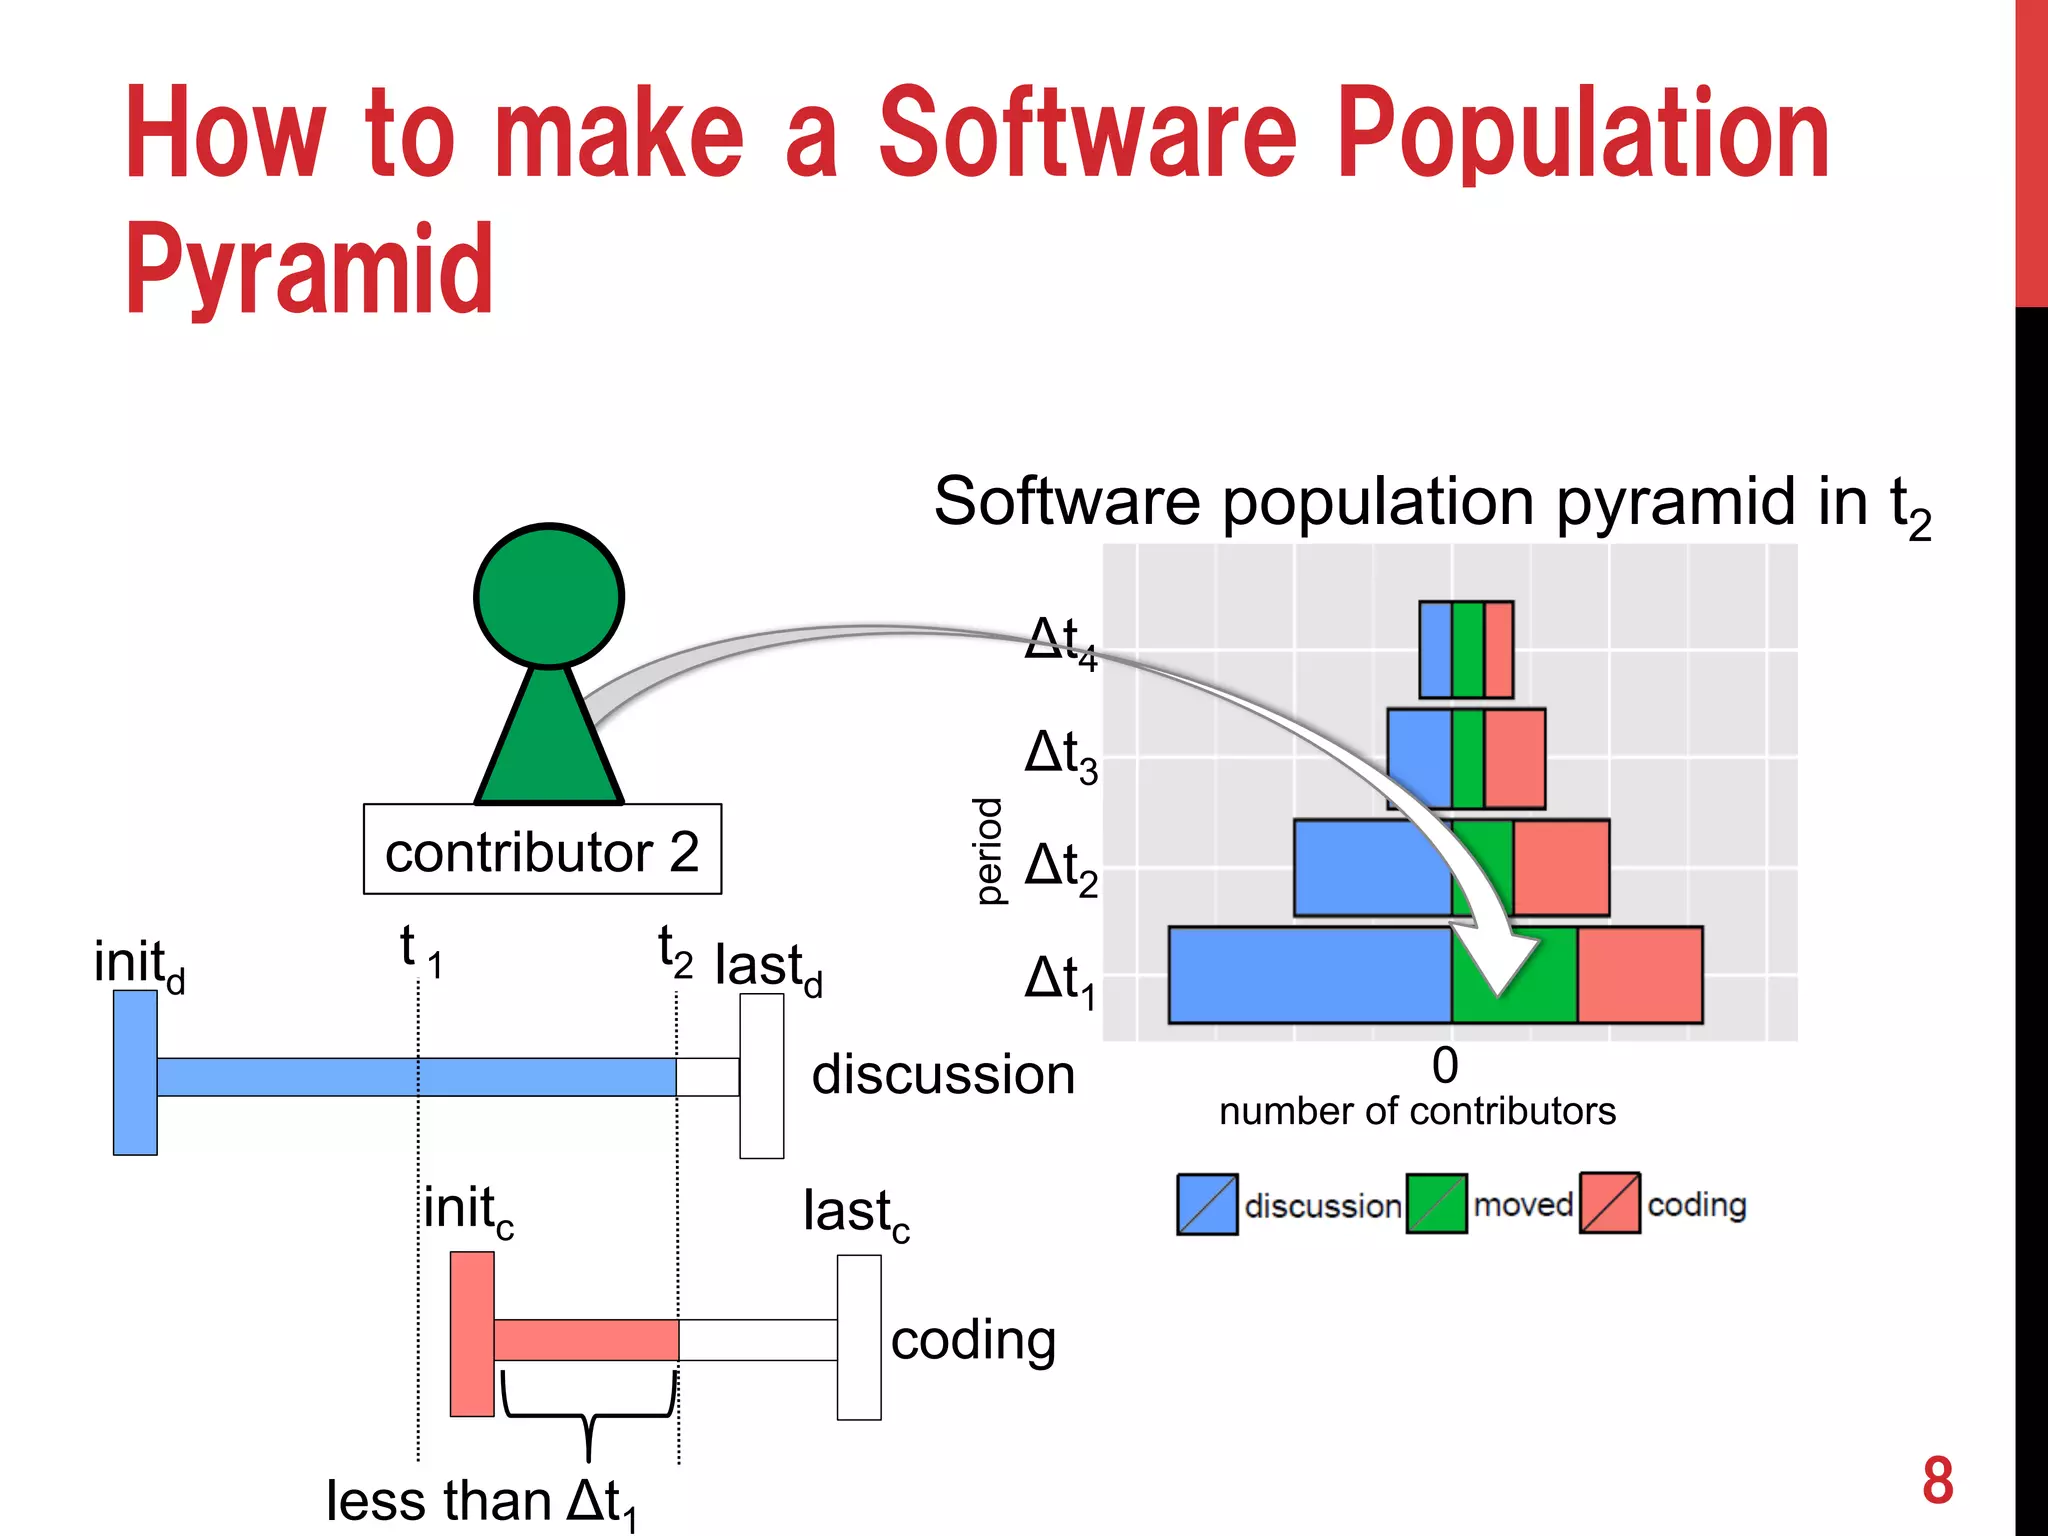
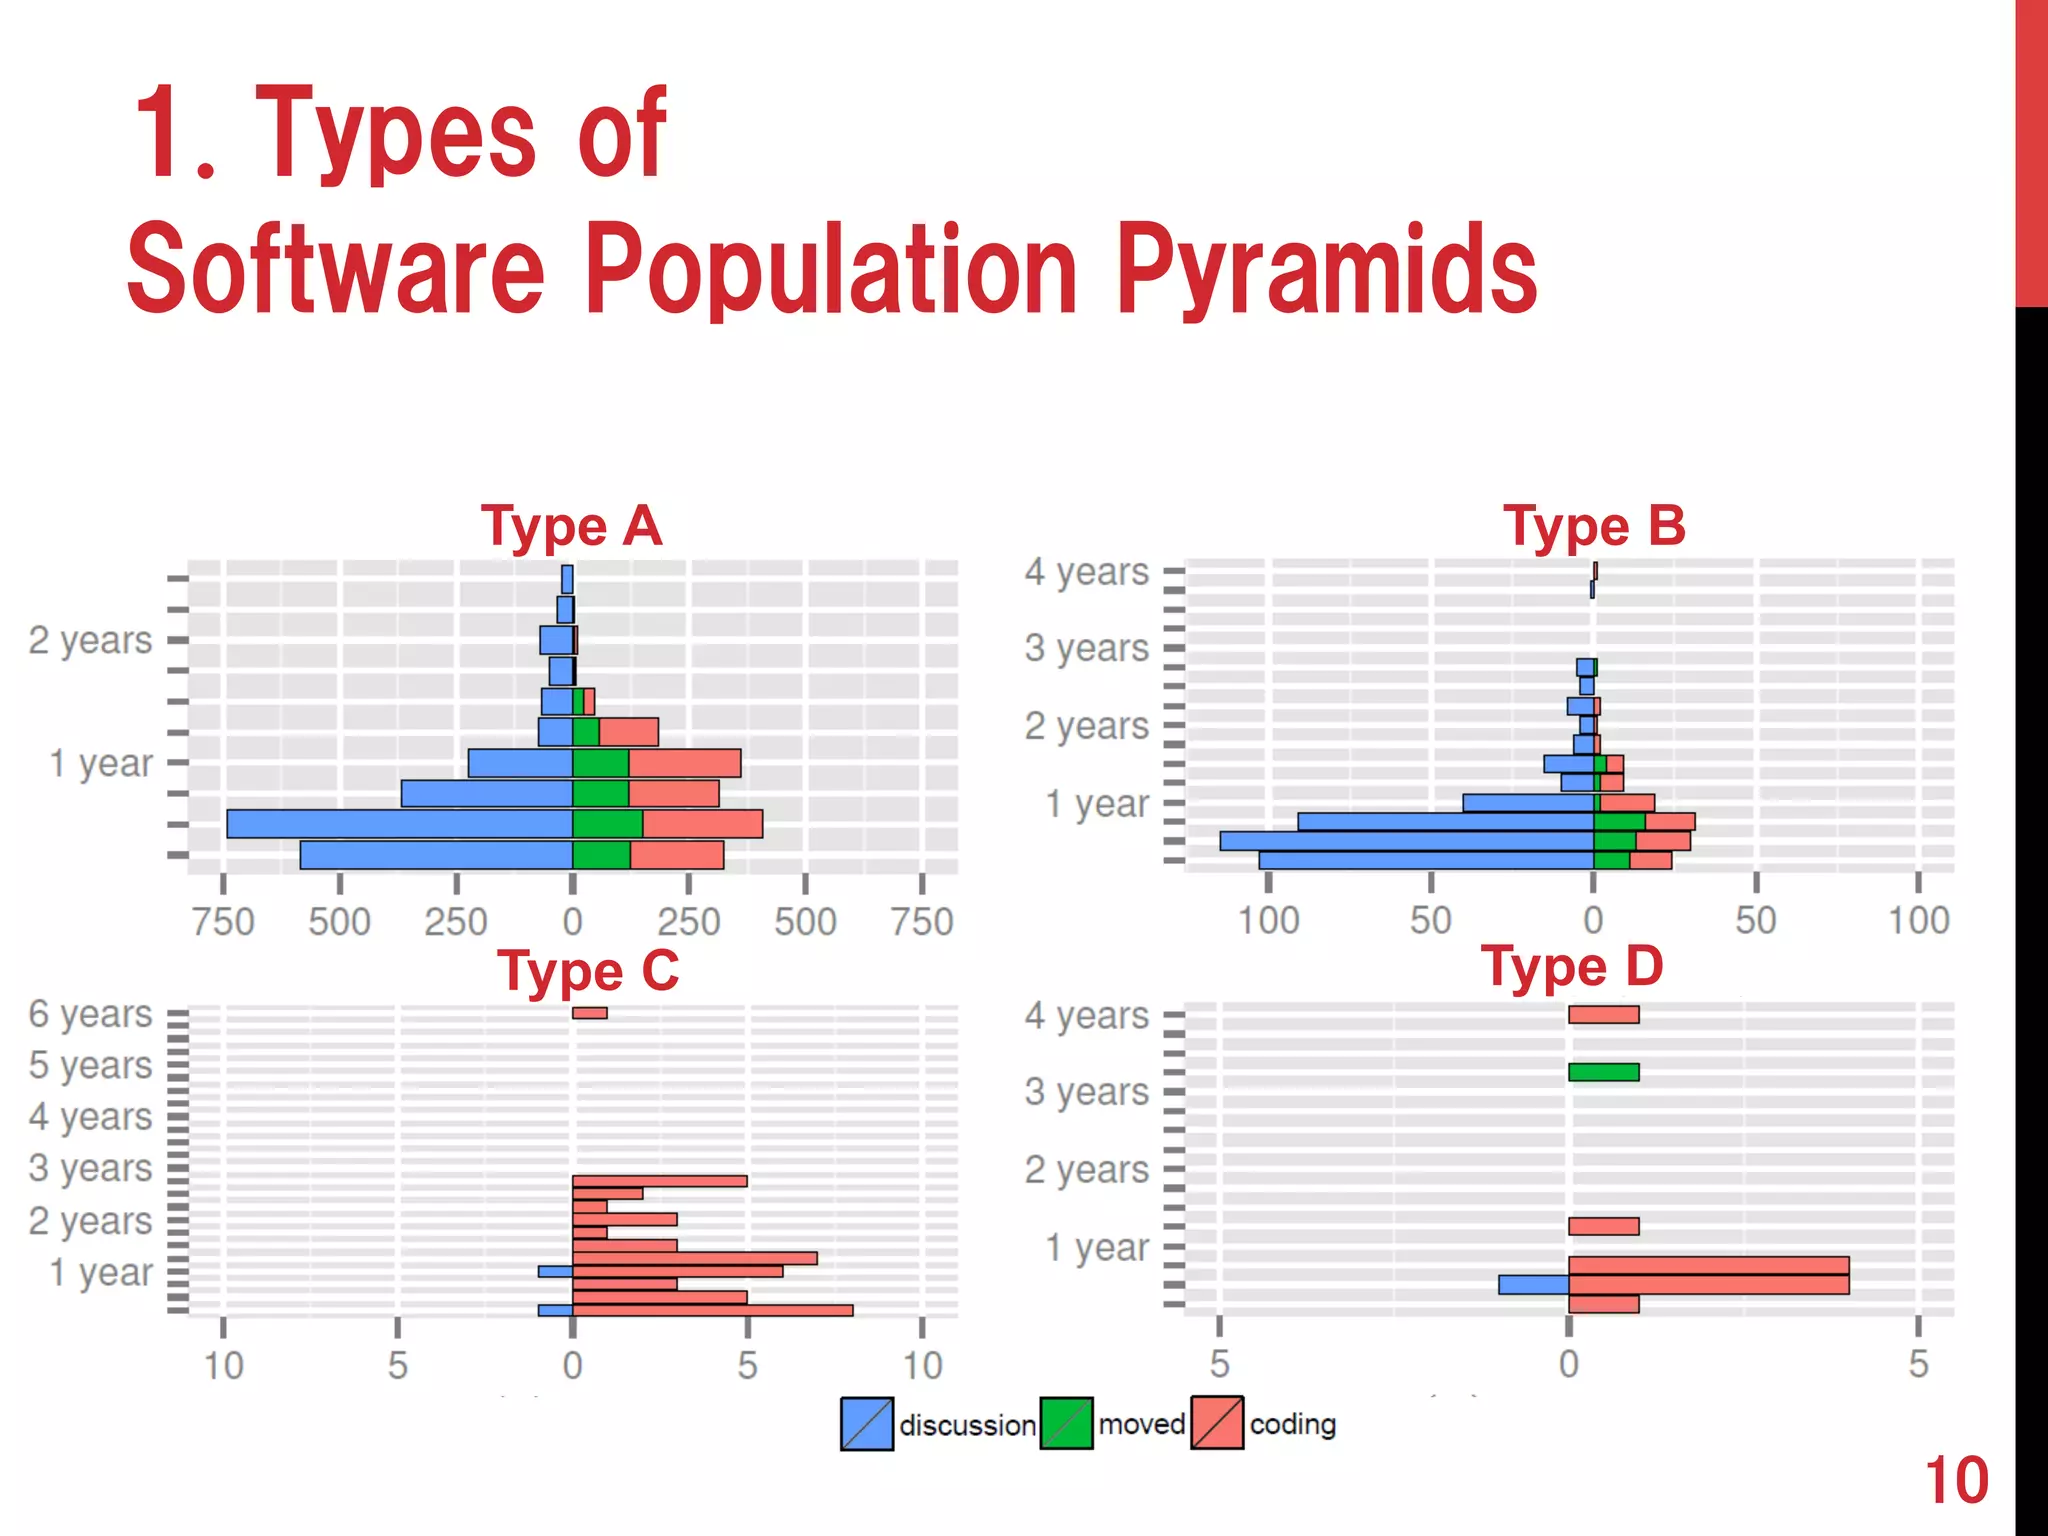
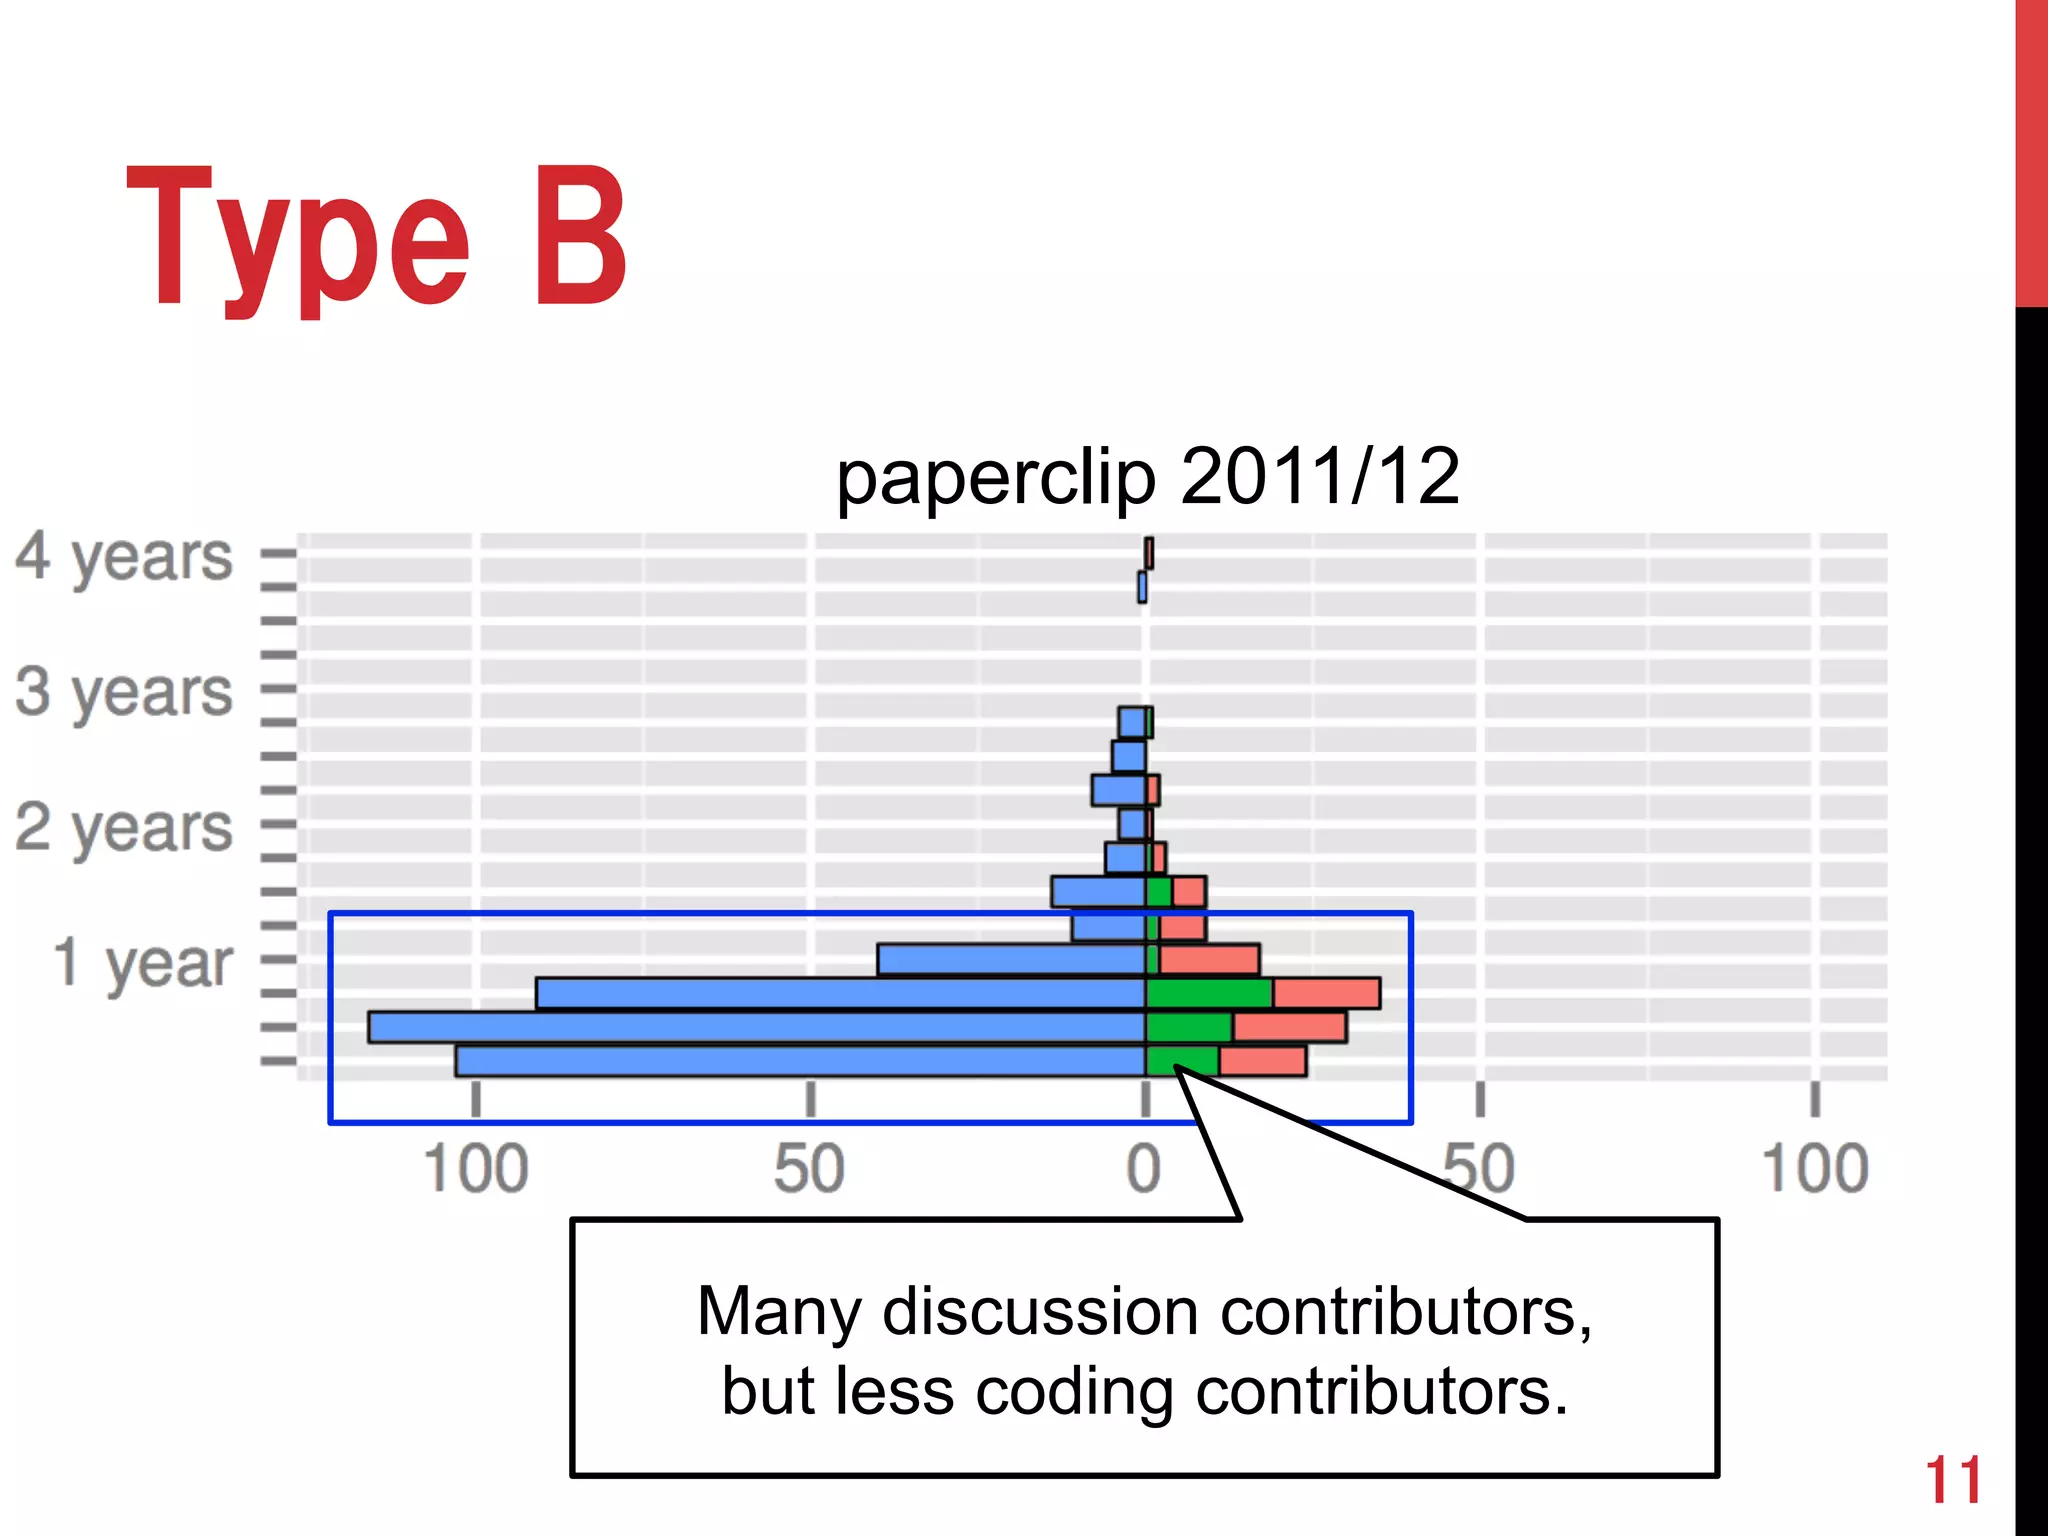
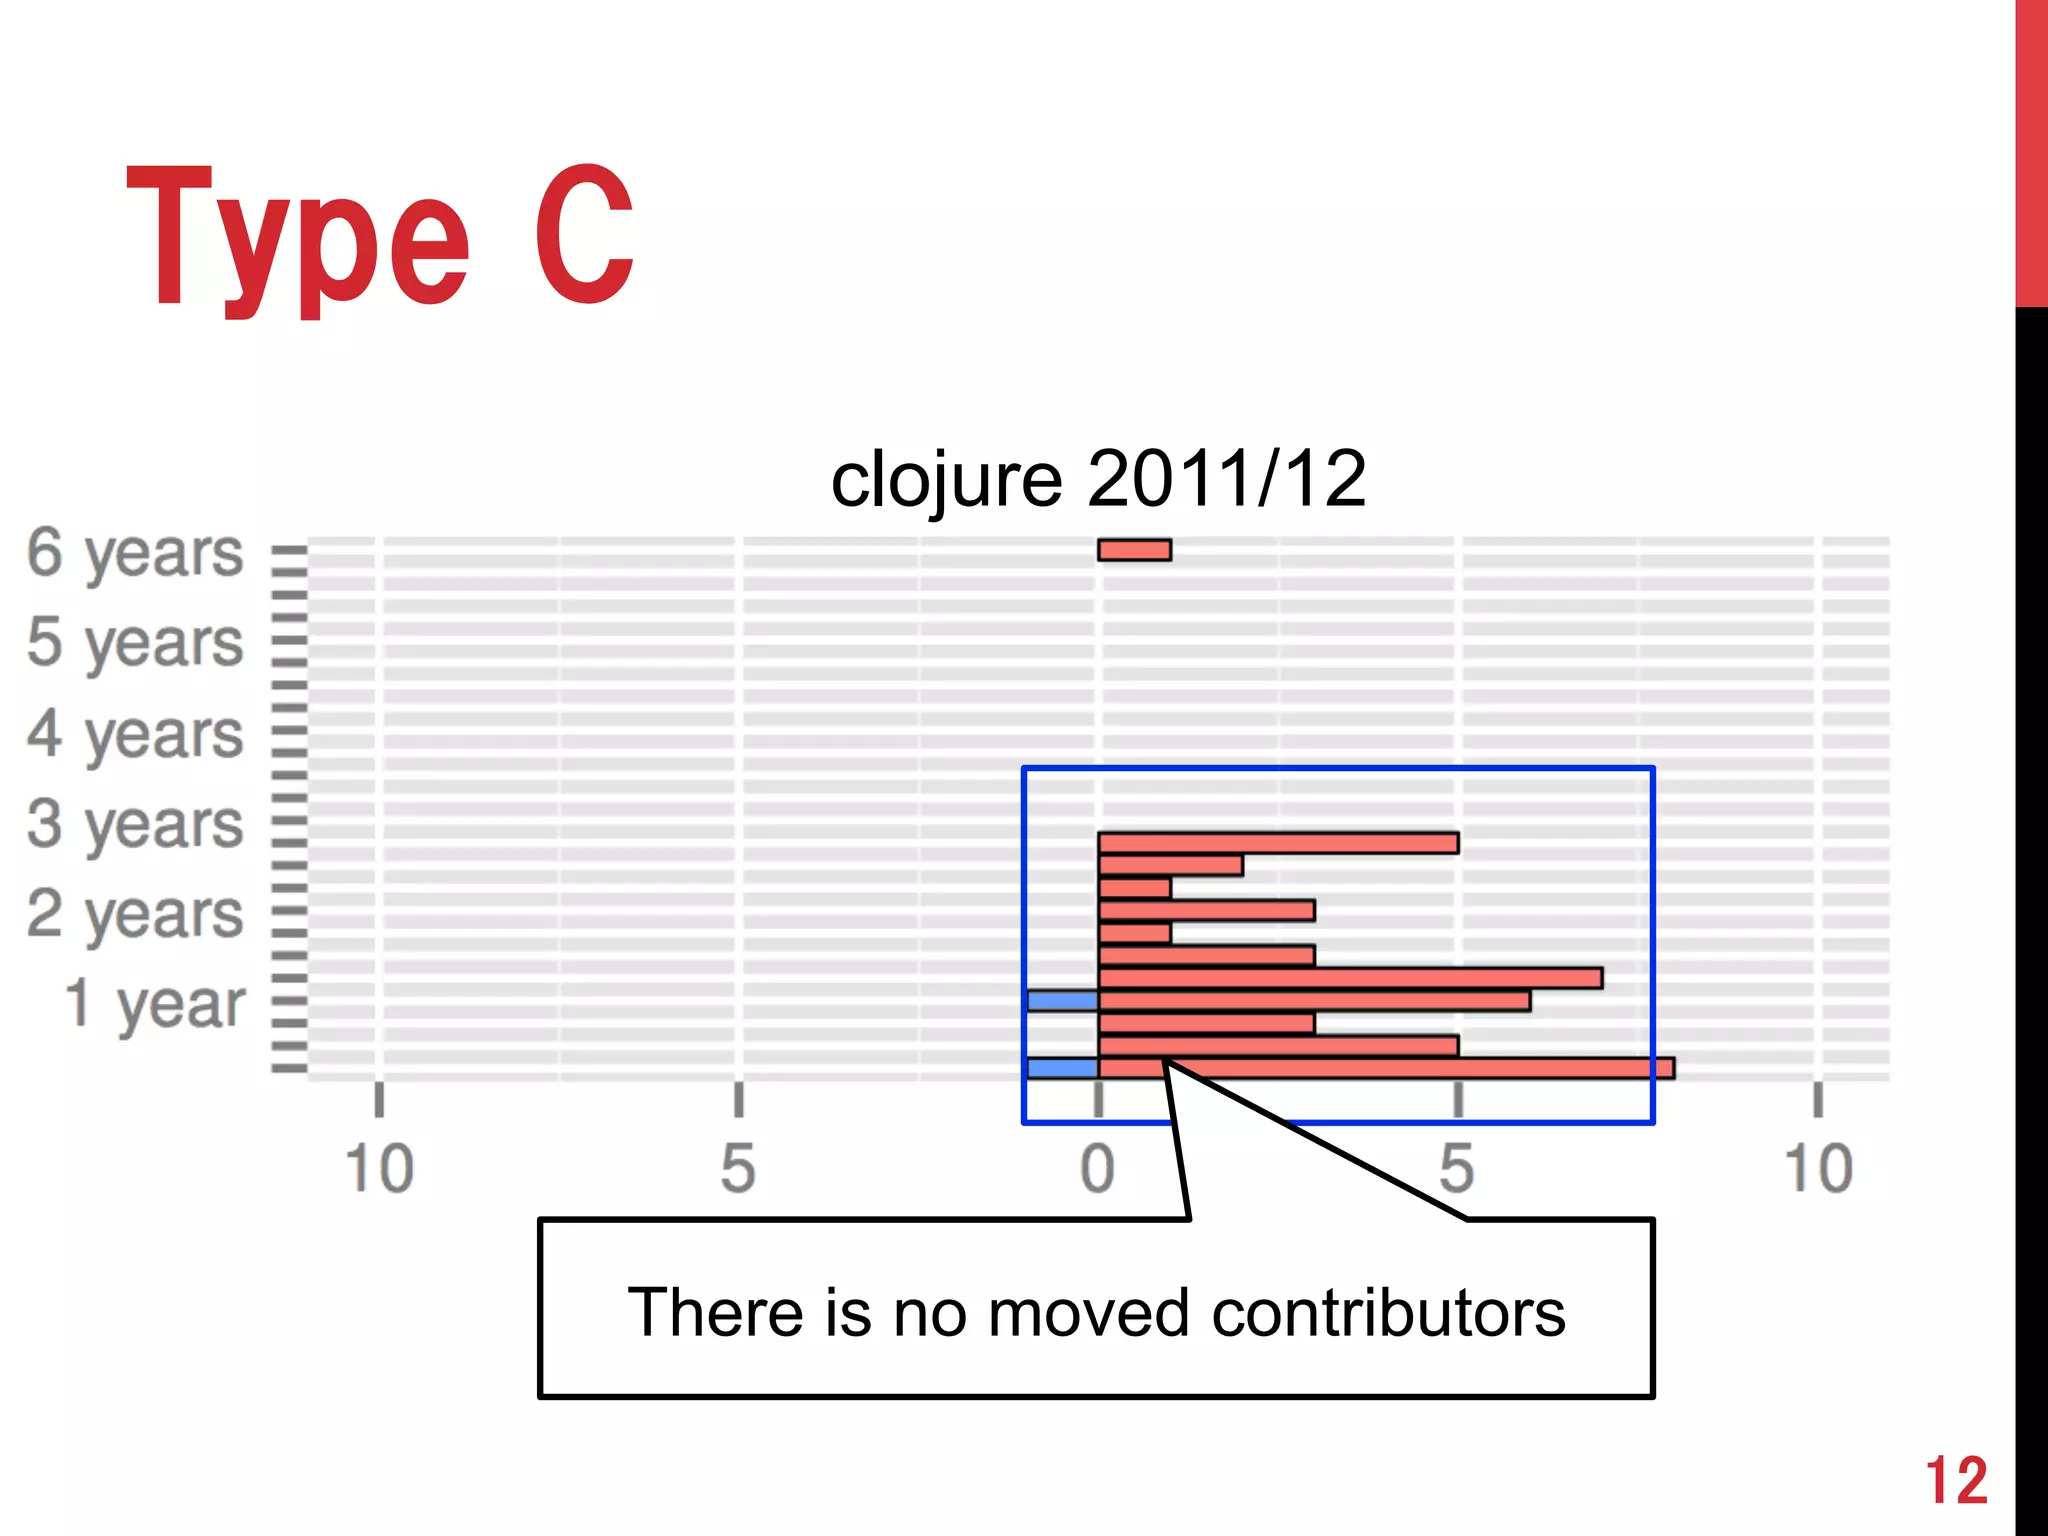
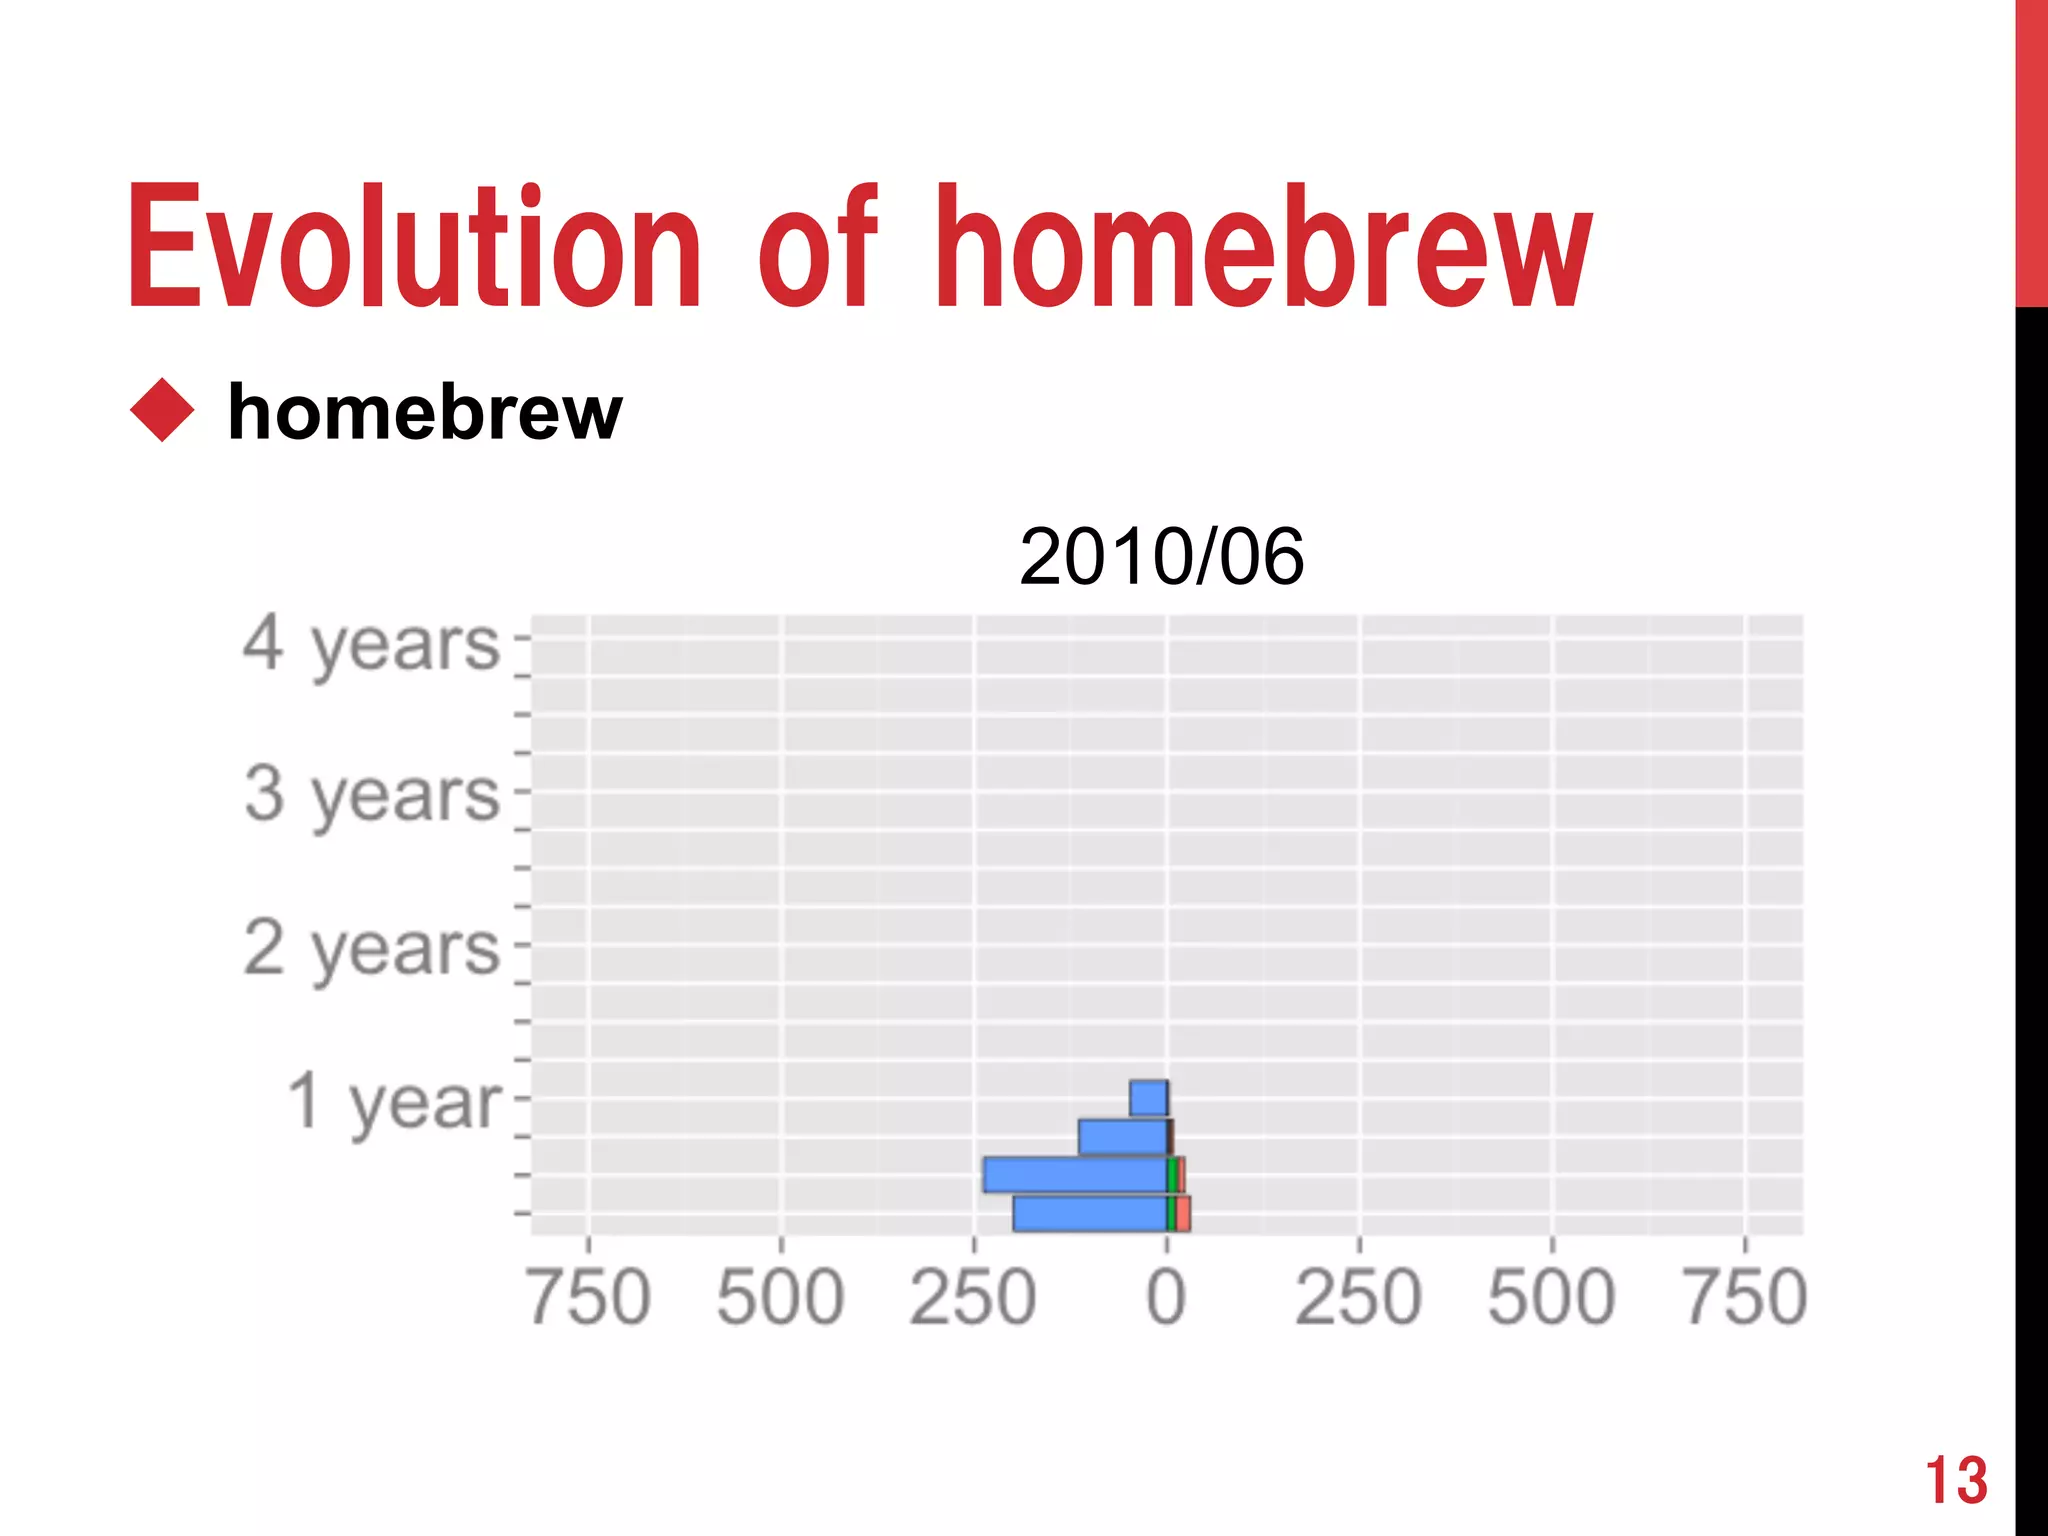
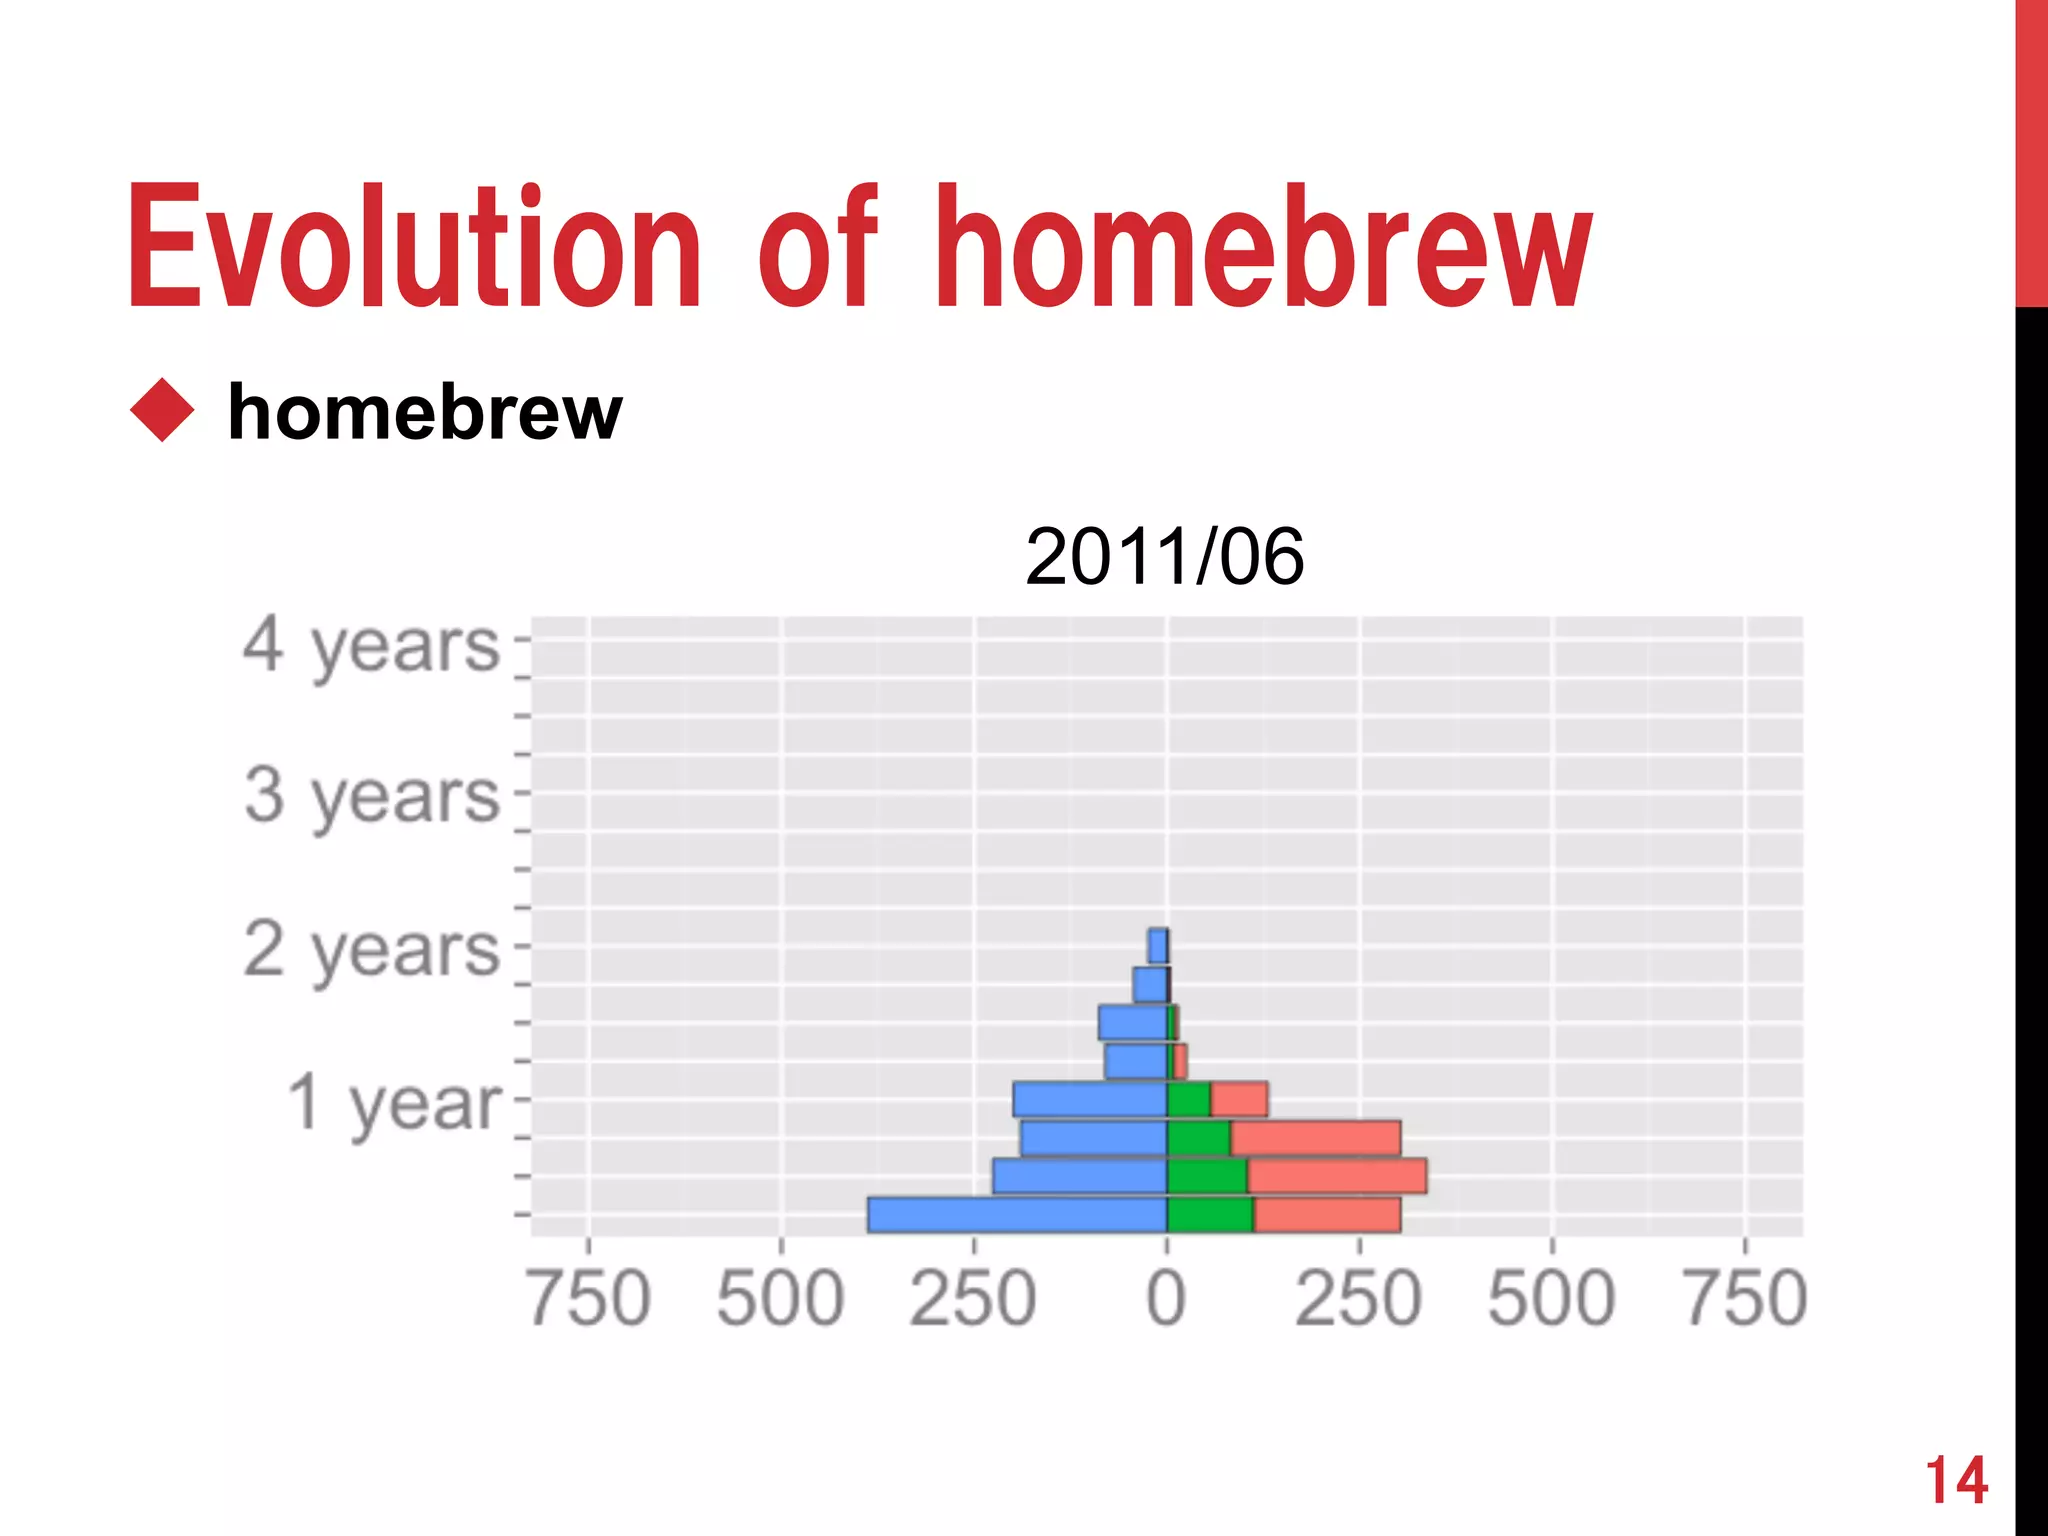
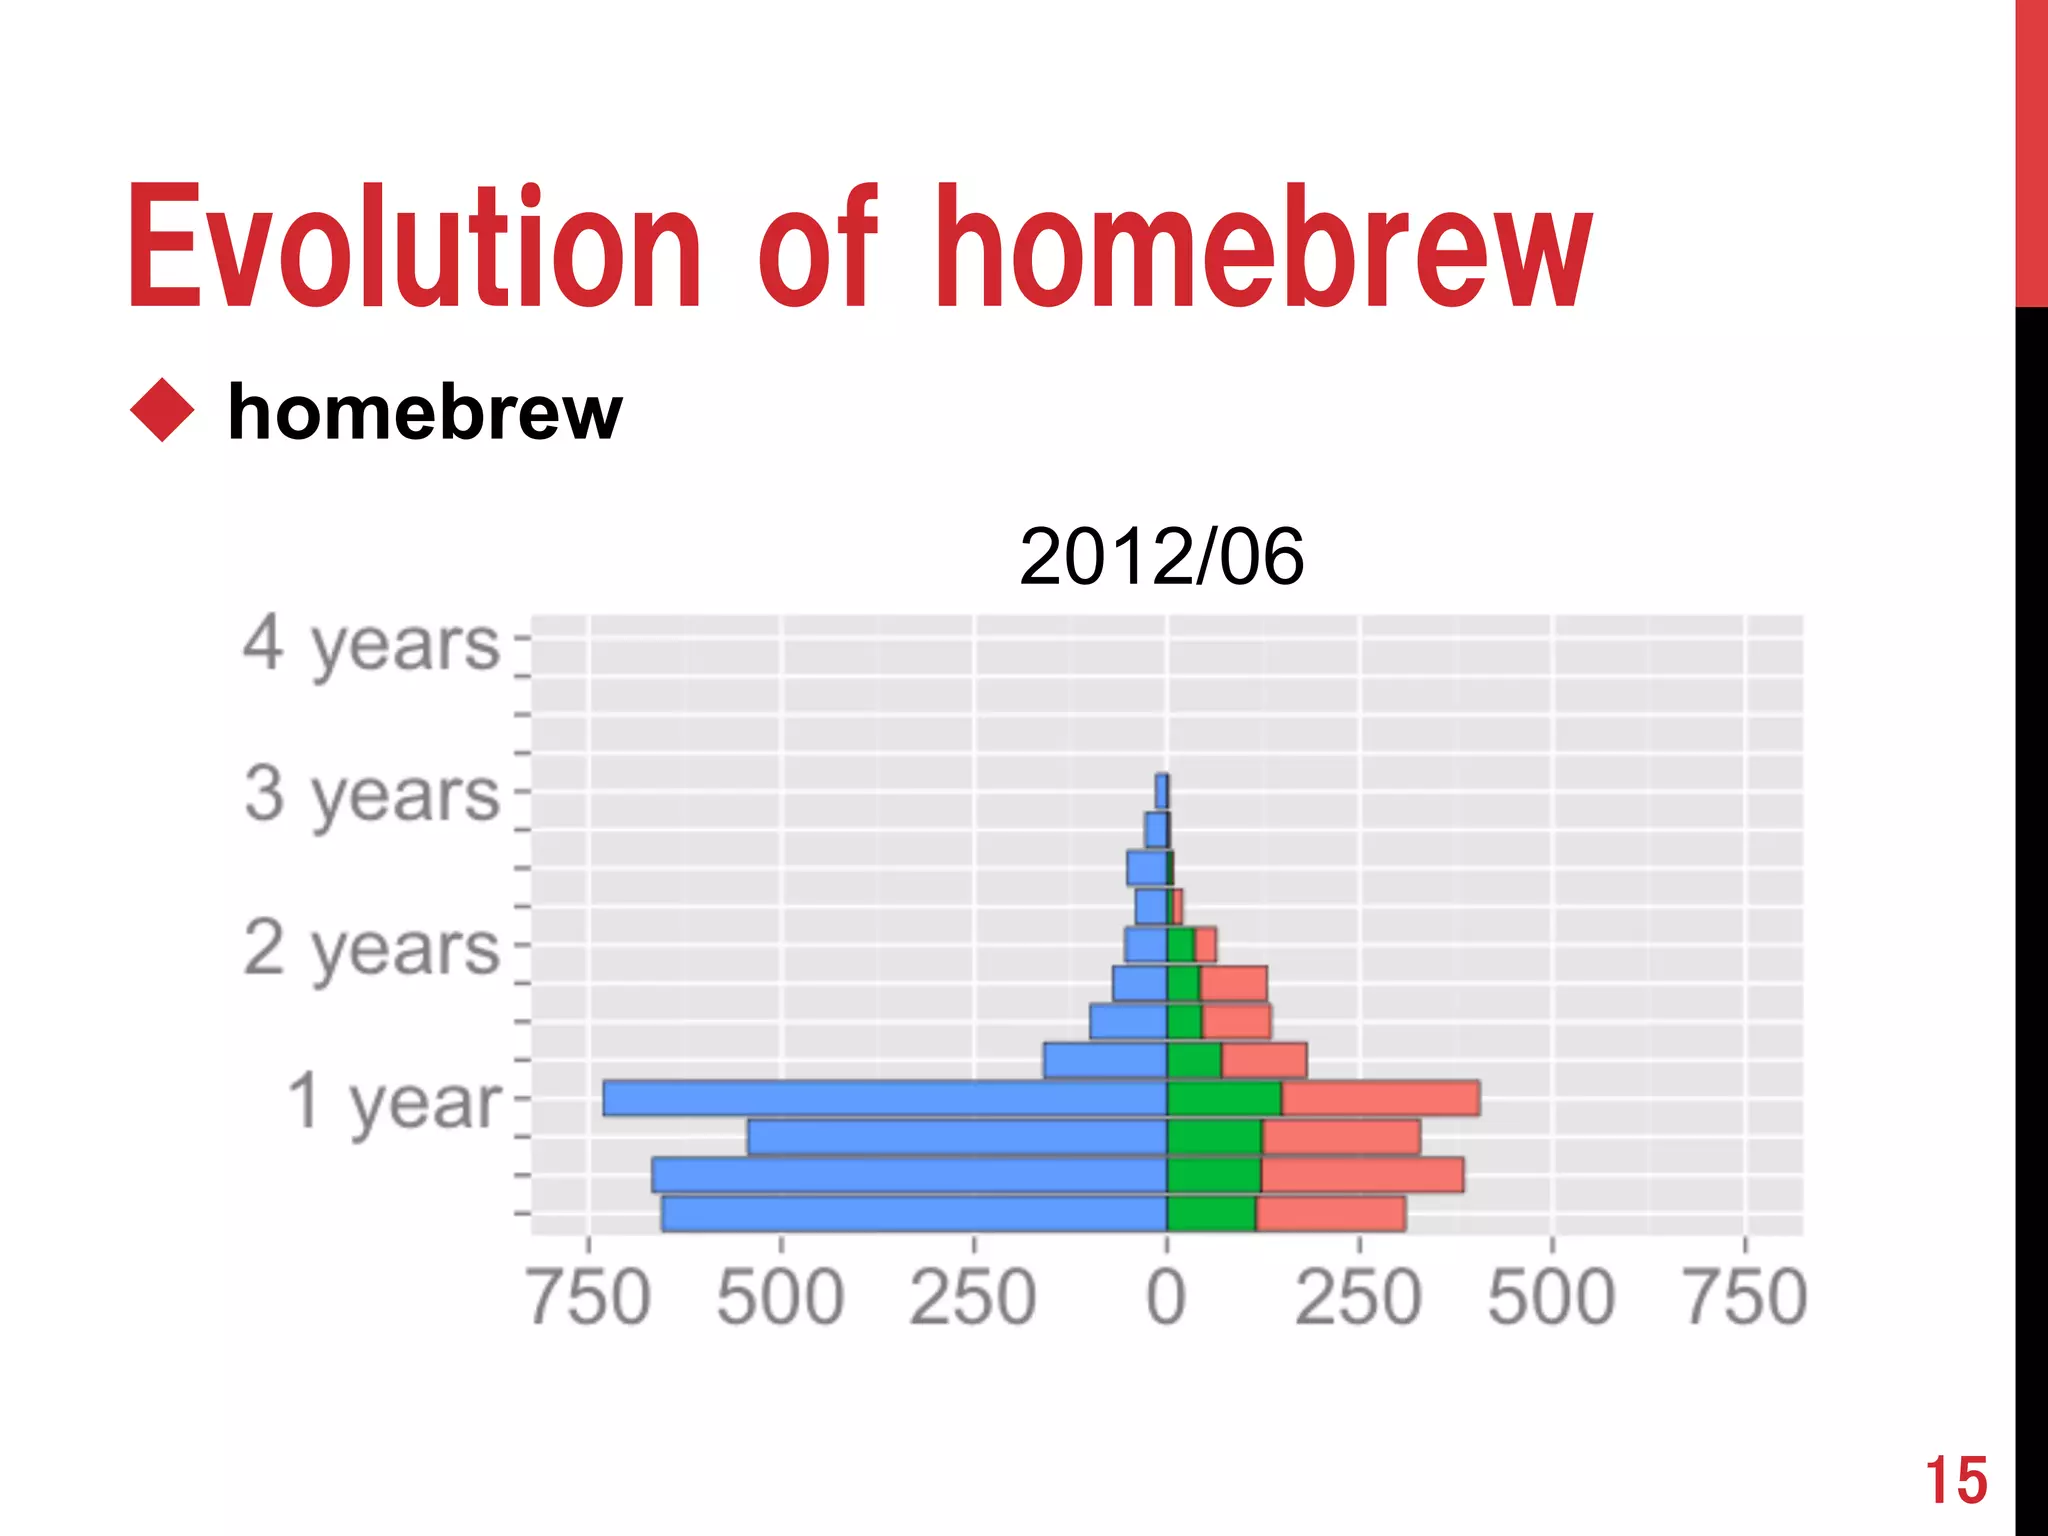
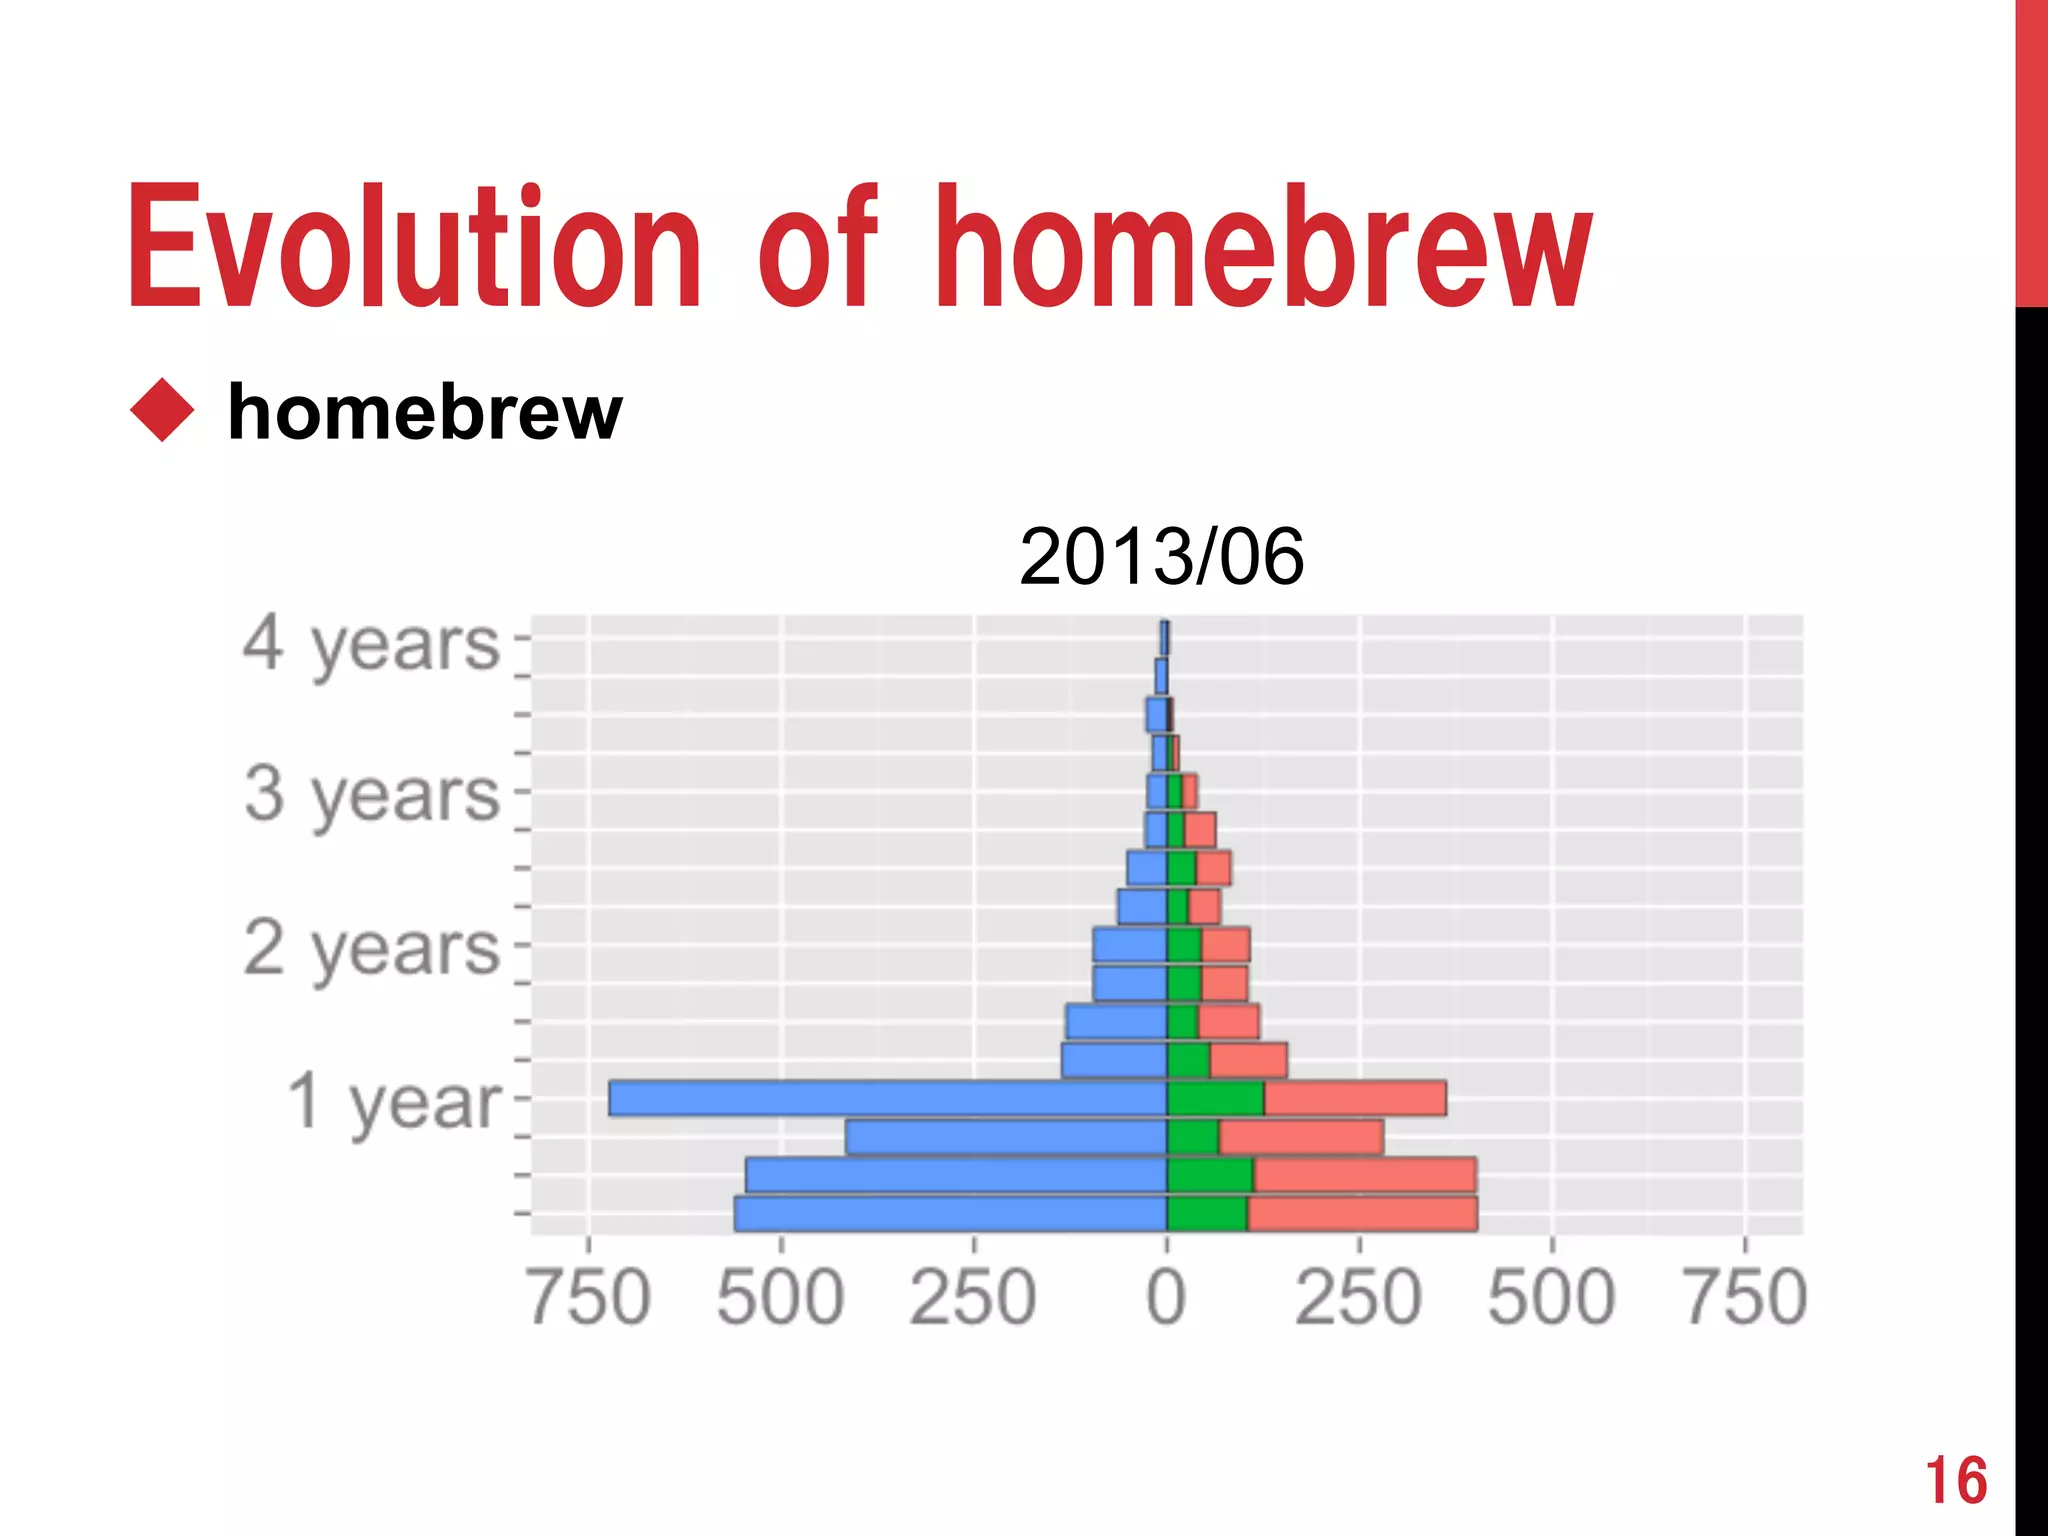
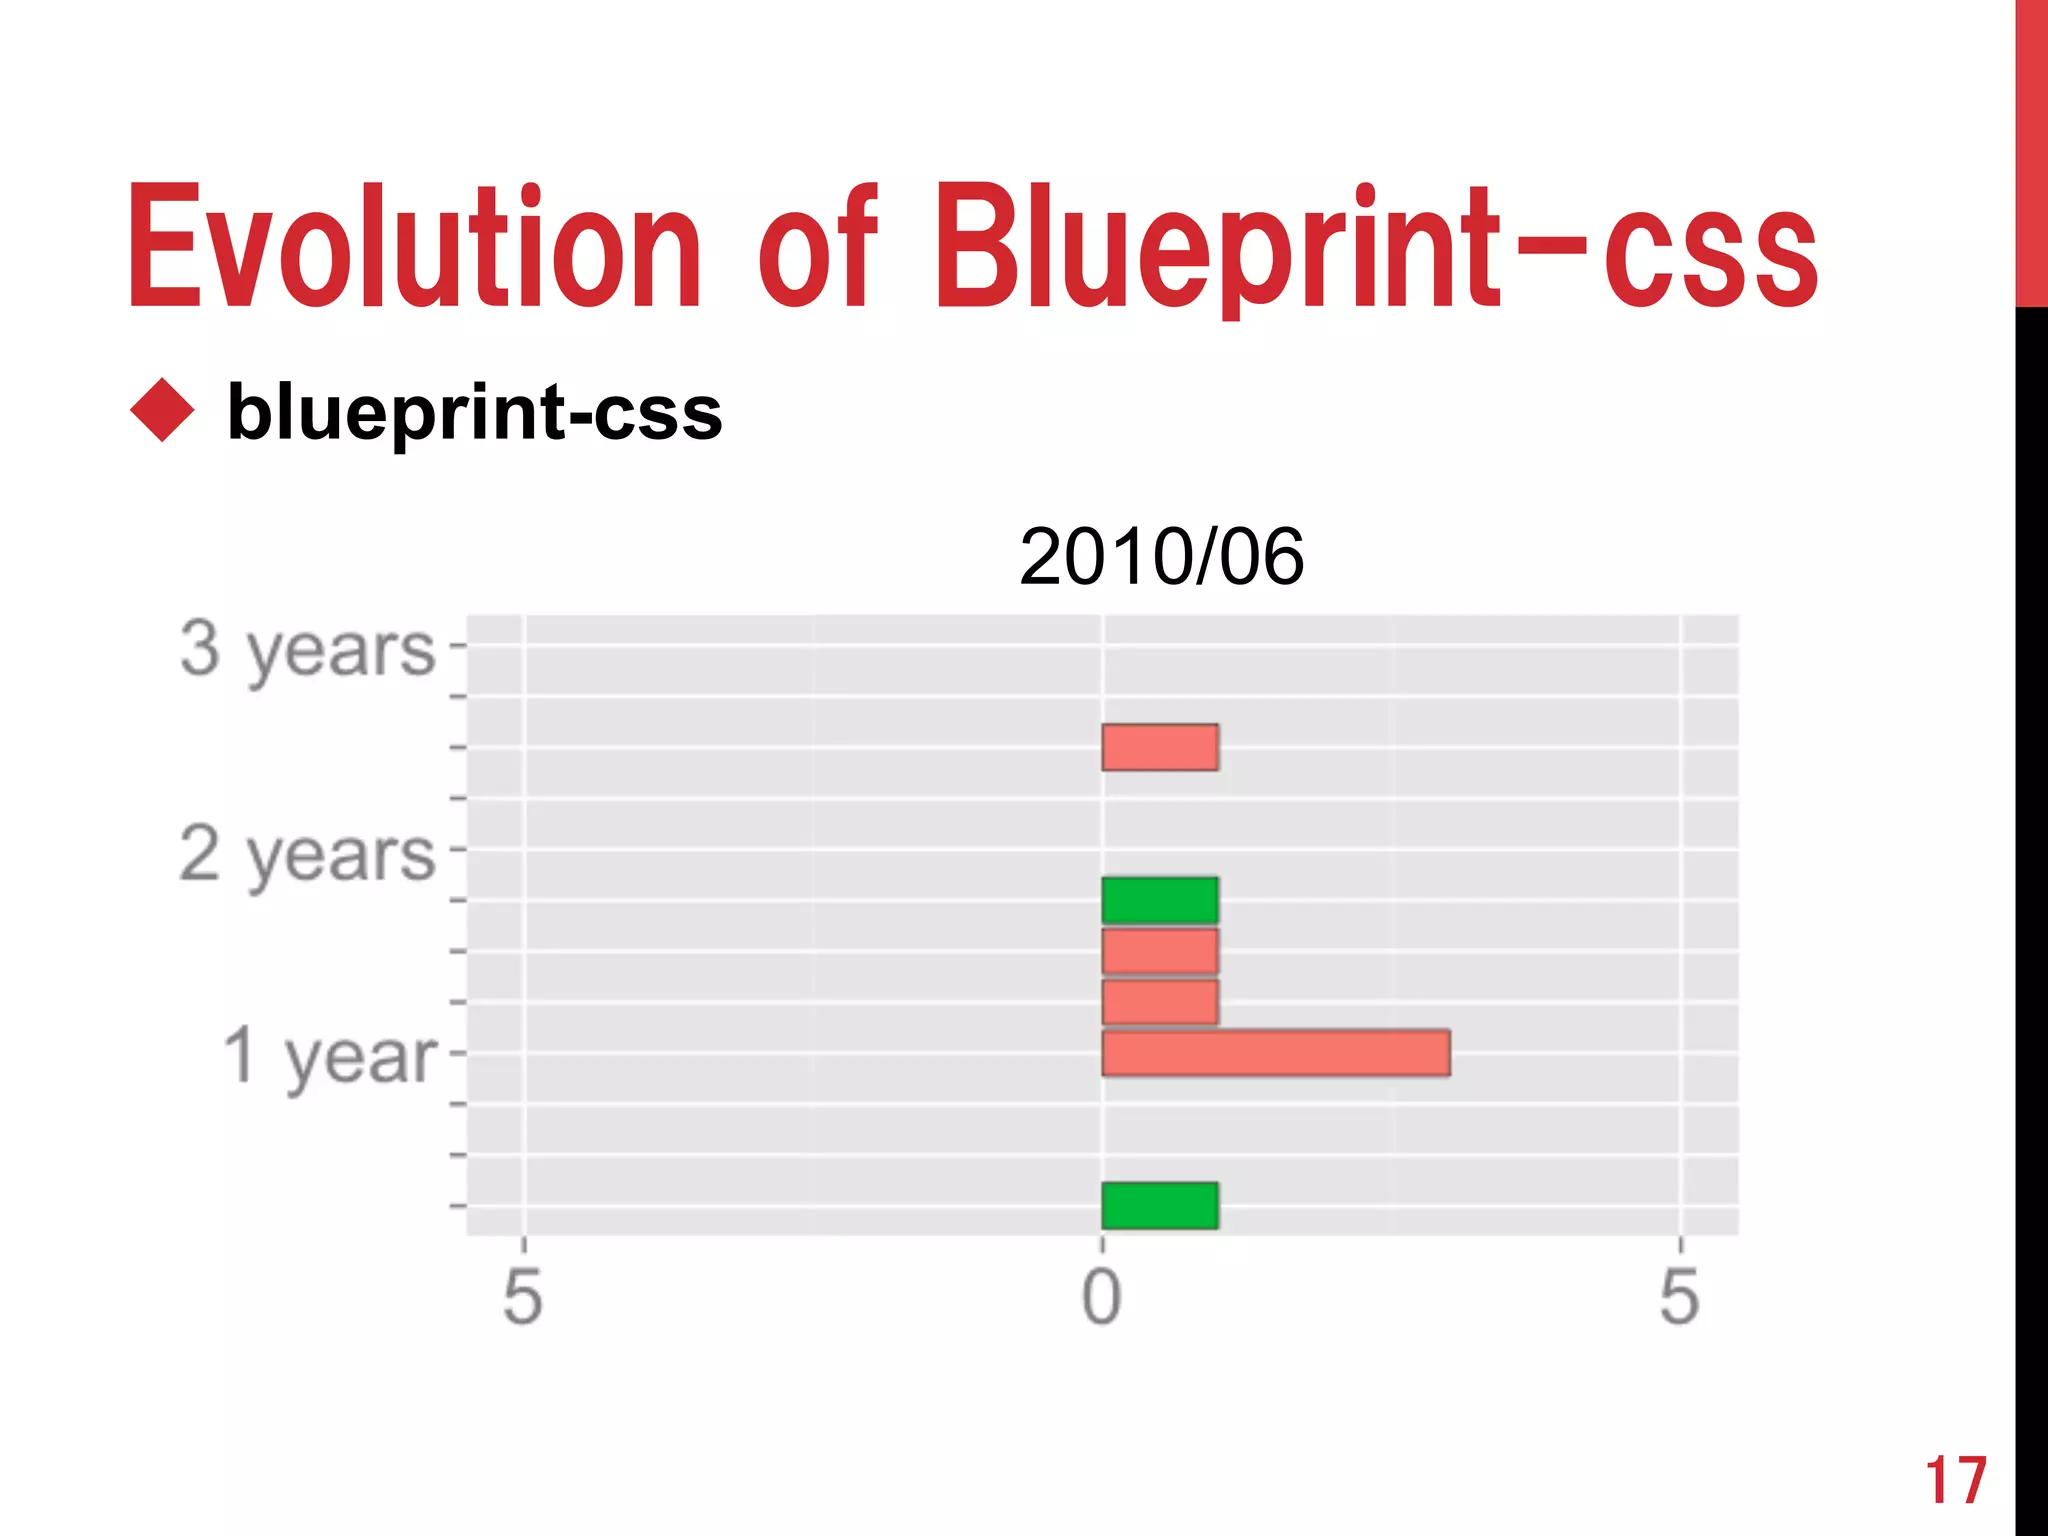
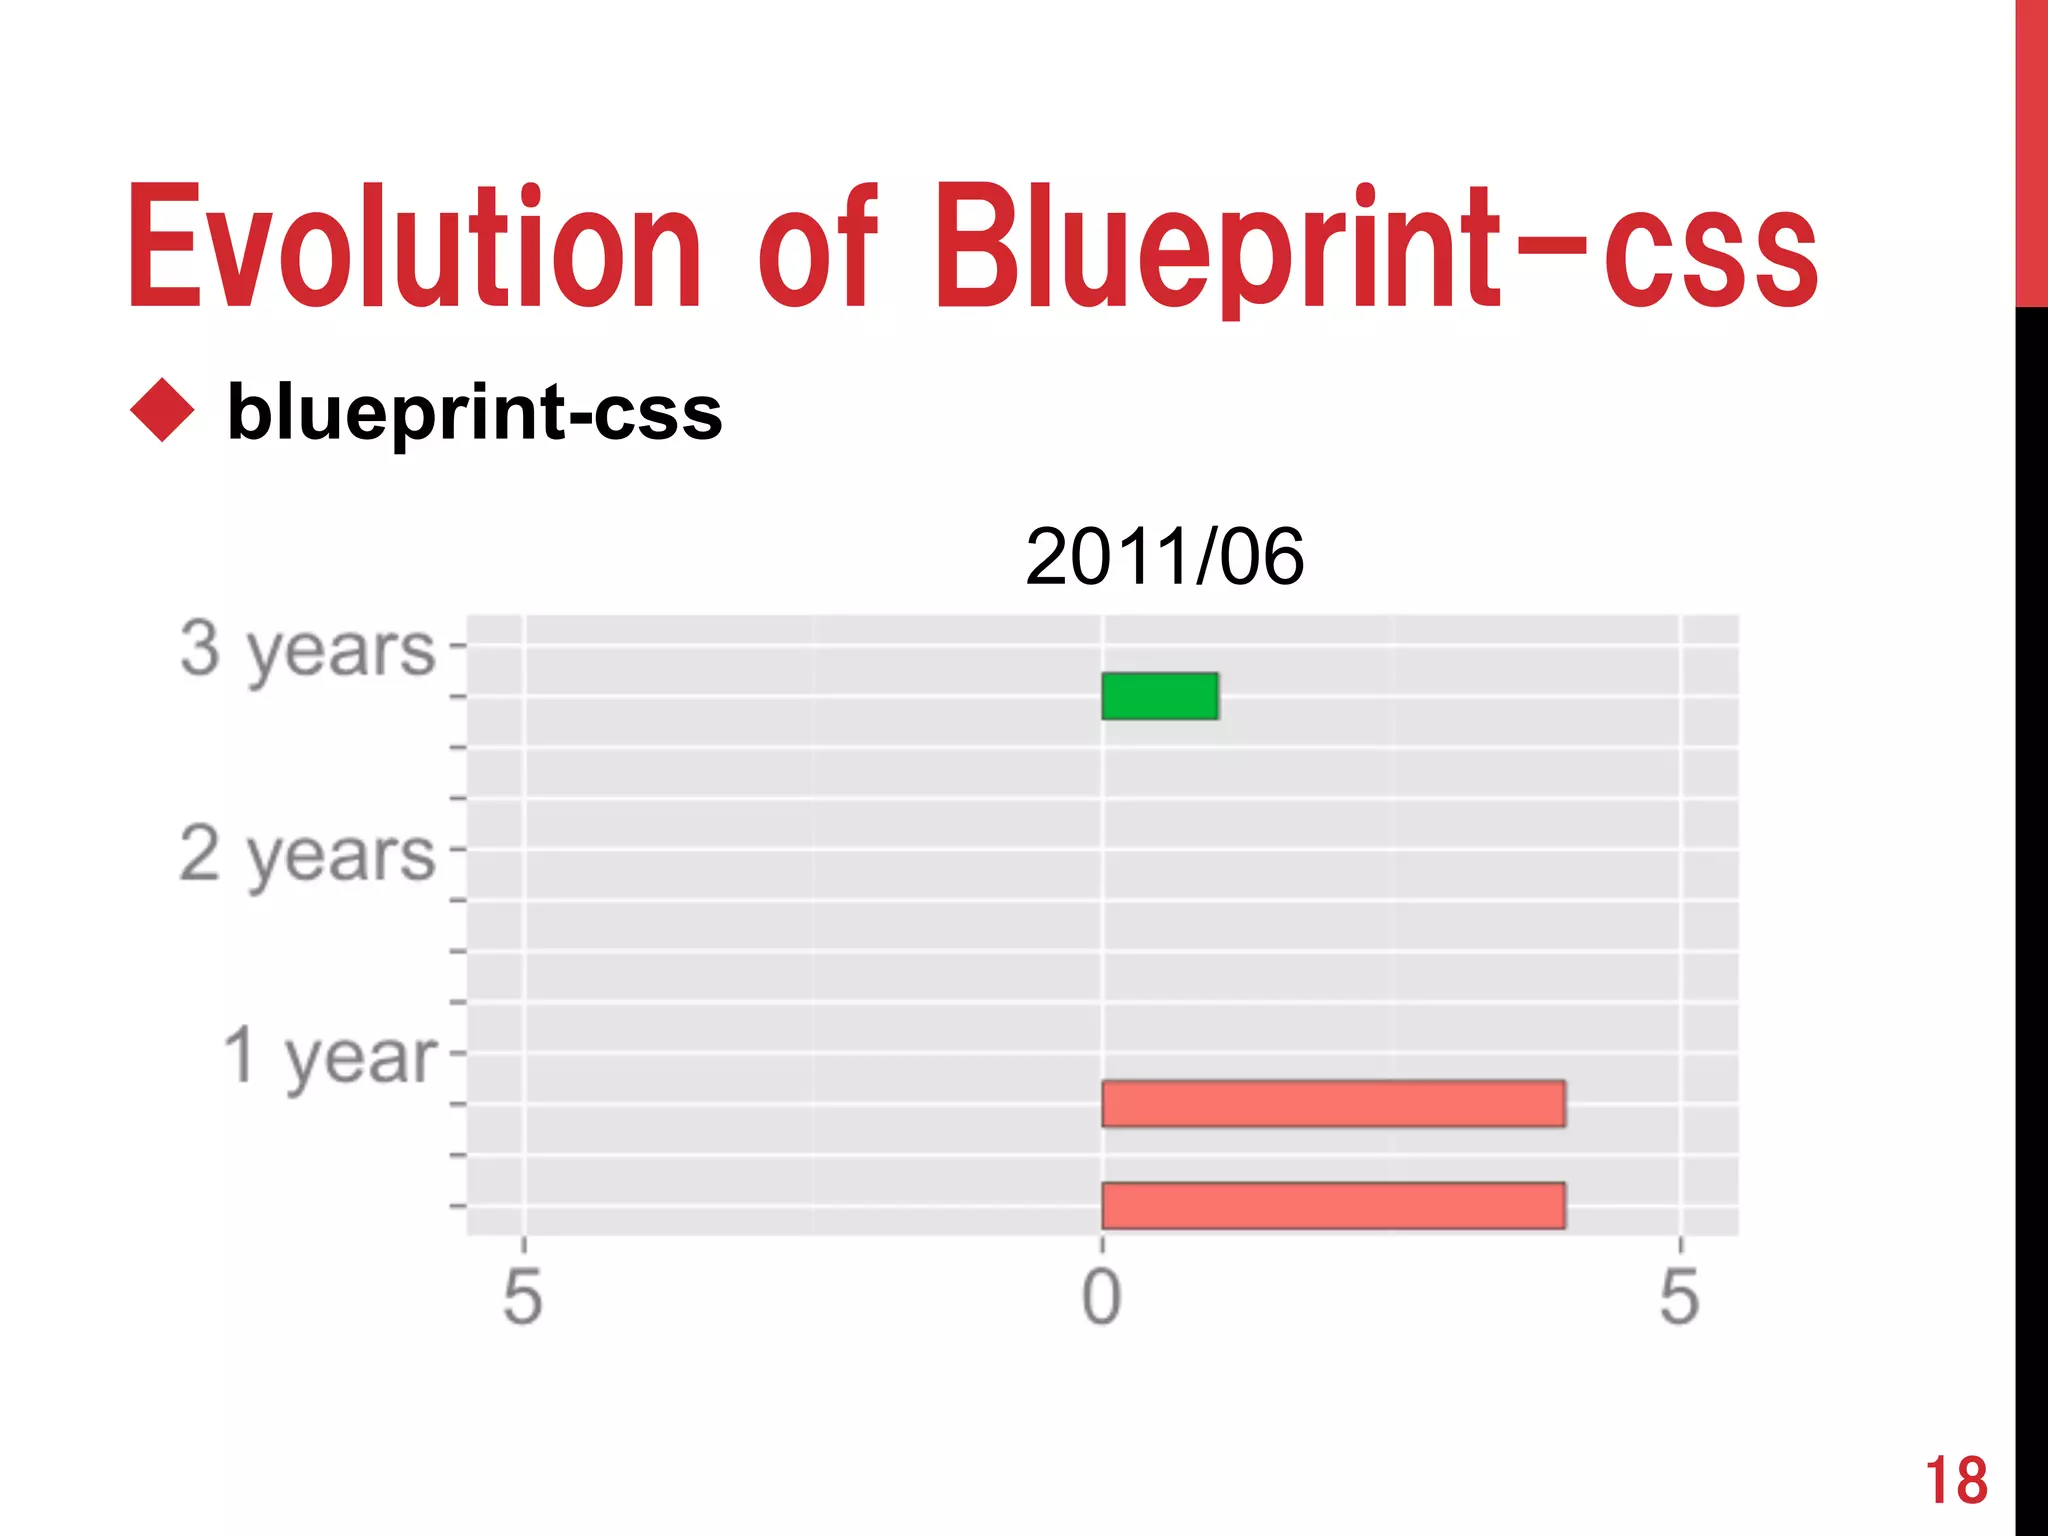
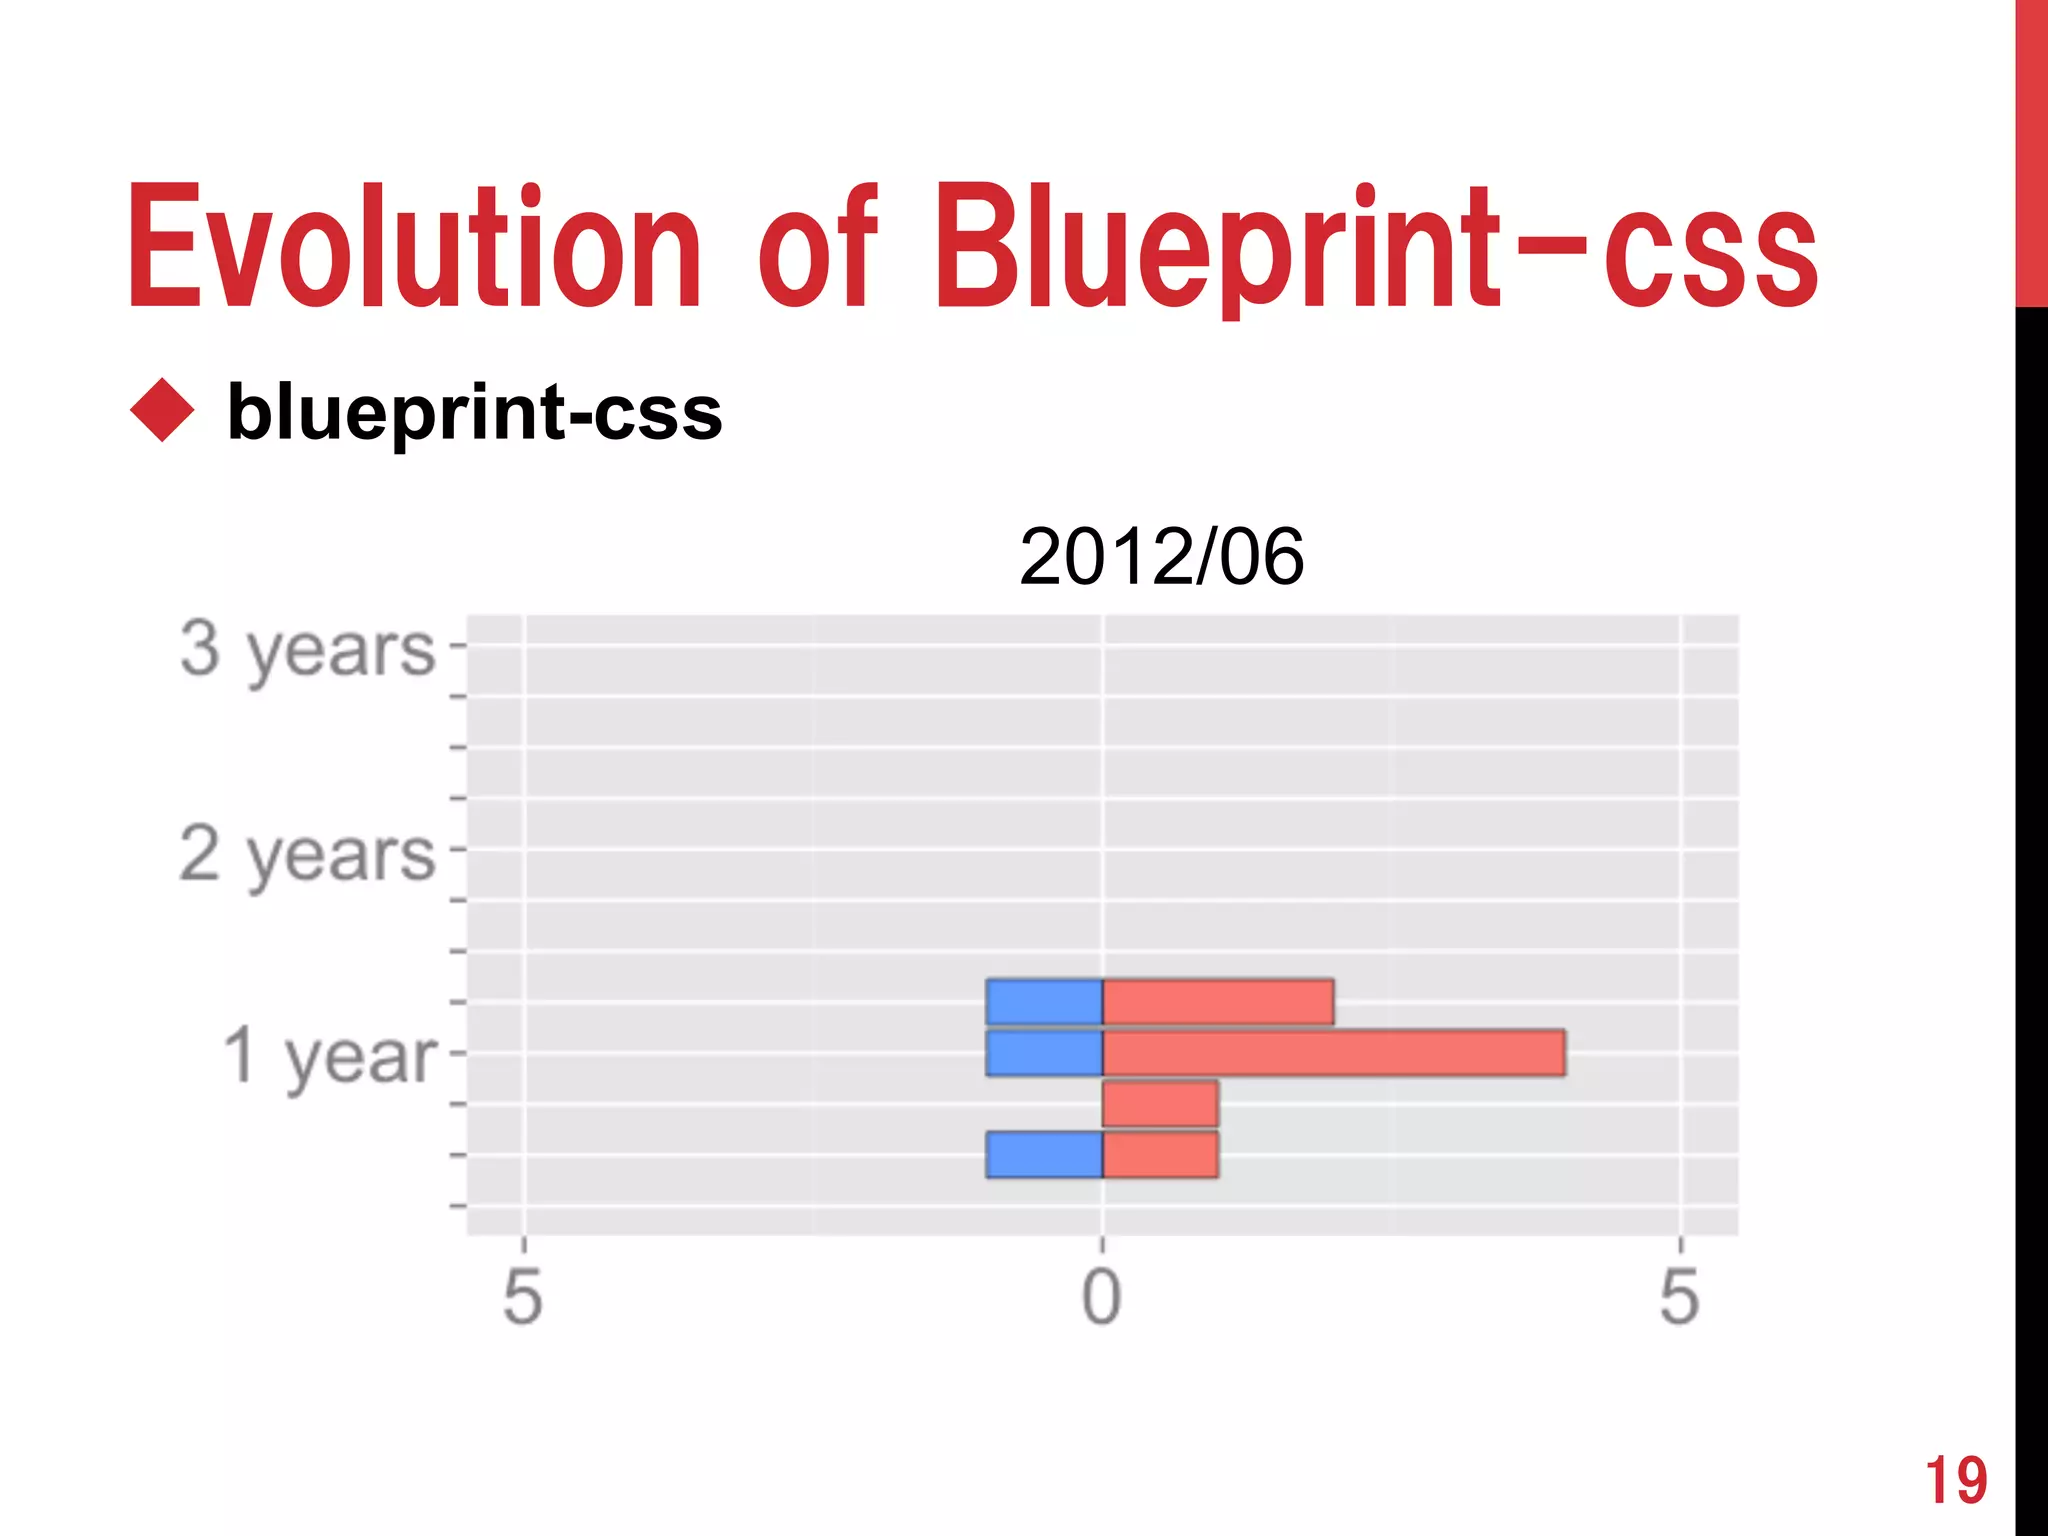
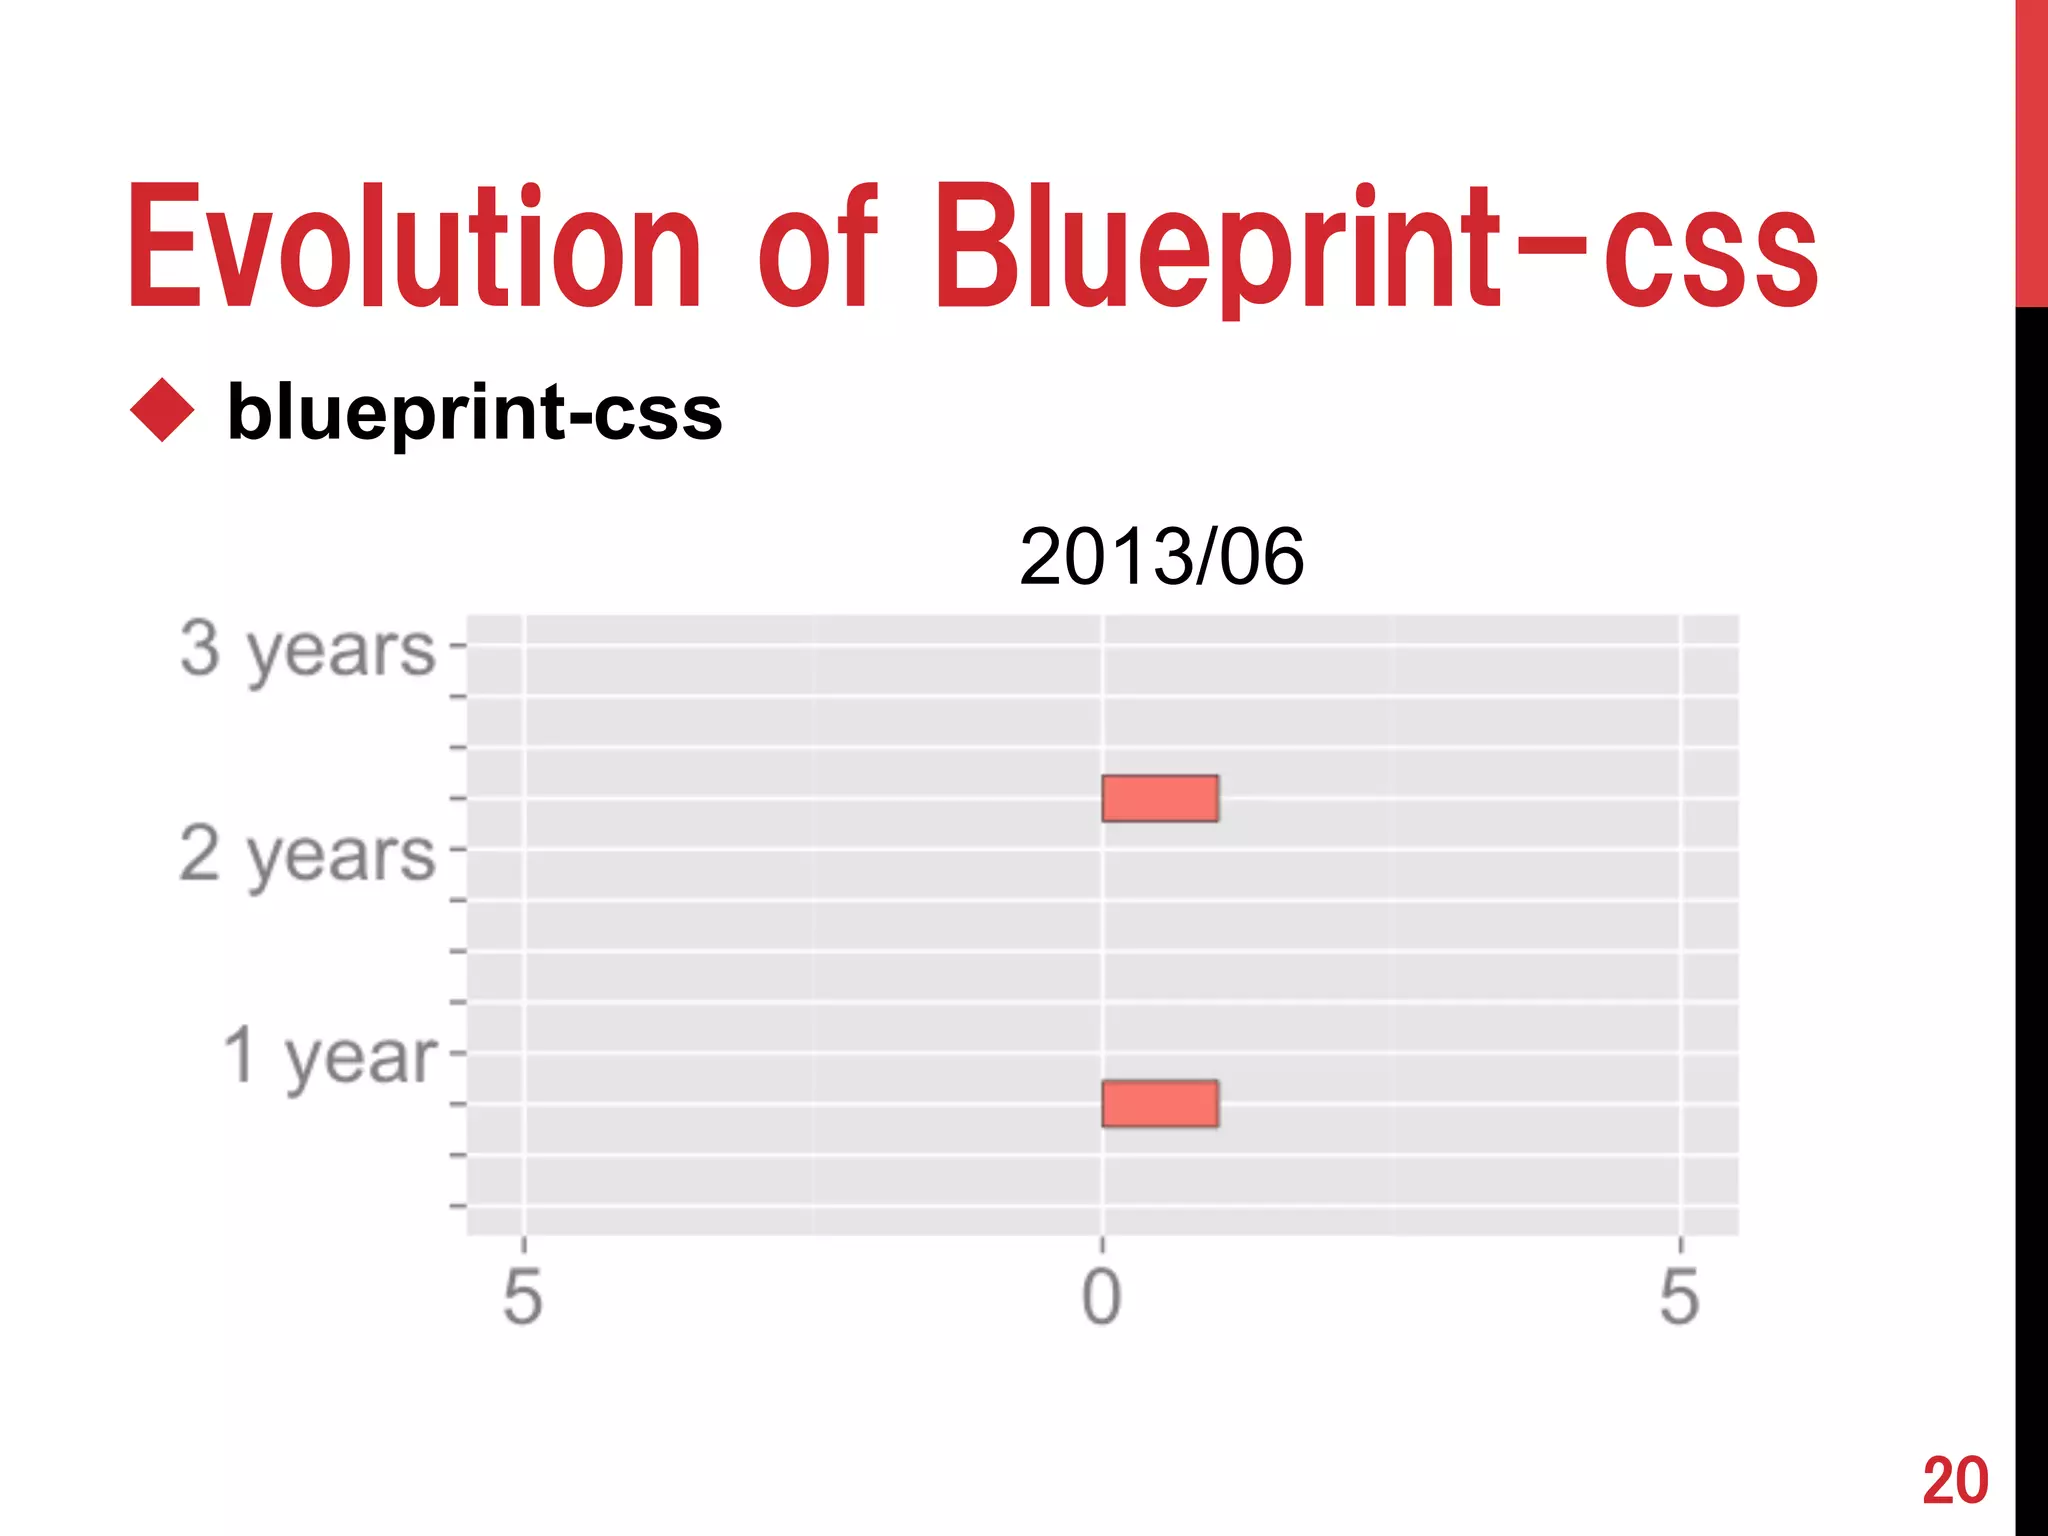
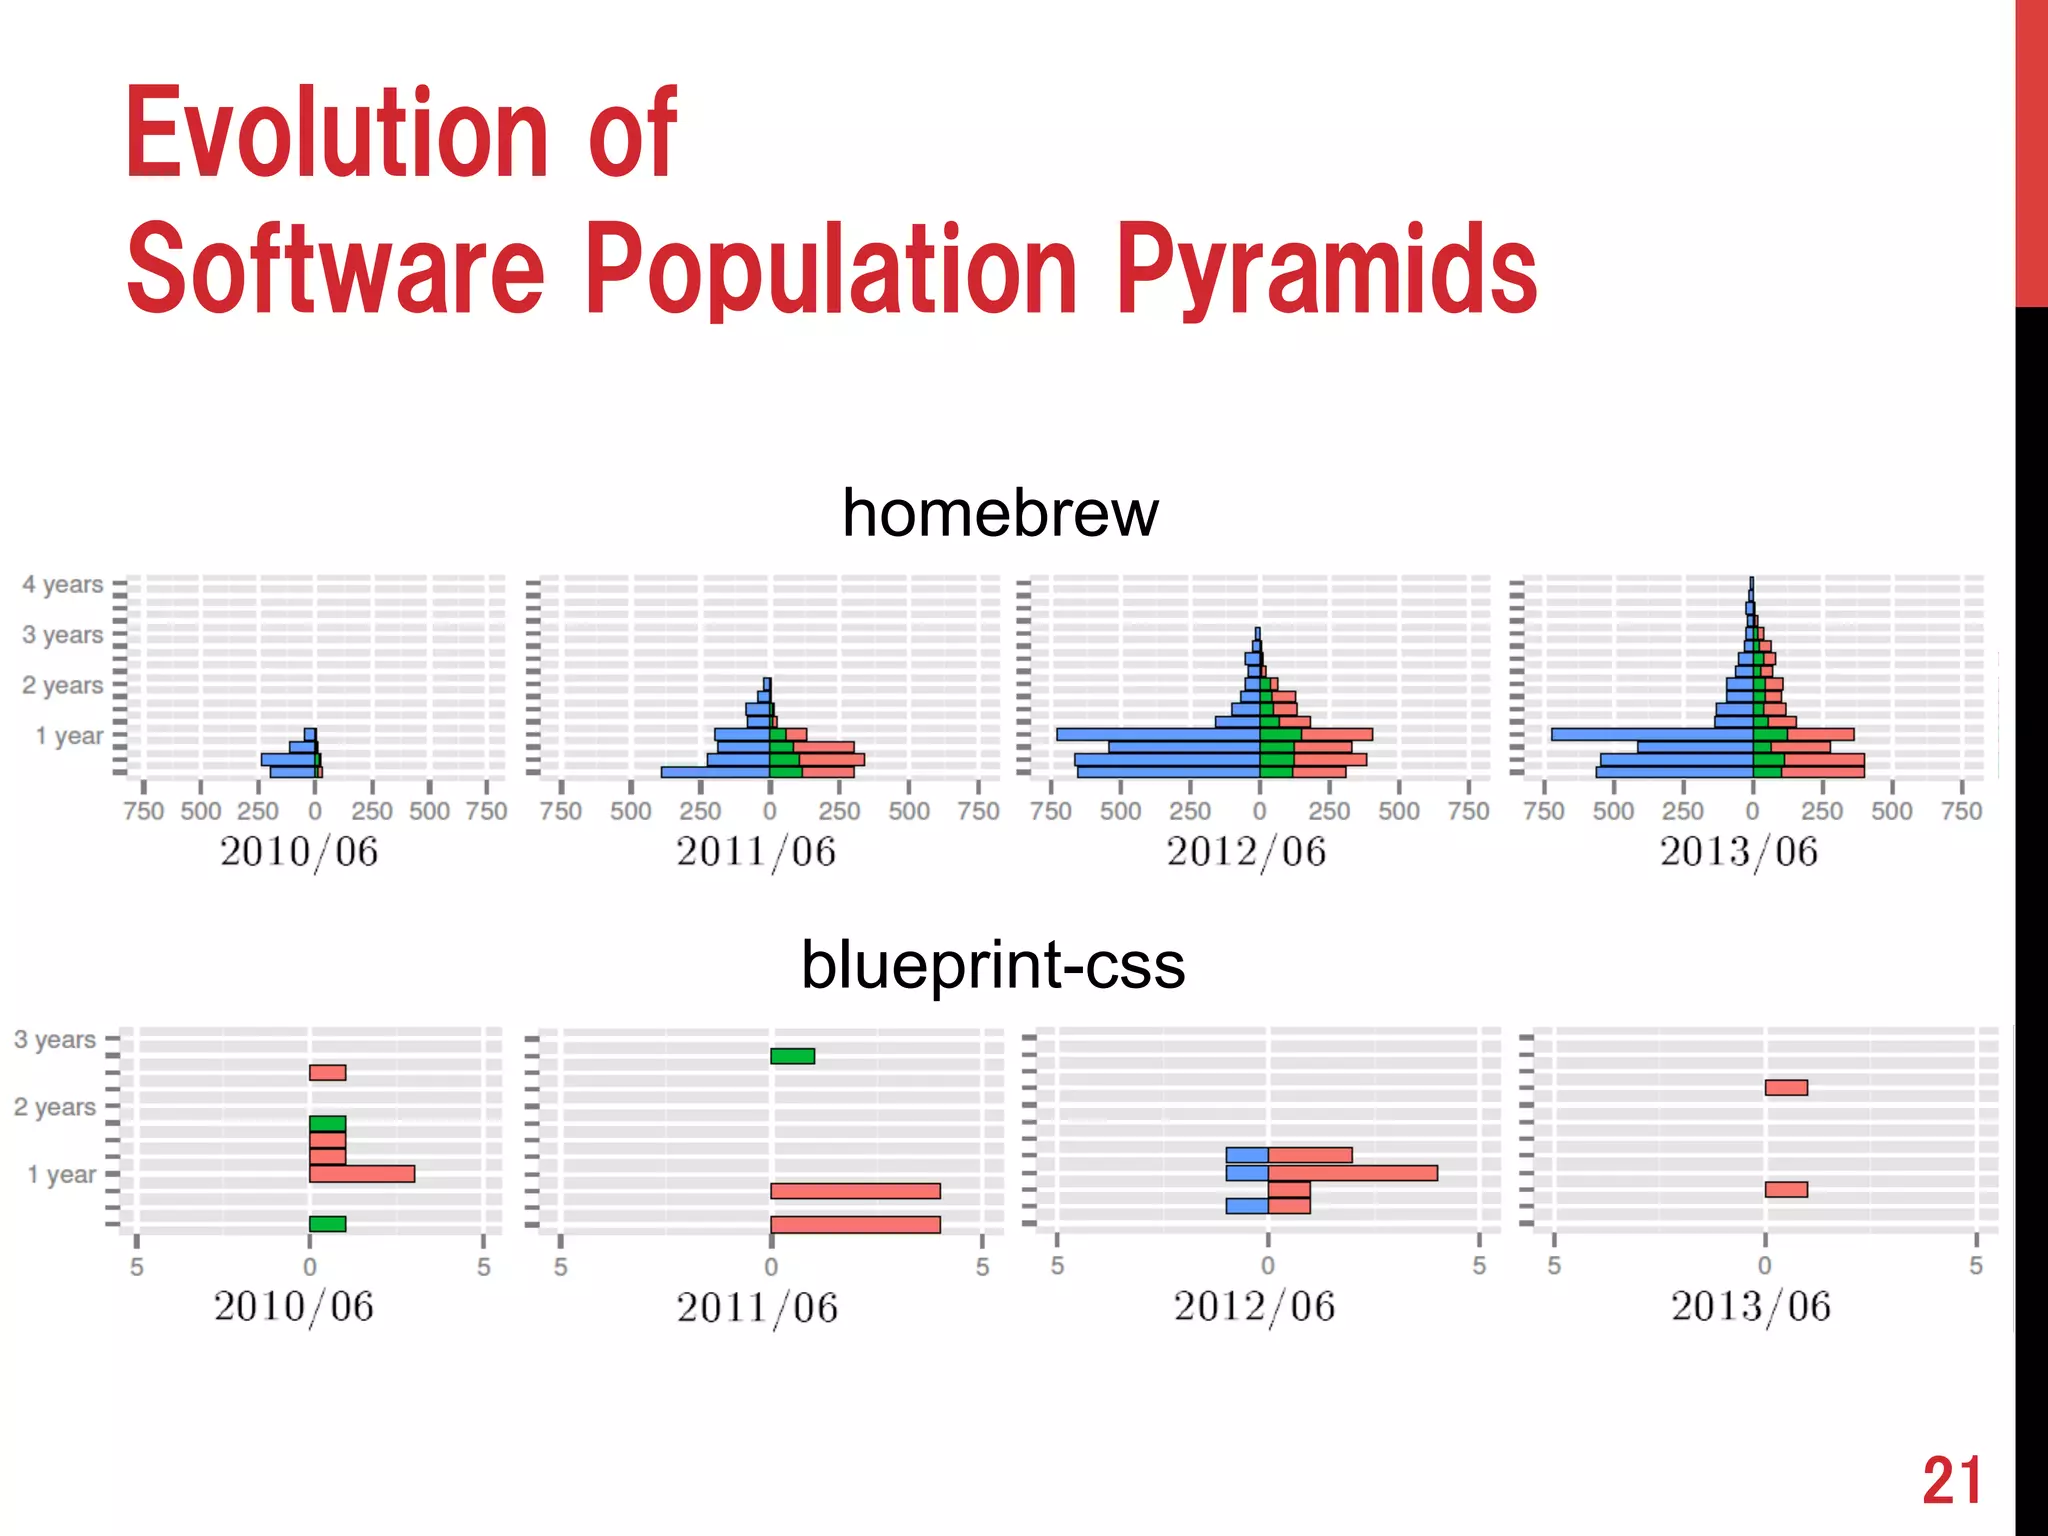
Software Population Pyramids:  
The Current and the Future of OSS Development 
Communities 
Saya Onoue, Hideaki Hata, Kenichi Matsumoto 
Nara Institute of Science and Technology, Japan
(General) Population Pyramids 
2010 Italy 
http://populationpyramid.net/ 2
(General) Population Pyramids 
u We can understand the 
current status of the 
country. 
u They are useful to predict 
the future. 
3 
2010 India 
2050 Italy 
http://populationpyramid.net/ 
This form is common in 
developing countries. 
This form is common in 
low birth rate and 
longevity countries.
Software Population Pyramid? 
4 
homebrew 2013
Software Population Pyramids 
u They represent a distribution of contributors 
to perform coding and discussion. 
• Discussion contributors: developers contribute to comments and/or 
issues. 
• Coding contributors: developers contribute to commits and/or pull 
requests. 
• Moved contributors: developers have started coding contributions 
after discussion contributions 
5
Dataset 
u We analyze the GitHub dataset provided by 
Gousios*. 
u This dataset includes developers' activity 
histories of 90 OSS projects. 
*G. Gousios. The ghtorent dataset and tool suite. In Proc. of MSR '13, pp. 233-236, 2013. 6
How to make a Software Population 
Pyramid 
period 
0 
number of contributors 
7 
Software population pyramid in t1 
Δt4 
Δt3 
Δt2 
Δt1 
contributor 1 
t1 
initc lastc 
coding 
less than Δt1
How to make a Software Population 
Pyramid 
8 
period 
0 
number of contributors 
initd lastd t2 
Δt4 
Δt3 
Δt2 
discussion 
initc lastc 
less than Δt1 
Δt1 
coding 
contributor 2 
Software population pyramid in t2 
t1
Research Questions 
1. Are there any types of software population 
pyramid in shape? 
2. How do software population pyramids 
change over time? 
9
10 
1. Types of  
Software Population Pyramids 
Type A 
Type B 
Type C 
Type D
11 
paperclip 2011/12 
Many discussion contributors, 
but less coding contributors. 
Type B
12 
clojure 2011/12 
Type C 
There is no moved contributors
Evolution of homebrew 
u homebrew 
13 
2010/06
Evolution of homebrew 
u homebrew 
14 
22001101/06
Evolution of homebrew 
u homebrew 
15 
220011021/06
Evolution of homebrew 
u homebrew 
16 
2200110231/06
u blueprint-css 
17 
Evolution of Blueprint-css 
2010/06
u blueprint-css 
18 
Evolution of Blueprint-css 
22001101/06
u blueprint-css 
19 
Evolution of Blueprint-css 
220011021/06
u blueprint-css 
20 
Evolution of Blueprint-css 
2200110231/06
21 
Evolution of 
Software Population Pyramids 
homebrew 
blueprint-css
Conclusion 
u We propose software population pyramids, graphical 
illustration of OSS communities. 
• We distinguish coders from not coding contributors. 
u The shapes of software population pyramids vary 
depending on the current status of development 
communities. 
• We found 4 types of the shapes. 
u Monitoring and maintaining software population 
pyramids can be useful to succeed in sustainable 
OSS communities. 
22

210 - Software Population Pyramids: The Current and the Future of OSS Development Communities

  • 1.
    Software Population Pyramids: The Current and the Future of OSS Development Communities Saya Onoue, Hideaki Hata, Kenichi Matsumoto Nara Institute of Science and Technology, Japan
  • 2.
    (General) Population Pyramids 2010 Italy http://populationpyramid.net/ 2
  • 3.
    (General) Population Pyramids u We can understand the current status of the country. u They are useful to predict the future. 3 2010 India 2050 Italy http://populationpyramid.net/ This form is common in developing countries. This form is common in low birth rate and longevity countries.
  • 4.
  • 5.
    Software Population Pyramids u They represent a distribution of contributors to perform coding and discussion. • Discussion contributors: developers contribute to comments and/or issues. • Coding contributors: developers contribute to commits and/or pull requests. • Moved contributors: developers have started coding contributions after discussion contributions 5
  • 6.
    Dataset u Weanalyze the GitHub dataset provided by Gousios*. u This dataset includes developers' activity histories of 90 OSS projects. *G. Gousios. The ghtorent dataset and tool suite. In Proc. of MSR '13, pp. 233-236, 2013. 6
  • 7.
    How to makea Software Population Pyramid period 0 number of contributors 7 Software population pyramid in t1 Δt4 Δt3 Δt2 Δt1 contributor 1 t1 initc lastc coding less than Δt1
  • 8.
    How to makea Software Population Pyramid 8 period 0 number of contributors initd lastd t2 Δt4 Δt3 Δt2 discussion initc lastc less than Δt1 Δt1 coding contributor 2 Software population pyramid in t2 t1
  • 9.
    Research Questions 1.Are there any types of software population pyramid in shape? 2. How do software population pyramids change over time? 9
  • 10.
    10 1. Typesof Software Population Pyramids Type A Type B Type C Type D
  • 11.
    11 paperclip 2011/12 Many discussion contributors, but less coding contributors. Type B
  • 12.
    12 clojure 2011/12 Type C There is no moved contributors
  • 13.
    Evolution of homebrew u homebrew 13 2010/06
  • 14.
    Evolution of homebrew u homebrew 14 22001101/06
  • 15.
    Evolution of homebrew u homebrew 15 220011021/06
  • 16.
    Evolution of homebrew u homebrew 16 2200110231/06
  • 17.
    u blueprint-css 17 Evolution of Blueprint-css 2010/06
  • 18.
    u blueprint-css 18 Evolution of Blueprint-css 22001101/06
  • 19.
    u blueprint-css 19 Evolution of Blueprint-css 220011021/06
  • 20.
    u blueprint-css 20 Evolution of Blueprint-css 2200110231/06
  • 21.
    21 Evolution of Software Population Pyramids homebrew blueprint-css
  • 22.
    Conclusion u Wepropose software population pyramids, graphical illustration of OSS communities. • We distinguish coders from not coding contributors. u The shapes of software population pyramids vary depending on the current status of development communities. • We found 4 types of the shapes. u Monitoring and maintaining software population pyramids can be useful to succeed in sustainable OSS communities. 22