1. The Deregulation of Interest Rates
Rudi Acx
National Bank of Belgium, Head of Financial and Economic Statistics,
boulevard de Berlaimont 14,
B - 1000 Brussels - Belgium
Tel : 32 2 221 24 03; Fax : 32 2 221 32 30; E-mail : rudi.acx@nbb.be
Catholic University of Brussels (KU Brussel)
Olivier Coene
National Bank of Belgium, Financial and Economic Statistics,
boulevard de Berlaimont 14,
B - 1000 Brussels - Belgium
Tel : 32 2 221 43 53; Fax : 32 2 221 31 97; E-mail : olivier.coene@nbb.be
1
1. Introduction
Retail interest rates in Belgium were set on a concertation base till far in the eighties, early
nineties. Under the pressure of the European anti-cartel legislation this way of interest rate setting
was not longer acceptable. For that reason, the concertation by the banks on the interest rate setting
for time deposits was abandoned in 1987 and the one by the public credit institutions on medium
term debt securities came gradually to an end in the beginning of the nineties. One may expect that
through a market driver rate setting, the volatility of the retail interest rate will increase.
An important part of the money market in Belgian Franc consists of Treasury bills. The
interest rate was set by the central bank until January 1991. Given the flexibility of the issues, there
was no active secondary market in these bills. Since the introduction of the new monetary policy
framework in January 1991 Treasury bills are issued through auctions. This paper investigates in its
second part the in(dependence) and causality between the interest rate on Treasury bills and the
interbank interest rate.
2. Volatility of interest rates in the retail market
Before presenting the results, the used methodological approach is explained.
2.1. Used methodology
To compute the volatility the so-called classical logarithmic volatility is used. This approach
is the standard in the market and calculates the moving standard deviation (SD) of the logarithm of
the ratio for two successive interest rates levels.
1 (1) å ( - ) 2
= - = å
-
=
i
i
i
i V
n
V V V Ln rate t rate t V
n
SD
1
; where ( / 1) and
1
(2)Volat = SD N
For the concerned financial instruments volatility was computed for both subperiods. To test
the potential difference in average volatility in both periods the rough "test of difference between
two populations" is applied. This test has a decision criterion formally implied by a z-distribution
(5 % level).
2. = - - where 1, 2 refers to period 1 resp. 2
2
(3)
d
2
2
2
x x
1 2
2
1
n n
1
z
s s
+
d test value (here zero)
2.2. Results
For the time deposits, the interest rate on 3 months deposits was selected and the two
subperiods are January 1980-June 1987 respectively August 1987-February 1999. For debt
securities the rate on debt securities with an original maturity of 3 years was retained, while the
subperiods are January 1971-June 1991 and July 1991-February 1999.
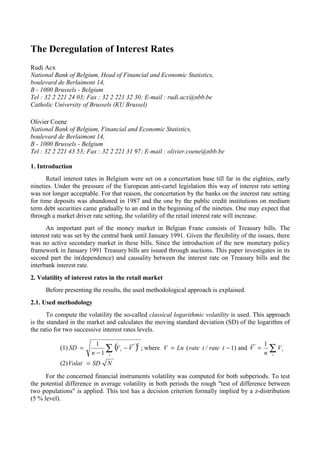
The average volatility of time deposit interest rate amounts to 14.9 p.c. in the first period and
to 13.4 p.c. during the second period. For the debt securities the results are 6.6 p.c. respectively
11.8 p.c. For the time deposits the null hypothesis is not rejected while for the debt securities the
null hypothesis is rejected, suggesting a higher volatility since the public credit institutions
abolished their concerted interest rate setting.
For both rates the relative changes in the interest rate level is not different between the two
concerned periods.
40
30
20
10
0
Debt securities (3 years)
Time deposits (3 months)
oc9905b
70 71 72 73 74 75 76 77 78 79 80 81 82 83 84 85 86 87 88 89 90 91 92 93 94 95 96 97 98 99
)LJXUH(YROXWLRQRIWKHLQWHUHVWUDWHYRODWLOLWPRQWKOREVHUYDWLRQV
3. As can be observed in Figure 1, the volatility of the interest rate on time deposits in the
second period is heavily influenced by the exchange rate crisis started in August 1993. When
eliminating this special event the second period was recalculated not taking into account this crisis
period. The result from this alternative suggests a significant higher volatility during the first period.
3. The Causality between Benchmark Interest Rates in the Money Market
As for the analysis of the volatility, the methodology is first presented while afterwards the
results will be discussed.
3.1. Used methodology
Two families of methods to track the causality are retained to measure the growing efficiency
in the money markets. The first one is the so-called Granger causality model which tests the
improvement between the results of an unrestricted regression taking into account the past values
of the causal variable and the past values of the caused variable and the results of a restricted
regression which uses only the past values of the caused variable. A hypothesis test is then
implemented to determine if the coefficients of the causal variables in the unrestricted regression
are significantly different from zero. To formally decide the F-ratio distribution is used at the level
of 5%.
4. y = + º =å + f
3
(4) ( )
/
ESS ESS K
U R
/( 1 1)
RSS n k
F
U
-
-
= where
u, r = un- resp. restricted equation
ESS stands for explained sum of square
RSS is the residual sum of square
K is the maximum lag
n1 = n-K and n is the number of
observations
k1 is the number of parameters estimated in
the unrestricted regression
The second approach of causal relation is the cross correlation function (CCF) and the process
of prewhitening which rends meaningful this cross correlation. The transfer function (5) is the
relation between an explicative leading time-series and a leaded time-series. To measure the
structure of the relationship and to modelize the transfer function, the cross correlation function (8)
is used and provides the time profile of correlation between the two series. The two gross series
have to be transformed: the causal series must be transformed into a white noise process (6), i.e. a
series of innovations, where a is the transformed series; the caused series must be prewhitened (7)
by the model of the causal series. The two transformed series are then cross-correlated. We stress
on the fact that for the lag k the cross correlation (10) is proportional to the parameters of the final
model (5).
(5) ( )
w B B
( )
( B
)
t ( ) t t t t t
b
t a y v x n
B
x
B
q
d
(6) a =q -1 ( B ) f ( B ) x
t x x t (7) e =q -1 ( B ) f ( B ) y
t x x t (8) r ( k ) = g ( a a k ) /
s s e e e a (9) g ( k ) = E [ a e ]a
e t t + k s
(10) r ( )
e
a s
a
k e v = k ·
Where:
B is a backshift operator
w(B) stands for the
unpatterned spikes and the
decay start-up of the CCF
d(B) stands for the decay
pattern of the CCF
q(B), f(B) stands for the MA,
resp. AR part of an ARIMA
model
3.2. Results
The tests on causality were performed using daily interest rate data for the period
October 1989-December 1998. For the first period, the one before 29 January 1991, only the rates
on Treasury bills at the time of issue are available due to lack of an active secondary market. During
the second period the same approach was kept to insure comparability between both periods. For
the BIBOR all daily observations were incorporated. The exercise confronts for both types of
investment, which do form quasi-perfect alternatives for most agents, the rate for the 3 months
maturity.
Following the Granger causality approach, the results suggest that during the first period the
rate on Treasury bill influences the interbank deposit rate, while the reverse influence was not
confirmed. During the period after the introduction of the new monetary policy framework, the
Granger test suggests that both rates do influence mutually. For this second period the F-value in
case of testing the causality from BIBOR to the Treasury bill interest rate is however much higher
than in the case of the reverse direction.
7DEOH*UDQJHUFDXVDOLWUHVXOWV
F-test 5% limit Heuristic
Period 1: TB=f(BIBOR) 1,345 1,902 No influence
BIBOR=f(TB) 13 1,902 Influence
Period 2: TB=f(BIBOR) 94 1,883 Influence
BIBOR=f(TB) 3,2 1,883 Influence
5. The results of the cross correlation function approach do confirm the outcome of the Granger
test for the first period, suggesting a very quick - the same day and the following day -
incorporation of the interest rate behaviour of the Treasury bill in the BIBOR. For the second period
the cross correlation function shows a significant causality of the BIBOR to the Treasury bill
interest rate. This confirms to a certain extent the, not statistical significant, Granger result.
4
-9 -8 -7 -6 -5 -4 -3 -2 -1 0 1 2 3 4 5 6 7 8 9
0.3
0.25
0.2
0.15
0.1
0.05
0
-0.05
-9 -8 -7 -6 -5 -4 -3 -2 -1 0 1 2 3 4 5 6 7 8 9
0.5
0.4
0.3
0.2
0.1
0
-0.1
oc9905a
2 s.e. 2 s.e.
First period: correlation of Bibor and TB. Second period: correlation of TB and Bibor
)LJXUHURVVFRUUHODWLRQV
When testing the causality between the BIBOR and the secondary market interest rate on
Treasury bills for the second period it seems that there is a simultaneous influence because the
significant cross correlation of 0.73 is situated at lag zero. However there is a small - but significant
- cross correlation at lag 1 suggesting causality from the Treasury bill rate to the BIBOR.
These conflicting results for the second period may be explained through the different base
data. When testing on the Treasury bill interest rate at issue (which is an auction, American style)
competitive bidders will take account of past developments in forming their expectations about the
outcome of the auctions. When testing on data from the secondary market that institutional aspect
no longer plays a role. Combining the suggested causality in the second period based on the issues
and the suggested simultaneousness of the secondary market data makes the results of the first test
mentioned spurious.
4. Conclusion
The statistical tests on volatility lead to mixed outcomes. While for the debt securities at
3 year the concerted interest rate setting resulted in less volatility than the market driven setting,
this was not confirmed for the time deposits at 3 month. The analysis on causality between
benchmark rates in the money market confirms the leading character of the rate on Treasury bills
during the period before the new monetary policy framework of 29 January 1991. After the
introduction of that new framework the market efficiency has improved but some evidence is found
that the rate on Treasury bills seems to dominate. It is obvious that this relationship might have
changed since stage three of the European Monetary Union.
RÉSUMÉ
Le présent article a pour but de développer quelques résultats empiriques concernant les
conséquences de la dérégulation dans la fixation des taux d'intérêts à la clientèle et de la mise en
place d'un nouveau marché des certificats de trésorerie (CT) en Belgique. Il apparaît pour des
instruments à court terme (dépôts à terme à 3 mois) que la dérégulation n'a pas entraîné une
différence statistiquement significative de volatilité ; par contre, la volatilité s'est accrue pour des
instruments à moyen terme comme les bons de caisse à 3 ans. Afin de cerner les effets de la mise en
place d'un nouveau marché des CT en 1991 la présence de causalité (à la Granger et selon le
modèle de corrélation croisée des séries chronologiques) entre les taux des CT à trois mois et du
BIBOR à trois mois a été testée. Il apparaît pour la première période que les taux des CT avait une
influence sur le BIBOR, tandis que dans la seconde période il existe une certaine interaction,
comme l'on pouvait s'y attendre.