
Recommended
Recommended
More Related Content
What's hot
What's hot (17)
Similar to 2017 E-Stats Report: Measuring the Electronic Economy
Similar to 2017 E-Stats Report: Measuring the Electronic Economy (20)
More from Δρ. Γιώργος K. Κασάπης
More from Δρ. Γιώργος K. Κασάπης (20)
Recently uploaded
Recently uploaded (20)
2017 E-Stats Report: Measuring the Electronic Economy
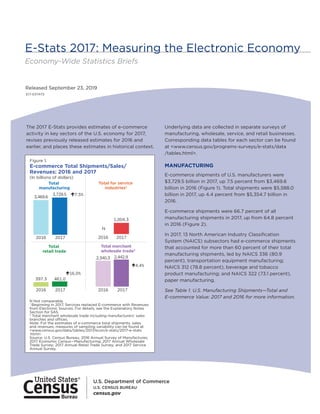
- 1. Economy-Wide Statistics Briefs E-Stats 2017: Measuring the Electronic Economy Released September 23, 2019 E17-ESTATS The 2017 E-Stats provides estimates of e-commerce activity in key sectors of the U.S. economy for 2017, revises previously released estimates for 2016 and earlier, and places these estimates in historical context. Underlying data are collected in separate surveys of manufacturing, wholesale, service, and retail businesses. Corresponding data tables for each sector can be found at <www.census.gov/programs-surveys/e-stats/data /tables.html>. MANUFACTURING E-commerce shipments of U.S. manufacturers were $3,729.5 billion in 2017, up 7.5 percent from $3,469.6 billion in 2016 (Figure 1). Total shipments were $5,588.0 billion in 2017, up 4.4 percent from $5,354.7 billion in 2016. E-commerce shipments were 66.7 percent of all manufacturing shipments in 2017, up from 64.8 percent in 2016 (Figure 2). In 2017, 13 North American Industry Classification System (NAICS) subsectors had e-commerce shipments that accounted for more than 60 percent of their total manufacturing shipments, led by NAICS 336 (80.9 percent), transportation equipment manufacturing; NAICS 312 (78.8 percent), beverage and tobacco product manufacturing; and NAICS 322 (73.1 percent), paper manufacturing. See Table 1. U.S. Manufacturing Shipments—Total and E-commerce Value: 2017 and 2016 for more information. Figure 1. E-commerce Total Shipments/Sales/ Revenues: 2016 and 2017 3,469.6 3,729.5 (In billions of dollars) Total manufacturing N Not comparable. 1 Beginning in 2017, Services replaced E-commerce with Revenues from Electronic Sources. For details, see the Explanatory Notes Section for SAS. 2 Total merchant wholesale trade including manufacturers’ sales branches and offices. Note: For the estimates of e-commerce total shipments, sales, and revenues, measures of sampling variability can be found at <www.census.gov/data/tables/2017/econ/e-stats/2017-e-stats .html>. Source: U.S. Census Bureau, 2016 Annual Survey of Manufactures; 2017 Economic Census—Manufacturing; 2017 Annual Wholesale Trade Survey; 2017 Annual Retail Trade Survey; and 2017 Service Annual Survey. 20172016 N 1,004.3 Total for service industries1 20172016 397.3 461.0 16.0% 7.5% Total retail trade 20172016 2,340.3 2,442.9 4.4% Total merchant wholesale trade2 20172016
- 2. 2 U.S. Census Bureau WHOLESALE Total e-commerce sales for merchant wholesalers in the United States, including manufacturers’ sales branches and offices (MSBOs), were up 4.4 percent to $2,442.9 billion in 2017 from a revised $2,340.3 billion in 2016 (Figure 1). Total sales increased by 5.9 percent to $7,623.0 billion in 2017 from a revised $7,195.7 billion in 2016. E-commerce sales of merchant wholesalers, including MSBOs, were 32.0 percent of total sales in 2017 (Figure 2). E-commerce sales accounted for 27.7 percent of total sales of merchant wholesalers, excluding MSBOs in 2017, while e-commerce sales were 43.7 percent of the sales of MSBOs. See Table 2. U.S. Merchant Wholesale Trade Sales, Including Manufacturers’ Sales Branches and Offices— Total and E-commerce: 2017 and 2016 for more information. SERVICES The 2017 Service Annual Survey (SAS) collected “Revenues from Electronic Sources,” replacing the e-commerce question of previous survey years. Due to this change, only total revenues and revenues from electronic sources estimates are available in this report. Historical data tables reflect data from the discontinued e-commerce data series. For more information on this change and why it was implemented, please see the Explanatory Notes section for SAS. Revenues from electronic sources for service industries in the United States were $1,004.3 billion in 2017. Total revenues were $15,314.6 billion in 2017. Revenues from electronic sources were 6.6 percent of total revenues in 2017 (Figure 2). See Table 3. U.S. Services Revenue—Total and Revenue from Electronic Sources: 2017 and 2016 for more information. RETAIL Sales from e-commerce for U.S. retailers were $461.0 billion in 2017, up 16.0 percent from a revised $397.3 billion in 2016 (Figure 1). Total sales increased by 4.0 percent to $5,046.9 billion in 2017 from a revised $4,851.8 billion in 2016. E-commerce sales were 9.1 percent of total sales in 2017, up from a revised 8.2 percent in 2016 (Figure 2). See Table 4. U.S. Retail Trade Sales Total and E-commerce: 2017 and 2016 for more information. Supplemental tables utilizing annual data on total and e-commerce sales by primary business activity for Electronic Shopping and Mail-Order Houses (NAICS 4541) for 2015–2017 were released in April 2019. Tables can be found at <www.census.gov/data /tables/2017/econ/arts/supplemental-ecommerce .html>. On August 28, 2019, the U.S. Census Bureau released the Supplemental Quarterly Retail E-Commerce table, a new experimental data product that provides more granular e-commerce estimates. On a quarterly basis, the Census Bureau publishes the Quarterly Retail E-Commerce Sales Report, which provides national total retail e-commerce sales estimates. The new Supplemental Quarterly Retail E-Commerce table Figure 2. E-commerce as a Percentage of Total Shipments/Sales/Revenues: 2016–2017 * Year-to-year comparisons are not statistically different at the 90 percent confidence level. N Not comparable. 1 Total merchant wholesale trade, including manufacturers’ sales branches and offices. 2 Beginning in 2017, Services replaced E-commerce with Revenues from Electronic Sources. For details, see the Explanatory Notes Section for SAS. Note: For the estimates of e-commerce as a percentage of total shipments, sales, and revenues, measures of sampling variability can be found at <www.census.gov/data/tables/2017/econ /e-stats/2017-e-stats.html>. Source: U.S. Census Bureau, 2016 Annual Survey of Manufactures; 2017 Economic Census—Manufacturing; 2017 Annual Wholesale Trade Survey; 2017 Annual Retail Trade Survey; and 2017 Service Annual Survey. 2017 2016 64.8 66.7 32.0 32.5 9.1 8.2 6.6 N Total for service industries2 Total retail trade Total merchant wholesale trade*, 1 Total manufacturing Lorem ipsum
- 3. U.S. Census Bureau 3 provides e-commerce sales broken out by retailers' primary kind-of-business. For more information, go to <www.census.gov/retail /index.html>. EXPLANATORY NOTES General The estimates in this release are based on data collected by the Census Bureau for the following surveys: the Economic Census—Manufacturing, Annual Survey of Manufactures (ASM), Annual Wholesale Trade Survey (AWTS), Service Annual Survey (SAS), and Annual Retail Trade Survey (ARTS). All of these surveys were conducted independently. Measures of total economic activity and e-commerce are presented in this report to provide a broad perspective of e-commerce activity across the many sectors. Brief descriptions of the survey methods are given below. Industry classifications used in this report are based on the NAICS. Information about the NAICS and additional detail about coverage, sample design, and estimation methodology for the annual surveys may be found at <www.census.gov/programs-surveys /e-stats.html>. All current and prior reports, historical data tables, and past research papers are available at this same Web site. Measures of Economic Activity Economic Census—Manufacturing and ASM. “Value of shipments” is the measure used for manufacturing in the Economic Census—Manufacturing and the ASM. It is the value of all products shipped plus all miscellaneous receipts. Value of shipments includes shipments to outside customers as well as to affiliated establishments. E-commerce shipments (e-shipments) are online orders accepted for manufactured products from customers, including shipments to other domestic establishments of the same company for further manufacture, assembly, or fabrication where price and terms of sale are negotiated over the Internet, Extranet, Electronic Data Interchange (EDI) network, e-mail, or other online system. Payment may or may not be made online. AWTS and ARTS. “Sales” is the measure used in AWTS and ARTS. Sales are the dollar value of transactions between the reporting firm and its customers. Sales include transactions to foreign affiliates, but exclude transactions among domestic affiliates. E-commerce sales are sales of goods and services where the buyer places an order, or the price and terms of the sale are negotiated, over the Internet, mobile device (m-commerce), Extranet, EDI network, e-mail, or other comparable online system. Payment may or may not be made online. SAS. “Revenues” is the measure used in SAS. Revenues are the dollar value of transactions and contracts between reporting firms and their customers. These values include services performed for foreign affiliates, but exclude transactions among domestic affiliates. Revenues include the total value of service contracts, the market value of compensation received in lieu of cash, amounts received for work subcontracted to others, and other industry-specific items. Revenues from electronic sources include revenues from customers entering orders directly on a firm’s Web site or mobile application, revenues from customers entering orders directly on third party Web sites or mobile applications, and revenues from customers entering orders via any other electronic system (such as private networks, dedicated lines, kiosks, etc.). Beginning with the release of the 2017 SAS in November 2018, the e-commerce data series for service industries were discontinued and replaced by a new data series called “Revenues from Electronic Sources.” These changes were initiated in response to cognitive testing of survey participants conducted in 2017. This testing indicated that many services respondents were not including certain categories of electronic revenues in their response such as sales generated from third party Web sites and electronic systems other than public-facing Web sites. The new
- 4. 4 U.S. Census Bureau questions clarify the multiple types of revenue from electronic sources that are included in this data. Further information, including a description of both current and previous questions, can be found at <www.census.gov/programs-surveys/sas/newsroom /updates/new-data-series-for-revenue-from -electronic-sources-to-replace-e.html>. SURVEY METHODS Economic Census—Manufacturing and Annual Survey of Manufactures The 2017 data were obtained from the Economic Census—Manufacturing. The manufacturing universe is comprised of approximately 290,000 establishments. In the census, data are collected from establishments above a specified payroll cutoff that can vary by industry. Data for nonresponding establishments were imputed using information from responding establishments with similar characteristics. Establishments representing approximately 2 percent of the total 2017 value of shipments did not have an opportunity to report e-commerce shipments. The 2016 estimates of manufacturing shipments and e-shipments were derived from the 2016 ASM. The ASM is a survey of manufacturing establishments and represents activities at individual establishments rather than the entire company. In the ASM, data are collected annually from a probability sample of approximately 50,000 manufacturing plants as defined by the 2012 NAICS. Data for small- and medium-sized, single-establishment companies are estimated using information obtained from administrative sources. E-commerce questions were included on the Economic Census—Manufacturing and ASM questionnaires along with questions about employment, payroll, value of shipments, cost of materials consumed, and capital expenditures. Data for nonresponding plants were imputed using information from responding plants with similar characteristics. Shipments estimates for the NAICS subsectors were calculated by summing both the reported and the imputed plant data. For the ASM, the data were weighted by the reciprocal of the probability of the plant’s inclusion in the sample. The total shipment estimates were then linked to the 2012 Economic Census results to reduce sampling and nonsampling errors. For more information on the Economic Census— Manufacturing, see <www.census.gov/programs -surveys/economic-census.html>. For more information on the ASM, see <www.census .gov/programs-surveys/asm.html>. Annual Wholesale Trade Survey, Service Annual Survey, Annual Retail Trade Survey The AWTS measures the economic activity of merchant wholesale firms with paid employees (i.e., employer firms) including MSBOs as defined by the 2012 NAICS. Merchant wholesale firms are those that take title to the goods they sell. The AWTS also collects data from wholesale agents and brokers, but e-commerce sales are not requested. Therefore, agents and brokers are not included in the wholesale E-Stats estimates. Data are requested annually from about 8,400 wholesale firms that include approximately 6,700 merchant firms and 1,000 MSBOs. For more information about AWTS, see <www.census .gov/programs-surveys/awts/about.html>. The SAS measures the economic activity of employer firms classified in 12 service-related sectors as defined by the 2012 NAICS: • Utilities • Transportation and Warehousing • Information • Finance and Insurance • Real Estate and Rental and Leasing • Professional, Scientific, and Technical Services • Administrative and Support and Waste Management and Remediation Services • Educational Services • Health Care and Social Assistance • Arts, Entertainment, and Recreation • Accommodation and Food Services • Other Services (except Public Administration) Data are requested annually from about 90,000 firms.
- 5. U.S. Census Bureau 5 For more information about SAS, see <www.census .gov/programs-surveys/sas.html>. The ARTS measures the economic activity of employer and nonemployer (i.e., businesses without paid employees) firms classified in Retail Trade as defined by the 2012 NAICS. The sample contains approximately 16,500 firms with paid employees. Data for nonemployers are included in the estimates through imputation or administrative data provided by other federal agencies. For more information about ARTS, see <www.census .gov/programs-surveys/arts.html>. For these three surveys, stratified random samples of firms are selected from a sampling frame constructed using information from the 2012 Economic Census and updated with information from the Census Bureau’s Business Register. The samples are subsequently updated to represent employer firms in business during 2017. All wholesale, service, and retail firms surveyed are asked to report total sales/revenues and e-sales/ e-revenues for 2017. Wholesalers are also asked to report e-sales made through EDI networks. Retailers in the Electronic Shopping and Mail-Order Houses industry are also asked to report total sales and e-sales for 2017 for specific merchandise lines. E-commerce data for nonresponding employer firms and all retail nonemployers were imputed from responding firms within the same kind of business. Estimates of total sales/revenues and e-sales/ e-revenues were calculated by summing data (both reported and imputed) weighted by the reciprocal of the probability of the firm’s inclusion in the appropriate sample. The services, retail, and wholesale estimates in this report have been adjusted using results of the 2012 Economic Census to reduce sampling error and to allow comparability with the census results. Reliability of Estimates The estimates in this report are based on sample surveys and are subject to sampling error and nonsampling error. Sampling error occurs because only a subset of the entire population is measured. Nonsampling error encompasses all other factors that contribute to the total error of a sample survey estimate and may occur in censuses. Disclosure Avoidance The Census Bureau has reviewed the data product for unauthorized disclosure of confidential information and has approved the disclosure avoidance practices applied. ASM Approval ID: CBDRB-FY18-074 Economic Census Approval ID: CBDRB-FY19-537 ARTS Approval ID: CBDRB-FY19-247 AWTS Approval ID: CBDRB-FY19-EWD-B00005 SAS Approval ID: CBDRB-FY18-327 Sampling Error Two measures of sampling error are provided for data in this report—standard errors for estimates of percentages and coefficients of variation for estimates of total dollar value. See tables at <www.census.gov /data/tables/2017/econ/e-stats/2017-e-stats.html>. The standard error measures the extent to which estimates derived from all possible samples of the same size drawn using the same design differ from the average of these estimates. The coefficient of variation (expressed as a percentage) is the standard error of the estimate divided by the estimate. Note that standard errors and coefficients of variation are estimates derived from the sample and are also subject to sampling error. The coefficients of variation and standard errors presented in the tables may be used to compute confidence intervals about the sample estimates. The particular sample used for each survey included in this report is one of a large number of samples of the same size that could have been selected using the same design. For ASM, we estimate sampling variances using the Poisson variance estimator. In about 9 out of 10 (90 percent) of the possible samples, the estimates would differ from the results of a complete enumeration by less than 1.645 times the estimated standard error. For AWTS, ARTS, and SAS, we use the method of random groups (G=16 random groups) to estimate sampling variances for estimates produced from these samples. In about 9 out of 10 (90 percent) of the possible samples, the
- 6. 6 U.S. Census Bureau estimates would differ from the results of a complete enumeration by less than 1.753 (a t-statistic with 15 [G-1] degrees of freedom) times the estimated standard error. To compute a 90 percent confidence interval for an estimated total, multiply the estimate by its coefficient of variation and then by either 1.753 or 1.645, as indicated above. This amount is then added to and subtracted from the estimate to give the upper and lower bounds of the interval. As an example, suppose the estimated total revenue is $51,770 million and the estimated coefficient of variation for this estimate is 1.3 percent (0.013). Multiplying $51,770 million by 0.013 and by 1.753 gives $1,180 million. Subtracting $1,180 million from and adding $1,180 million to $51,770 million gives a 90 percent confidence interval of $50,590 million to $52,950 million. Confidence statements for estimated percentages are computed in a similar manner. The Census Bureau recommends that individuals using estimates in this report incorporate this information into their analyses, as sampling error could affect the conclusions drawn from these estimates. All comparative statements in this report have undergone statistical testing and, unless otherwise noted, comparisons are statistically significant at the 90 percent confidence level. Nonsampling Error One source of nonsampling error is the inability to obtain a response for all cases in the sample. One measure of this type of nonsampling error is response rates. Economic surveys at the Census Bureau are required to compute two different types of response rates: unit and weighted item. Refer to each survey’s Internet page (links provided previously) for the unit response rates of the surveys that contribute to this report. The weighted item response rates are called Total Quantity Response Rates (TQRR) and are item- level indicators of the quality of each estimate. The following table shows the TQRRs for e-commerce activity for the sectors included in this report. More detailed information about calculating and reporting response rates for economic surveys can be found at <www.census.gov/about/policies/quality/standards /appendixd3b.html>. Other sources of nonsampling error include response errors, unclear definitions, differences in the interpretation of questions, mistakes in recording or coding the data obtained, and other errors of collection, response, coverage, and estimation of missing data. Although no direct measures of these sources of nonsampling error have been obtained, precautionary steps were taken in all phases of the collection, processing, and tabulation of the data in an effort to minimize their influence. Total Quantity Response Rate for 2017 Total Shipments/Sales/Revenues and E-Commerce Sector Total sales E-commerce sales Manufacturing . . . . . . . . . N N Wholesale. . . . . . . . . . . . 86.2 60.5 Retail. . . . . . . . . . . . . . . . 91.8 85.9 Services. . . . . . . . . . . . . . 84.7 74.0 N Not available. CONTACTS For additional information regarding surveys included in this report, and for general information about the Census Bureau’s e-business measurement program, contact: Data User and Trade Outreach <emd.outreach@census.gov> 800-242-2184 All E-Stats reports, including prior reports, historical data tables, and past research papers, are available at <www.census.gov/programs-surveys/e-stats.html>.