Sampling Distributions FRQ Review
•Download as PPTX, PDF•
1 like•535 views

This document discusses sampling distributions and simulations. It summarizes the results of two simulations: 1) A simulation of sampling 20 individuals to estimate the mean height of a population. The distribution was centered at 64 inches and reasonably symmetric. 2) A simulation of sampling 5 individuals to estimate the mean number of children in a population. The distribution was roughly symmetric with a single peak at 6, with values mostly between 4 and 8.

Recommended
More Related Content
Similar to Sampling Distributions FRQ Review
Similar to Sampling Distributions FRQ Review (10)
More from Cumberland County Schools
More from Cumberland County Schools (10)
Recently uploaded
Recently uploaded (20)
Sampling Distributions FRQ Review
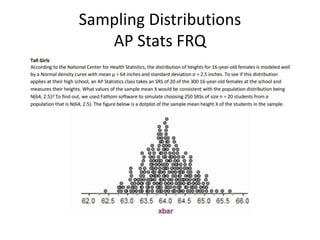
- 3. #1 • (a) This is not the exact sampling distribution because that would require a value of for all possible samples of size 20. However, it is an approximation of the sampling distribution that we created through simulation. • (b) The distribution is centered at 64 and is reasonably symmetric and bell-shaped. Values vary from about 62.4 to 65.7. There do not seem to be any outliers. • (c) If we found that the sample mean was 64.7 inches, we would likely conclude that this population mean height for females at this school could be 64. In our simulation we found values of 64.7 or larger in about 10% of the samples. x
- 5. #2 • (a) No, since the distribution didn’t use all possible samples of size 5, this isn’t the exact sampling distribution. • (b) Shape: The graph is roughly symmetric with a single peak at 6. Center: The mean of the distribution is about 6. Spread: The values fall mostly between 4 and 8, although there are values as low as 2 and as high as 10. Outliers: There don’t seem to be any outliers.
- 14. Bad Carpet