2. ii
Identification of a Carboxysomal γ -Carbonic Anhydrase in the
Mesophilic Cyanobacterium Anabaena sp. PCC7120
Dewan Shamsul Arefeen
Master of Science 2010
Department of Cell and Systems Biology, University of Toronto
Abstract
Analysis of the genome of Anabaena sp. PCC7120 reveals that it lacks the gene,
ccaA, which encodes the bonafide carboxysomal, β-class carbonic anhydrase (CA) CcaA.
However, the carboxysome enriched fraction of Anabaena PCC7120 exhibits CA
activity. Bioinformatic analysis reveals that the N-terminal region of the carboxysome
protein CcmM has high sequence and structural similarity to the γ-class CA of
Methanosarcina thermophila. Recombinantly expressed CcmM is found to be inactive in
in-vitro CA assays. E. coli cell extracts containing an overexpressed form of CcmM
comprised of the N-terminal 209 amino acids (CcmM209) are also inactive. However,
CcmM209 displays CA activity after incubation with the thiol oxidizing agent diamide or
when bound to an affinity matrix. It appears that CcmM is indeed a functional γ-CA
which is active under oxidizing condition. It is hypothesized that the C-terminal RbcS
like domain in CcmM may regulate activity by allowing CcmM activation only when
sequestered within the carboxysome.
3. iii
Acknowledgements
I am greatly thankful to my supervisor, Dr. George Espie, for giving me the
opportunity to pursue my Masters. I would like to thank him for providing me with
proper guidance, support and constructive criticisms throughout my graduate studies. I
particularly respect George for being so understanding and accommodating during
personal emergencies.
I would like to thank my committee members, Dr. Steven Short and Dr. Tim
Westwood, for their criticisms, ideas and advice throughout my thesis.
I wish to extend my gratitude to all the members of Espie lab for being
instrumental in my academic and personal growth. I would especially like to thank Dr.
Yohannes Tadesse for teaching me a multitude of techniques, discipline and patience.
Yohannes has always gone beyond my expectations to help me, regardless of the nature
of the problem. I would like thank Charlotte de Araujo for helping me with the mass
spectrometer. I would like to thank Dr. Anthony So for providing me with recombinant
full length CcmM and many of the protocols that I have used in my research project.
I am grateful to Ian Buglass who made all the administrative details clear and for
his rapid response to any queries. I am thankful to Sarah Gonsalves and Anja Lowrance
for making my teaching assistantship in microbiology labs a pleasurable experience.
I could not have come this far without the loving support of my family members,
Mom, Dad, Ron and Noel. I am thankful to my mother and father-in-law as well as
Mumu and Priya. I am thankful to my wife, Armana, who gave me support and
encouragement to accomplish everything. Finally I would like to thank God for
everything.
4. iv
TABLE OF CONTENTS
Page
ABSTRACT ii
ACKNOWLEDGEMENTS iii
TABLE OF CONTENTS iv
LIST OF ABBREVIATIONS vii
LIST OF TABLES x
LIST OF FIGURES xi
LIST OF APPENDICES xiii
INTRODUCTION 1
Cyanobacteria 1
Importance of CO2 concentrating mechanism (CCM) in cyanobacterial
photosynthesis and growth
2
Components of the CCM 3
Types of carbonic anhydrases 5
Carboxysomal genes 8
Carboxysomal proteins and their known functions 12
Present model of carboxysome function 16
Research objectives 19
MATERIALS AND METHODS 20
Bioinformatics study 20
Organisms and growth conditions 21
Isolation of carboxysomes 22
5. v
Polyacrylamide gel electrophoresis 24
Western blot analysis 24
Recombinant protein expression 25
Mass spectrometric carbonic anhydrase assay 26
CA assay of CcmM 27
Cellulose acetate assay 27
T7 Tag affinity purification and pull down assays 28
Sufonamide column binding assay 29
Protein sequencing 30
CcmM209 and isolation on His.Bind®
affinity column 30
RESULTS 32
In Silico Search for a Carboxysomal Carbonic Anhydrase 32
Mass spectrometric CA assays 45
CA Activity in Synechococcus PCC7942 carboxysomes 48
CA Activity in Anabaena PCC7120 carboxysomes 51
Activity of full length CcmM 54
Attempts to activate CcmM 59
Cellulose acetate assay 63
T7 tag - affinity pull down experiments 63
Sulfonamide pull down assays 66
Analysis of Anabaena PCC7120 CcmM209 69
Results summary 74
75
6. vi
DISCUSSION
Putative carboxysomal carbonic anhydrase in Anabaena PCC7120 75
The most likely candidate 78
Activity of Anabaena PCC7120 carboxysome enriched fraction 79
CcmM Expression and Catalytic activity 81
Identification of putative CA using affinity pull down assays 85
CcmM is an active γ-CA in mesophilic cyanobacteria 86
Proposed model of non-CcaA containing β-carboxysome 87
Conclusion and future directions 91
APPENDIX 100
Calculation of CO2 concentration in mass spectrometer 100
Truncated CcmM209 primers and sequence 101
REFERENCES 92
7. vii
LIST OF ABBREVIATIONS
°C degree(s) Celsius
µ micro (10-6
)
Amp ampicillin
AP alkaline phosphatase
Arg arginine
Asp aspartic acid
BCIP 5-bromo-4-chloro-3-indolylphosphate
CA carbonic anhydrase
cbx carboxysome
CCM carbon dioxide concentrating mechanism
Ci dissolved inorganic carbon
CO2 carbon dioxide
Cys cysteine
dH2O distilled water
DNA deoxyribonucleic acid
DTT dithiothreitol
EDTA ethylenediaminetetraacetic acid
EPPS N-(2-hydroxyethyl)piperazine-N’-(3-propanesulfonic acid)
g gram(s)
Gln glutamine
HCO3
-
bicarbonate ion
HCR high Ci requiring phenotype
HEPES 4-(2-Hydroxyethyl)piperazine-1-ethanesulfonic acid
His histidine
IgG immunoglobulin G
IMAC immobilized metal affinity chromatography
IPTG isopropyl-β-D-thiogalactoside
kbp kilobase pairs
kDa kilodaltons
8. viii
Km Michaelis-Menton constant
L liter(s)
LB Luria-Bertani
LC liquid chromatography
M moles per liter
mg Milligram
Mg2+
magnesium ion
min minute (s)
mL milliliter
mM millimolar
mol mole (s)
MS mass spectrometer
NaOH sodium hydroxide
NBT nitroblue tetrazolium chloride
NCBI National Center for Biotechnology Information
OD optical density
PAMBS p-aminobenzyl sulfonamide
PCC Pasteur Culture Collection
PDB protein data bank
PPFD photosynthetic photon flux density
psi pounds per square inch
RMS root mean square
rpm revolutions per minute
RuBisCO Ribulose-1,5-bisphosphate caboxylase/oxygenase
s second(s)
SDS sodium dodecyl sulfate
SDS-PAGE SDS-polyacrylamide gel electrophoresis
Sec secretory
Tat twin arginine translocation
TBS Tris-buffered saline
Tes N-[tris(hydroxymethyl)methyl]-2-aminoethanesulfonic acid
9. ix
Triton X-100 t-octylphenoxypolyethoxyethanol
Tween-20 polyoxyethylene sorbitan monolaurate
UTCC University of Toronto Culture Collection
V volt(s)
v/v volume by volume
W watt(s)
w/v weight by volume
x g acceleration due to gravity
Zn2+
zinc ion
10. x
LIST OF TABLES
Page
Table 1: List of proteins present in β-carboxysome and α-carboxysome. 15
Table 2: List of query sequences used to search the proteome of Anabaena
PCC7120 to identify a putative carbonic anhydrase.
21
Table 3: Factors changed in attempts to activate CcmM. 62
11. xi
LIST OF FIGURES
Page
Figure 1: Arrangements of β-carboxysomal genes… 11
Figure 2: Structure of a β-carboxysome… 14
Figure 3: The present model of the carboxysome… 18
Figure 4: Representation of the location of conserved β-CA and α-CA domains 40
Figure 5: Representation of the location of conserved γ-CA domains 41
Figure 6: Amino acid sequence alignment output from ClustalX2 for Cam of
Mehanosarcina thermophila and CcmM of selected species of cyanobacteria.
42
Figure 7: 3D structure of Cam of Methanosarcina thermophila and CcmM of
Anabaena PCC7120.
44
Figure 8: (a) Mass spectrometric assay for CA activity of E. coli lysate in which
CcaA expression was induced. (b) 18
O atom fraction in m/z 49 with respect to
time.
47
Figure 9: (a) Mass spectrometric assay for CA activity of Synechococcus
PCC7942 carboxysome extract. (b) Log 18
O atom fraction in m/z 49 with respect
to time.
50
Figure 10: (a) Mass spectrometric CA assay of carboxysome enriched fraction
from Anabaena PCC7120. (b) Log 18
O atom fraction in m/z 49 with respect to
time.
53
Figure 11: Western Blot using CcmM antibody for E. coli lysate overexpressing
CcmM and Anabaena PCC7120 lysate.
56
Figure 12: (a) Mass spectrometric assay for CA activity of E. coli lysate in 57
12. xii
which CcmM expression was induced. (b) Log 18
O atom fraction in m/z 49 with
respect to time.
Figure 13: (a) Mass spectrometric assay for CA activity of E. coli lysate
containing empty pET21 vector. (b) Log 18
O atom fraction in m/z 49 with
respect to time.
58
Figure 14: Western blot using CcmM antibody for varying temperature and
IPTG treatments during CcmM overexpression.
61
Figure 15: Western blot using CcmM antibody to show binding in anti-T7
agarose.
65
Figure 16: Western blot using CcaA antibody to show CcaA binding in
sulfonamide resin.
67
Figure 17: Mass spectrometric analysis of proteins isolated from the
sulfonamide column.
68
Figure 18: (a) Mass spectrometric assay for CA activity of E. coli lysate
containing CcmM209 treated with 20 mM diamide. (b) Log % 18
O in 13
CO2 with
respect to time.
71
Figure 19: (a) Mass spectrometric assay for CA activity of His.Bind resin in
which CcmM209 is bound. (b) Log % 18
O in 13
CO2 with respect to time.
72
Figure 20: (a) Mass spectrometric assay for CA activity of His.Bind resin in
which E. coli lysate containing empty vector is flowed through. (b) Log % 18
O in
13
CO2 with respect to time.
73
Figure 21: Proposed model for the function of β-carboxysomes lacking the
carboxysomal carbonic anhydrase, CcaA.
90
14. 1
Introduction
Cyanobacteria
Cyanobacteria are a group of gram-negative, photoautotrophic bacteria that carry
out oxygenic photosynthesis. They are found in a wide variety of habitats including
freshwater, marine and soil surfaces. The cyanobacteria are responsible for as much as
one third of the global photosynthetic carbon dioxide fixation and hence are significant
contributors to the biogeochemical cycling of carbon and primary productivity on earth.
Beyond fixing carbon dioxide, cyanobacteria play a diverse role in nutrient
cycling in the ecosystem. For example, cyanobacteria are the only group of organisms
that are able to fix nitrogen under aerobic conditions. The enzyme involved in fixing
dinitrogen is nitrogenase and it is irreversibly inactivated in the presence of oxygen
(Gallon, 1992). Some strains of cyanobacteria, including Anabaena sp. PCC7120, have
evolved specialized cells called heterocyst which enable them to carry out nitrogen
fixation in spite of high ambient extracellular O2 concentrations. The ability of
cyanobacteria to fix atmospheric nitrogen makes them an important source of ammonia,
nitrates and nitrites in diverse habitats from the open oceans to the rice paddy fields of
Asia.
Recent studies have shown that Anabaena PCC7120 is able to detoxify
organophosphorous pesticides, used in agriculture, to harmless organic components
(Barton et al., 2004). The ability of this cyanobacterium to detoxify pesticides may play
an important role in the future bioremediation of farmland, given the large-scale and
increasing use of pesticides in modern intensive agriculture. Presently, with the ever-
15. 2
increasing demand for energy and the diminishing fossil fuel, cyanobacteria are also
being looked at as a potential source of biofuels (Hu et al., 2008). The fact that many
cyanobacteria have a high efficiency of photosynthesis, the ability to grow non-
fastidiously and to fix nitrogen makes them very attractive and potentially lucrative
organisms for biofuel generation. To this end, an understanding of the biochemical and
genetic mechanisms that underlie their efficient growth and photosynthesis will be vital
in the metabolic engineering of stains for industrial scale biofuel production (Ragauskas
et al., 2006).
Importance of the CO2 concentrating mechanism (CCM) in cyanobacterial
photosynthesis and growth
Cyanobacteria are extremely primitive organisms dating back 2.7 billion years
(Buick, 1992). Over the course of this time photosynthesis has lowered the level of
atmospheric carbon dioxide while increasing the level of oxygen. Thus, photosynthesis
by cyanobacteria, which requires carbon dioxide, had to adapt to this globally changing
environment. Photosynthetic CO2 fixation is catalyzed by the enzyme, ribulose
bisphosphate carboxylase/oxygenase (RuBisCO; EC 4.1.1.39), and involves the
carboxylation of ribulose-1,5-bisphosphate (RuBP) to produce two molecules of 3-
phosphoglycerate (PGA). The catalytic activity of cyanobacterial RuBisCO is relatively
slow with a turnover number of 3 s-1
(Schneider et al., 1992) and requires high substrate
concentrations for efficient carboxylation (Km(CO2) > 240 µM) (Andrews and Abel,
1981). Not only is RuBisCO slow at atmospheric CO2 concentration but it also has an
oxygenase activity which adds O2 instead of CO2 to RuBP, yielding a molecule of PGA
16. 3
and a molecule of phosphoglycolate (Schneider et al., 1992). Phosphoglycolate is
metabolized in the glycolate pathway and leads to loss of energy and CO2 by
photorespiration. Typically, cyanobacteria live in environments where the O2 / CO2 ratio
is about 25:1. Given the kinetic parameters of cyanobacterial RuBisCO (Km = 240 μM
CO2, Kcat = 3 s-1
and Km = 1000 μM O2), it would be expected to promote oxygenation
over carboxylation (Andrews and Abel, 1981; Jensen and Bahr, 1977; Schneider et al.,
1992). However, under normal environmental conditions, direct physiological
measurements show that photorespiration is almost nonexistent and that photosynthesis
proceeds with remarkable efficiency (Aizawa and Miyachi, 1986)! One widely supported
explanation for this discrepancy is that cyanobacteria have evolved mechanisms to
increase the level of CO2 around RuBisCO by a collective process called the carbon
dioxide concentrating mechanism (CCM) (Badger and Price, 2003), thereby decreasing
the intracellular O2 / CO2 ratio to a level that promotes photosynthesis.
Components of the CCM
The CCM is composed of two primary components, which together can increase
the concentration of CO2 around RuBisCO up to 1000 fold (Badger and Price, 2003;
Miller and Colman, 1980). First, cyanobacteria use membrane-associated active
transporters for bicarbonate, active transporters of carbon dioxide, and bicarbonate/Na+
symporters to create a large internal pool of bicarbonate ions (Badger and Price, 2003).
However, RuBisCO cannot use bicarbonate as a substrate and bicarbonate needs to be
converted to CO2 before use. Conversion of bicarbonate to CO2 is catalyzed by the
enzyme carbonic anhydrase (CA; EC 4.2.1.1). Carbonic anhydrase, along with RuBisCO,
17. 4
in cyanobacteria is localized to polyhedral proteinaceous bodies called the carboxysomes,
the second primary component of the CCM (Mckay et al., 1993; Price et al., 1992).
Carboxysomes were first characterized in the chemoautotrophic bacterium
Halothiobacillus neapolitanus (Shively et al., 1973). Carboxysomes are about 120 nm in
diameter. Cross-sections of the carboxysomes of most species show that they are regular
hexagons surrounded by a 3 to 4 nm thick protein shell (Cannon et al., 2001). Sodium
dodecyl sulfate-polyacrylamide gel electrophoresis (SDS-PAGE) reveals that the shell
proteins comprise of about 17% of the total protein content of the carboxysomes (Cannon
et al., 2001; Cannon and Shively, 1983). No lipid component has ever been found to be
associated with the carboxysome shell or core. The core of the carboxysome is packed
with RuBisCO and the name carboxysome is derived from the carboxylase and
oxygenase activity of RuBisCO (Pierce et al., 1989; Price and Badger, 1989a). Studies
have shown that the packaging of RuBisCO within the carboxysomes enhance the
catalytic properties of the enzymes (Cannon et al., 2001). Carboxysomes are classified
into two phylogenetic groups based on the form of RuBisCO they contain.
Carboxysomes containing Form 1A RuBisCO are classified as α-carboxysomes and
carboxysomes containing Form 1B RuBisCO are called β-carboxysomes (Badger and
Price, 2003; Cannon et al., 2002). It has been suggested that two primary groups of
cyanobacteria can be classified based on their RuBisCO/carboxysome phylogeny.
Cyanobacteria with Form 1A RuBisCO are termed α-cyanobacteria and those with Form
1B RuBisCO are termed β-cyanobacteria (Badger and Price, 2003). Carboxysome
structure and function have been studied in both α and β-carboxysomes. α-carboxysomes
from the chemolithoautotrophic bacterium, Halothiobacillus neapolitanus, have been
18. 5
most widely studied and best characterized (Cannon et al., 2001). β-carboxysome
structure has been studied using the model laboratory cyanobacterial species
Synechocystis sp. PCC6803 and Synechococcus sp. PCC7942 (Badger and Price, 2003).
The presence of carbonic anhydrase in close proximity to RuBisCO in the
carboxysomes allows for high levels of CO2 to be produced around the RuBisCO active
site, thus facilitating carboxylation over oxygenation (Price and Badger, 1989a). The
over-expression of recombinant human CA II in the cytosol of Synechococcus PCC7942
results in the conversion of the bicarbonate pool to carbon dioxide, which then readily
diffuses out of the cell (Price and Badger, 1989a). Thus, a cytosol-localized CA is
deleterious causing a “short circuit” in the CCM. This “short-circuit” prevents
bicarbonate accumulation and the localized formation of CO2 in the vicinity of RuBisCO,
thereby drastically reducing the substrate concentration available for CO2 fixation by
RuBisCO. Under ambient conditions, this situation ultimately leads to a reduction in
photosynthetic efficiency and to a high CO2 requiring phenotype. Mutants with defective
carbonic anhydrase also require high CO2 concentrations in their environment to be
viable. It is apparent that the localization of carbonic anhydrase and RuBisCO within
carboxysomes is vital for efficient photosynthesis in cyanobacteria.
Types of carbonic anhydrases
The importance of carbonic anhydrase in living organisms is implied by the
widespread distribution of this enzyme from mammals to Archaea (Smith and Ferry,
2000). So far, three distinct evolutionary lineages (α, β and γ) of carbonic anhydrases
have been characterized. As well, two additional classes (δ and ε) have been proposed
19. 6
based on the occurrence of unique, non-homologous proteins that display CA activity (So
et al., 2004; So and Espie, 2005). The α-class was initially identified from animals but
examples can be found in plants and eubacteria. α-CAs typically exist as protein
monomers that are mostly composed of antiparallel β-strands (Liljas et al., 1972). This
single protein has all the necessary structural elements to generate a functional, active site
(So and Espie, 2005). The active site of α-CA is located in a 15-Å deep crevice
dominated by hydrophobic amino acid side chains at the base of which is a Zn2+
ion
invariably coordinated by three histidine residues (Liljas et al., 1972).
β-CA’s were initially identified in chloroplast of plants but are now known to be
present in various subcellular compartments of many organisms. Interestingly, β-CAs
have no amino acid sequence similarity with α-CAs, suggesting that they evolved
independently. Unlike α-CA’s, β-CA’s are only functional when oligomerized
(Mitsuhashi et al., 2000; Strop et al., 2001). A homodimer is the catalytic core of a β-CA,
which may exist as a dimer, tetramer or octamer depending on the species of origin
(Mitsuhashi et al., 2000). Dimerization enables formation of the hydrophobic pocket
required for CO2 binding and forms the active site at the interface. Zn2+
co-ordination is
mediated by a combination of His, Cys and Glu residues depending on the species
(Mitsuhashi et al., 2000; Strop et al., 2001). In contrast to α-CAs which is mostly
composed of β-sheets, β-CAs contain a number of α-helices.
The third distinct class of CA is the γ-CA which was first isolated from the
methanogenic archaeon Methanosarcina thermophila (Alber and Ferry, 1994). The γ-CA,
called Cam, from M. thermophila is catalytically active when trimerized (Kisker et al.,
1996). Cross-sectional profiles of the γ-CA trimer reveal that each monomer resembles
20. 7
an equilateral triangle. Cam has an unusual left-handed β-helix structure containing seven
complete turns with an α-helix at the terminal portion forming αβ-helix (Kisker et al.,
1996). The active sites are located at the interfaces between two β-helices. The interface
is stabilized by H bonds, salt bridges and hydrophobic interactions. The side chain of
Arg59 is important since it forms salt bridge with Asp61 of the same monomer and
Asp76 of the adjacent monomer. The trimer contains 3 active sties and each monomer
contributes His residues located on the surface to coordinate Zn2+
(Kisker et al., 1996).
His81 and His122 of one monomer extend from equivalent positions of adjacent turns of
the β-helix along with His117 from a second monomer coordinate the zinc ion (Kisker et
al., 1996). A water molecule is the fourth Zn2+
ligand and is within hydrogen bonding
distance of Gln75. Cam is the only γ-CA which has been shown to have CA activity.
Numerous Cam homologs from both plants and Bacteria have been tested for catalytic
activity, including CcmM from the cyanobacteria Synechocystis PCC6803 and
Synechococcus PCC7942. All were found to lack CA activity, prompting the suggestion
that these homologs have evolved a different function and that Cam is a relic.
A fourth class of CA named δ-class has been isolated from the marine diatom
Thalassiosira weissflogii (Roberts et al., 1997). X-ray absorption spectroscopy of the δ-
CA, T. weissflogii CA1 (TWCA1), has shown that it indeed does contain a Zn2+
ion
bound by histidine residues. Presently, there are only 4 other proteins that display amino
acid sequence similarity to TWCA1 and, thus, its distribution may be restricted to only a
small number of diatom species (So and Espie, 2005).
A fifth class of CA tentatively named ε-class has been characterized from the
chemolithoautotrophic bacterium Halothiobacillus neapolitanus and several marine
21. 8
cyanobacteria (So et al., 2004; So and Espie, 2005). BLAST search results show that this
protein is widely distributed among marine cyanobacterial strains but has no amino acid
sequence similarity to the α, β, γ and δ CAs. Recent X-ray crystal structure studies on the
ε-CA of H. neapolitanus, CsoS3, indicate that it is structurally related to β-CA (Sawaya
et al., 2006) in spite of the absence of any primary sequence similarity. The suggestion
that CsoS3 is a subclass of β-CA comes from the striking structural similarity of the Zn2+
-containing active site and from the fact that both need to form dimers in order to be
active (Sawaya et al., 2006). Thus, CsoS3 is an example of divergent evolution. Proteins
with high degree of amino acid sequence homology to CsoS3 have now been identified in
a range of chemolithoautotrophic bacteria, hydrogen bacteria and many strains of marine
cyanobacteria (So et al., 2004; So and Espie, 2005). In all examples to date, CsoS3 is
encoded within the cso operon which encodes all the components for the α-carboxysome.
Carboxysomal genes
α-carboxysomes are also characterized by the presence of shell proteins encoded
by the cso gene cluster (Badger and Price, 2003; Cannon et al., 2002; So et al., 2004). β-
carboxysomes are encapsulated by proteins encoded by the ccmKLMN gene cluster
(Badger and Price, 2003; Cannon et al., 2002). To date, all cyanobacterial species
characterized possess either α-carboxysome or β-carboxysomes, but not both. It has been
suggested that two primary groups of cyanobacteria can be classified based on their
carboxysome phylogeny. Cyanobacteria with α-carboxysomes are termed α-
cyanobacteria and those with β-carboxysomes are termed β-cyanobacteria (Badger and
Price, 2003).
22. 9
Studies show that the arrangement of carboxysomal genes varies depending on
the type of carboxysomes. The α-carboxysomal genes are arranged into one operon
whereas the β-carboxysomal genes are distributed among multiple operons. The genes of
the putative operon of α-carboxysomes, in their transcriptional order, are cbbL, cbbS,
csoS2, csoS3, csoS4A, csoS4B, csoS1C, csoS1A, csoS1B (Cannon et al., 2003; Shively et
al., 1998). The cbbL and cbbS code for the large and small subunit of RuBisCO form 1A;
the genes csoS2, csoS3, csoS1C, csoS1A and csoS1B code for carboxysomal shell
proteins CsoS2, CsoS3, CsoS1C, CsoS1A and CsoS1B respectively (Cannon et al.,
2003). CsoS3 has been identified as a shell associated active carbonic anhydrase while
CsoS1 is the major structural protein of the shell (So et al., 2004). Purified CsoS1
spontaneously organizes into hexamers that form sheet-like structures. The hexamers are
thought to form the majority of the flat faces of the carboxysome icosahedron. It has
recently been established that the genes csoS4A, csoS4B (previously called orfA and orfB)
code for proteins CsoS4A and CsoS4B that assemble as pentamers (Tanaka et al., 2008).
The construction of large icosahedral structure typically requires a combination of
hexameric and pentameric proteins. It is conjectured that the pentamers provide the
curvature required at the vertices to form the icosahedron while the hexamers form the
flat faces of the icosahedron. It has been postulated that CsoS4A and CsoS4B form the
vertices of the carboxysome shell (Tanaka et al., 2008).
The β-carboxysomal genes are found scattered throughout the genome in 3 or 4
different clusters as shown by the gene diagram in Figure 1. Typically, these clusters
include ccmK2K1LMN and ccmK3K4 that contribute the structural components of the
carboxysome. The RbcLXS operon encodes the large and small subunits of RuBisCO
23. 10
(Cannon et al., 2001) and RbcX required for RuBisCO assembly (Saschenbrecker et al.,
2007). Depending on the species, the genes ccmO and ccaA may or may not be present
and even if they are present then they are found at separate loci than the ccmKLMN and
rbcL, rbcS gene cluster. The gene cluster ccmK, ccmL, ccmM and ccmN codes for the
polypeptides CcmK, CcmL, CcmM and CcmN respectively. The gene ccmO codes for
the polypeptide CcmO and the gene ccaA codes for the carboxysomal carbonic
anhydrase, CcaA, of β-carboxysomes. Anabaena PCC7120 possesses β-carboxysomes
and the proteins involved in β-carboxysomes will be the focus in the following pages.
24. 11
Anabaena sp. PCC7120
Synechocystis sp. PCC6803
Gloeobacter violaceus PCC7421
Synechococcus sp. PCC7942
= 1 kb
rbcccmccm
LM K1N K2O
997kb
XL
1786 kb
K3K4
361kb
ccaA?
all0863
all0866
all0867
all0868
all0318
all0865
all0864
all0317
alr1524
alr1525
alr1526
S
slr0436
OXL
219 kb
AK4K3LMN K2K1
2478 kb1742 kb956 kb 2551 kb
slr1347
S
slr0009
slr0010
slr0012
sll1028
sll1029
slr1838
slr1839
sll1032
sll1031
sll1030
ccm ccm ccmcca rbc
L S A X
1595 kb
rbcccm
NM OLK
1475 kb281 kb
KK
ccm
1500 kb
synpcc7942_0284
synpcc7942_0285
synpcc7942_1425
synpcc7942_1421
synpcc7942_1422
synpcc7942_1423
synpcc7942_1424
synpcc7942_1447
synpcc7942_1426
synpcc7942_1427
synpcc7942_1535
rbccca
rbcccm
LM K1N K2O
2249 kb
XL S
2307 kb
ccaA?
gll2093
gll2094
gll2091
gll2092
gll2095
gll2096
glr2156
glr2157
glr2158
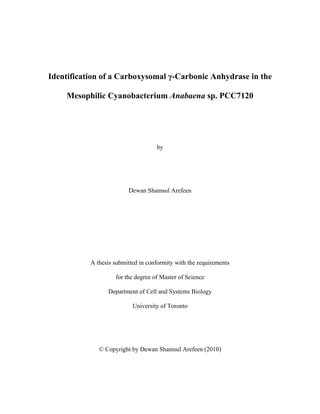
Figure 1: Arrangements of β-carboxysomal genes from Anabaena sp. PCC7120, Synechocystis sp. PCC6803, Synechococcus sp.
PCC7942 and Gleobacter violaceus PCC7421. The ccm genes are depicted by red boxes, the Form 1B RuBisCO genes are depicted by
the green boxes and carboxysomal carbonic anhydrase genes are depicted by blue boxes. Putative, uncharacterized carboxysomal
carbonic anhydrase is denoted by the yellow boxes. The cyanobase ID for the corresponding gene is denoted below each box.
25. 12
Carboxysomal proteins and their known functions
RuBisCO
Studies show that the CO2 fixing enzyme RuBisCO is mainly localized to the
carboxysomes regardless of the amount of dissolved inorganic carbon or the stage of
growth at which the cells are harvested (Mckay et al., 1993). The Form 1B RuBisCO is
present as a hexadecameric enzyme composed of eight large and small subunits of
RuBisCO encoded by rbcL and rbcS genes. It has been seen that the expression of a
simple dimeric form of RuBisCO from Rhodospirillum rubrum in Synechocystis
PCC6803 results in the loss of carboxysomes and produces high Ci requiring (HCR)
phenotype (Pierce et al., 1989; Price and Badger, 1989a). Mutants lacking structurally
intact carboxysomes require high CO2 to survive. This suggests that the localization of
RuBisCO and other carboxysomal proteins in the carboxysomes is essential for normal
growth.
CcaA
Many β-carboxysomes possess a carboxysomal carbonic anhydrase, CcaA. Amino
acid sequence characterization has shown that CcaA is a β-type CA. Biochemical
analysis has shown that up to 97% of the immunologically reactive CA polypeptide is
associated with the carboxysomes (So and Espie, 1998). Electron microscopy and
immunogold labeling of RuBisCO in Synechocystis PCC6803 mutant lacking CcaA
reveal that the carboxysome number, size and shape are similar to wild type cells
indicating that CcaA is not essential for maintaining carboxysomal structure or the
26. 13
deposition of RuBisCO within the carboxysomes (So et al., 2002). However, the mutants
of Synechocystis PCC6803 that lack CcaA require high CO2 (5% v/v) to survive,
indicating that CcaA is vital for normal functioning of the cell (So et al., 2002). Protein-
protein interaction studies and protein capture studies have recently shown that CcaA is
localized to the carboxysome shell in complex with CcmM and CcmN, where it likely
serves to catalyze HCO3
-
dehydration in the vicinity of the CO2 fixing enzyme RuBisCO
facilitating efficient CO2 fixation and normal growth (Cot et al., 2008).
CcmK, CcmL and CcmO
CcmK, CcmL and CcmO all play a structural role in carboxysomes as mutants of
CcmK, CcmL or CcmO produce malformed carboxysomes and result in a HCR
phenotype (Cannon et al., 2002; Price et al., 1993). CcmK and CcmL appear to be present
in all β-carboxysomes so far identified while CcmO may or may not be present. CcmK
and CcmO have high amino acid sequence similarity to CsoS1 of α-carboxysomes while
CcmL has high amino acid sequence similarity to CsoS4A and CsoS4B polypeptides
present in α-carboxysomes (Table 1) (Cannon et al., 2002). Four variants (paralogs) of
CcmK (CcmK1-K4) are found in Anabaena PCC7120 as well as other species such as
Synechocystis PCC6803. The X-ray crystal structure of CcmK2 and CcmK4 from
Synechocystis PCC6803 has been elucidated. The crystal structure reveals that the CcmK
family of proteins forms hexamer plates with a central pore and, therefore, most likely
forms the flat facets of the polyhedral carboxysomal body (Kerfeld et al., 2005). The
central pore in the CcmK hexamers consists of positively charged amino acid residues
and this may serve a functional role in the carboxysome such as maintaining the
27. 14
metabolite flux between the carboxysomes and the cytosol (Kerfeld et al., 2005).
Analysis of the crystal structure of CcmL has shown that CcmL forms pentamers (Tanaka
et al., 2008). Hypothetically, these pentameric proteins could reside at the vertices of
icosohedral carboxysomes, joining the 20 planar triangular faces that form the surface of
the carboxysome (Figure 2) (Tanaka et al., 2008). The deletion of the ccmL gene results
in the formation of elongated carboxysomes which further supports the function of CcmL
as a structural protein (Price et al., 1993; Tanaka et al., 2008).
Pentamers
at vertices
(CcmL)
Hexamers
on flat faces
(CcmK)
Figure 2: A proposed structure of a β-carboxysome showing the localization of
pentameric protein, CcmL, and hexameric protein, CcmK forming the carboxysome shell.
(Adapted from Tanaka et al., 2008)
28. 15
Table 1: Protein components of β-carboxysomes and α-carboxysomes.
β-carboxysome proteins
α-carboxysome proteins
with β-carboxysome
homologs
α-carboxysome proteins
unique to α-cyanobacteria
CcmK1
CcmK2
CcmK3
CcmK4
CsoS1A
CsoS1B
CsoS1C
CcmL CsoS4A, CsoS4B
CcmM None CsoS2
CcmN None
CcmO
CcaA (variable) (deeply divergent) CsoS3
RbcL Form IB RbcL Form IA
RbcS RbcS
RbcX (Rbc assembly) None
29. 16
CcmM and CcmN
CcmM and CcmN are unique to β-carboxysomes as are CsoS2 and CsoS3 to α-
carboxysomes (Table 1). The CcmM and CcmN proteins share considerable amino acid
sequence similarity among species. The definitive function of CcmM and CcmN has not
been determined, but mutants of CcmM and CcmN have HCR phenotype which shows
that they are essential for normal carbon assimilation (Ludwig et al., 2000; Price et al.,
1993). Mutation in CcmM yields cells that require high CO2 for growth. These cells are
able to concentrate Ci internally but are unable to effectively utilize the Ci pool in CO2
fixation (Ludwig et al., 2000). Ultrastructural examination shows the mutants lacked
carboxysomes (Ludwig et al., 2000). Yeast two-hybrid analysis and in-vitro pull down
experiments show that CcmM N-terminal region can interact and form a complex with
both CcmN and CcaA (Cot et al., 2008). Both the C-terminal and N-terminal region of
CcmM interact with CcmK and CcmL (Cot et al., 2008). The aforementioned evidence
leads to the conclusion that CcmM has a key structural organizational role in the
formation of carboxysomes and the bicarbonate dehydration complex.
Present model of carboxysome function
Research indicates that both α and β carboxysomes contain RuBisCO packed
within the core and surrounded by a protein shell. Current models of carboxysome
function suggest that HCO3
-
and RuBP diffuse from the cytosol to the carboxysome core,
possibily via the pores in CcmK hexamers, where HCO3
-
is dehydrated to CO2. RuBP
binds to RuBisCO and is subsequently carboxylated using the recently formed CO2 as a
substrate. In α-carboxysome, HCO3
-
dehydration is catalyzed by CsoS3. In some β-
30. 17
cyanobacteria CcaA catalyzes dehydration of HCO3
-
. In these strains (Figure 3), it is
thought that cytosolic bicarbonate binds to CcmM and is vectorially channelled to CcaA
which lies on the interior region of the carboxysome shell, resulting in the dehydration of
the bicarbonate within the carboxysome interior (Cot et al., 2008). The localized
generation of a high concentration of CO2 near the active site of RuBisCO promotes CO2
fixation and reduces RuBP oxidation by outcompeting O2 for binding sites. Mutants
lacking CcaA or CcmM require high CO2 to survive (Ludwig et al., 2000; So et al.,
2002). Therefore, the presence of CcmM and CcaA is vital for the dehydration of
bicarbonate and to the overall efficiency of the CCM in promoting photosynthetic
fixation of CO2. However, recent findings suggest that this model for bicarbonate
dehydration may not be applicable to all β-cyanobacteria as genome analysis has revealed
that a number of β-cyanobacteria appear to lack a CcaA homolog (So and Espie, 2005)!
31. 18
HCO3
-
Rbc
1B
Rbc
1B
Rbc
1B
AA
M M KL N Ncarboxysome
shell
cytosol
carboxysome
interior
CO2
RuBPRuBP
Key
L= CcmL
N=CcmN
M=CcmM
K=CcmK
A=CcaA
Rbc=Rubisco
Figure 3: The present model of the carboxysome shows that CcmM as the central organizing protein that binds to other
carbosysomal shell protein and channels bicarbonate to the CcaA. The CcaA dehydrates the bicarbonate to CO2. The localized
generation of a high concentration of CO2 near the active site of RuBisCO promotes CO2 fixation and reduces RuBP oxidation
by outcompeting O2 for binding sites. (Adapted from Cot et al., 2008)
CO2CO2
32. 19
Research objectives
Amino acid sequence similarity searches of the deduced proteome of the β-
cyanobacterium Anabaena PCC7120 and a number of other strains have failed to identify
homologs of CcaA. Based on this observation, it can be hypothesized that Anabaena
PCC7120 does not require CA activity to form a functional carboxysome. Alternatively,
Anabaena PCC7120 carboxysomes may contain a CA protein with a novel amino acid
sequence that is not identifiable by homology searches. A third possibility is that an
existing previously identified protein may substitute the function of CA. My initial goal is
to perform a bioinformatics analysis of the proteome to assess the presence or absence of
a bicarbonate dehydration complex in Anabaena PCC7120 and to search for a potential /
alternate candidate for CcaA in Anabaena PCC7120. The main experimental objectives
of my thesis is to determine if carboxysomes of Anabaena PCC7120 possess CA activity
and, if so, explore the CA activity of potential candidate protein(s) identified using
bioinformatic analysis and determine if the activity is due to a previously identified
protein or a novel protein.
33. Materials and methods
Bioinformatics study
An in silico search of the deduced proteome of Anabaena PCC7120 was
conducted to identify potential carboxysomal carbonic anhydrases candidates using the
databases at NCBI and Cyanobase. Protein basic local alignment search tool (BLASTP
http://blast.ncbi.nlm.nih.gov/Blast.cgi) was used to search the proteome of Anabaena
PCC7120 using amino acid query sequences from bonafide carbonic anhydrases of
different classes (Table 2). The amino acid sequences in the proteome of Anabaena
PCC7120 which had the highest similarity to the query sequences were analyzed using
the web based algorithm SignalP 3.0 ( http://www.cbs.dtu.dk/services/SignalP/) using a
gram negative bacterial model for signal peptides and peptide cleavage sites. The
identified sequences were also analyzed using default parameters using the TatP 1.0
algorithm (http://www.cbs.dtu.dk/services/TatP/) for a specific twin arginine signal
sequence with RRNFL motif. Sequence alignments were done using ClustalX2
(http://www.clustal.org/) using default parameters. Predicted 3D structural model of
CcmM was created using the online protein modeling algorithm in Phyre
(http://www.sbg.bio.ic.ac.uk/phyre/) using default parameters. Superpose
(http://wishart.biology.ualberta.ca/SuperPose/) was used to superimpose the predicted
structure of CcmM on Cam. The superimposed structures were viewed in Swiss-Pdb
Viewer (http://spdbv.vital-it.ch/). The RMS values considering the spatial differences in
the α-carbons and all the backbone atoms of the amino acids for the superimposed
structures were calculated using iterative magic fit function in Swiss-Pdb Viewer.
20
34. 21
Table 2: List of query sequences used to search the proteome of Anabaena PCC7120 to
identify a putative carbonic anhydrase.
Query sequence accession number in:Class of carbonic
anhydrase
Query sequence
species Cyanobase NCBI
β-class Synechocystis
PCC6803
slr1347 AAC46375
Halothibacillus
neapolitanus
EEG96215ε-class
Prochlorococcus
marinus MED4
NP_892671
α-class Human AAH27890
γ-class Methanosarcina
thermophila
1THJ-A
Organisms and growth conditions
The filamentous cyanobacterium Anabaena sp. UTCC387 was obtained from the
University of Toronto Culture Collection, Toronto, Canada. The culture record indicates
that this strain was deposited as Anabaena sp. PCC7120 from the Pasteur Culture
Collection, Paris, France. Thus, the strain UTCC387 and PCC7120 are equivalent.
Cultures of Anabaena PCC7120 were grown in BG11 medium at 30ºC (Rippka, 1979).
Small scale cell cultures were grown in 100 mL of unbuffered BG11 medium in 250 mL
Erlenmeyer flasks with constant shaking at 120 rpm. The cultures were continuously
illuminated using Cool White and Gro-lux fluorescent lamps with an average
35. 22
photosynthetic photon flux density (PPFD) of 25 umol m-2
s-1
. Large scale cultures were
grown in 10 L carboys (Nalgene) using 6 L of BG11 buffered with 25 mM HEPES at pH
8. Typically, these cultures were grown using 5% CO2 (v/v) as the carbon source to
enhance growth rate and biomass. The gas stream was then changed to normal air
(0.035% CO2 [v/v]) 72 h prior to experiments, in order to enhance additional
carboxysome biosynthesis (Mckay et al., 1993).
Cultures of the heterotrophic bacterium Escherichia coli strain BL21 (Novagen)
were maintained in Luria-Bertani (LB) media (1% [w/v] tryptone, 0.5% [w/v] Bacto
yeast extract and 171 mM NaCl) containing 1.4% w/v agar. Transformed E. coli BL21
strains containing pET protein expression vectors were grown in LB media supplemented
with 100 μg mL-1
ampicillin. Liquid cultures were grown in 250 mL of LB media in 1 L
Belco flasks with shaking at 250 rpm at 37°C for 12 h.
Isolation of carboxysomes
Prior to experiments, illuminated Anabaena PCC7120 cells were grown with 5%
CO2 for 8 days followed by 3 additional days with air bubbling. Cells were collected by
centrifugation at 5000 x g for 10 min in 250 mL centrifugation flasks (Nalgene) at room
temperature. Cell pellets were pooled by resuspension in a small amount of retained
media, the bottles were washed with 5 mL of lysozyme buffer (0.6 M sucrose and 20 mM
Tes-NaOH at pH 7.5) and the combined solution was again centrifuged at 5000 x g for 10
min at room temperature. The cell pellet was then resuspended in 40 mL of lysozyme
buffer containing 2 mg mL-1
of egg white lysozyme and incubated at 37°C for 2 h in dark
with occasional mixing. Following lysozyme treatment, the cell suspension was
36. 23
centrifuged at 5000 x g for 10 min at room temperature and the supernatant was
discarded. The precipitated cells were resuspended in 4 mL of lysozyme buffer plus 21
mL of “breaking” buffer (20 mM Tes-NaOH and 5 mM EDTA at pH 7.0) and 1/100 (v/v)
dilution of a protease inhibitor cocktail (Sigma). The resuspended cells were kept on ice
for 5 min. To disrupt the cells, the cell suspension was passed through an ice-cold French
Pressure Cell (Aminco) at 8,000 psi. The lysate was collected, centrifuged at 12,000 x g
for 10 minutes at 4°C and the supernatant containing the soluble fraction was retained.
To obtain a carboxysome-enriched fraction from the soluble portion of the crude
extract, the soluble fraction was diluted with 3 volumes of 1X EM buffer (40 mM EPPS-
NaOH and 27 mM MgSO4 at pH 8.0) containing 20% (v/v) Percoll (Amersham
Biosciences) and 0.133% Triton X-100. The mixture was allowed to incubate on ice for
30 min to allow for magnesium mediated aggregation of the carboxysome with the
Percoll beads. The aggregated carboxysomes were collected by centrifugation at 12,000 x
g for 20 min at 4°C. The carboxysomal aggregates were washed twice with 15 mL 0.75X
EM buffer containing 1% Triton X-100 and centrifuged at 12,000 x g for 20 min at 4°C
to remove thylakoid membranes. A final wash with 15 mL of 0.75X EM buffer was
carried out before resuspending the precipitate in 1 mL of 0.75X EM buffer containing
20% glycerol. The partially purified carboxysomes were separated in 100 μL aliquot in
microfuge tubes. The carboxysome isolation protocol is based on that developed by So et
al and Long et al (Long et al., 2007; So et al., 2002).
37. 24
Polyacrylamide gel electrophoresis
Proteins from lysates or carboxysome preparations were separated according to
size by sodium dodecyl sulfate polyacrylamide gel electrophoresis (SDS-PAGE) using
Bio-Rad Mini-PROTEAN II electrophoresis system. Polyacrylamide gels (8%, 10% or
12% [w/v]) were prepared as described by Ausuble et al. (1993). Electrophoresis was
performed at 75 V for 10 min followed by 150 V for 60-100 min. Following
electrophoresis, the gels were either stained for protein or the separated protein was
transferred to nitrocellulose membranes for immunoblot analysis. Staining was carried
out by immersing the gels in Coomassie Brilliant Blue R-250 (Bio-Rad), 50% (v/v)
methanol and 10% (v/v) acetic acid for 1-2 hours. Gels were destained using 50% (v/v)
methanol, 10% (v/v) acetic acid for 2-4 hours and dried in cellophane membranes to
preserve them.
Western blot analysis
Polyacrylamide gels from SDS-PAGE were washed with transfer buffer (25 mM
Tris-HCl pH 8.3, 190 mM glycine and 20% [v/v] methanol) to remove residual SDS-
PAGE buffer. Proteins were transferred onto BioTrace NT pure nitrocellulose
membranes (Pall Gelman) using the Mini Trans-Blot system (Bio-Rad) at a constant
voltage of 100 V for 2 h. The apparatus was cooled using ice packs. Following transfer,
nictrocellulose membranes were incubated overnight in a blocking solution of TBST (20
mM Tris-HCl pH 7.6, 140 mM NaCl, 0.1% [v/v] Tween-20 [Bio-Rad]) and 5% (w/v)
skim milk powder (Carnation). The blot was subsequently incubated with primary
antibody in TBST and 2% (w/v) gelatin (Bio-Rad) for 1 h at room temperature followed
38. 25
by three washes of five min each with TBST. The antibody was used at a dilution of
1:2000 – 1:3000 depending on the antibody. For detection of the primary antibody, which
was generated in rabbits, the blot was treated with goat anti-rabbit IgG conjugated to
alkaline phosphatase (AP). The secondary antibody was diluted to 1:2000 in TBST
containing 2% (w/v) gelatin (Bio-Rad) and incubated for 45 min at room temperature.
Following incubation with the secondary antibody, the blots were washed three times
with TBST and treated with AP visualization substrates (40 μL BCIP and 40 μL NBT
[Amersham Biosciences]) diluted in 10 mL of AP buffer. The AP visualization substrate
and blot were allowed to incubate until formation of purple precipitate after which the
blot was washed with distilled water to stop further development. The blot was dried and
digitized using a scanner.
Recombinant protein expression
E. coli cells containing recombinant, full length CcmM were generously provided
by Dr. A K C So.
The activity of CcmM was investigated using recombinant CcmM expression in
E. coli cells (Novagen BL-21). Initially, small scale protein extracts were prepared to
confirm the overexpression of CcmM. A single colony from a plate culture was used to
inoculate 5 mL of LB media containing 100 µg mL-1
ampicillin at 37°C with shaking at
250 rpm for 5 h. After 5 h, the cells were induced with 1 mM isopropyl-β-D-
thiogalactoside (IPTG) at 30°C for 4 hours. After induction, the cells were centrifuged at
8,000 x g for 1 min at 4°C and the pellet collected. The cell pellet was then sonicated 5
times with 5 s pulses at 10 W on ice. The sonicated cells were then centrifuged at 10,000
39. 26
x g and the supernatant was collected. Samples of the supernatant were used to check for
the presence of CcmM using PAGE followed by Western Blotting with CcmM antibody.
Once the presence of CcmM was confirmed, large-scale cultures of transformed
E. coli were grown. Overnight stock cultures of transformed E. coli were grown in 4
tubes containing 20 mL of LB/amp media at 37°C with shaking (250 rpm) for 14 h. The
overnight cultures were used to inoculate 4 flasks containing 250 mL of LB/amp at 37°C
with shaking (150 rpm) for 3-4 h until an OD600 reading of 0.8. Protein overexpression in
the cultures was induced with 1 mM IPTG and the cells were allowed to grow for another
5 hours. After induction, the cultures were centrifuged at 5,000 rpm for 10 min at 4°C to
collect the cells. The ice-cold cell pellets were subjected to 4 rounds of sonication at 5 W
for 10 s each. The lysed cells were centrifuged and the supernatant was collected.
Mass spectrometric carbonic anhydrase assay
CA activity was measured using mass spectrometric assay by following the
irreversible exchange of 18
O from 13
C18
O2 to H2O (Miller et al., 1997). The 18
O enriched
carbonate-bicarbonate mixture was prepared by mixing 20 mg K2
13
C16
O3 (95%) with
0.936 mL of H2
18
O (99%). CA catalyses the following partial reaction:
13
C18
O2 + H2
16
O ↔ H+
+ H13
C16
O18
O18
O ↔ 13
C16
O18
O + H2
18
O
Repeated cycles of hydration/dehydration cause the irreversible loss of 18
O from
13
C18
O2 and result in the formation of 13
C16
O2 with an m/z of 45. Hence, CA activity can
be assayed by measuring the rate of formation of mass 45 13
C16
O2 following the supply of
13
C18
O2 (m/z = 49). The measurement of the formation of m/z 45 13
C16
O2 from m/z 49
40. 27
13
C18
O2 was carried out using an aqueous inlet, magnetic sector mass spectrometer
(model MM 14-80SC; VG Gas Analysis) (So et al., 2002).
CA assay of CcmM
Recombinantly expressed CcmM was assayed for CA activity. E. coli cells
overexpressing CcmM were grown at temperatures ranging from 16°C to 37°C using 1
mM or 2 mM of the inducer IPTG. CcmM overexpressed at different temperature and
inducer concentration was assayed for CA activity. Zinc (0.05 - 2 mM), dithiothreitol
(0.05, 0.1 and 2 mM), bicarbonate (0.6 mM and 20 mM) and RuBisCO (1 mg) was added
to the assay buffer in independent CA assay to see if CcmM was activated by the
aforementioned small molecules. pH of the assay buffer was changed from 7.2 to 8.5 to
see if CcmM was activated by changes in pH. The CcmM lysate was concentrated 10X to
ensure that enough protein was being assayed to exhibit CA activity. Oxygen was
bubbled for 15 min to see if an oxidative environment activates CcmM. A combination of
1 mM zinc, 0.1 mM DTT and 20 mM bicarbonate at pH 8 was assayed to see if a
combination of external factors activates CcmM (Table 3).
Cellulose acetate assay
In 1.0 L of running buffer (15.74 g TRIS, 0.82 g EDTA, 0.24 g NaCl and 4.41 g
boric acid in 1.0 L of ddH2O adjusted to pH 8.9 with NaOH) Titan III Zip Zone cellulose
acetate plates (Helena Laboratories, Mississauga) (76 X 76 mm) were soaked in ice-cold
running buffer for 1 h. Using Whatman No. 1 chromatography paper, the plates were
blotted dry. The cell extract was loaded onto the cellulose acetate plates quickly to
41. 28
prevent the plate from drying using a twelve-lane Super Z applicator at a point
approximately 1 cm away from the plate edge. For positive control bovine CA (Sigma C-
4831) was used. The plate was plated upside down as a bridge between two
chromatography paper wicks (63 mm apart), dipped in isolated chambers containing the
running buffer. Electrophoresis was performed at 200 V (about 5 mA per plate) for 40 to
60 min at 4°C. The electrophoresed plates were soaked in 20 mM Na-barbital buffer (pH
8.30) containing 0.1% (w/v) phenol red dye for 1 min.
The cellulose acetate membrane was then placed face up on an ice-cooled
aluminum plate and blotted to remove excess buffer from the cellulose acetate
membrane.
Using an inverted funnel, CO2 was blown on top of the cellulose acetate membrane.
Positive CA activity appeared as yellow bands on a red background within 1-2 minutes.
To increase the sensitivity, the plate was rinsed in running dH20 for about 15 s followed
by the re-addition of phenol barbital buffer and CO2 treatment. The plate was meant to be
photographed using a digital camera at the point of maximum contrast or when minor
bands appear just before the background becomes yellow. However, the plate could not
be photographed due to inadequate camera setup.
T7 Tag affinity purification and pull down assays
T7 Tag Antibody Agarose purification kit (Novagen 69025-3) was used in the
pull down assays. The column was mounted on an appropriate support and then primed
with several ml of Bind/Wash Buffer to eliminate air from the bottom frit area. The T7-
Tag Antibody Agarose was left to equilibrate to room temperature. The 50% slurry of
42. 29
T7-Tag Antibody Agarose was resuspended and 1 ml was transferred into the
chromatography column. The storage buffer was allowed to flow to waste. The resin was
equilibrated by washing with ten column volumes (10 mL) of 1X T7•Tag Bind/Wash
Buffer at room temperature. The cell extract was brought to room temperature and loaded
onto the column and incubated overnight at 4°C on orbital rotator. The flow through was
collected in a 15 mL tube. The column was then washed with ten column volumes (10
mL) of 1X T7•Tag Bind/Wash Buffer. The flow through was saved for Western Blot
analysis. Then, the Anabaena PCC7120 lysate was added and incubated overnight at 4°C
on orbital rotator. The column was then washed with ten column volumes (10 mL) of 1X
T7•Tag Bind/Wash Buffer. The flow through was saved for activity and Western Blot
analysis. The resin which had been incubated with CcmM and Anabaena PCC7120
extract was resuspended in EPPS-NaOH pH 8 and checked for activity.
Sulfonamide column binding assay
Carboxysome preparations from previous extractions were pooled. A total volume
of 1 mL of carboxysome extract was diluted with 2 mL of binding buffer (100 mM
EPPS/NaOH, pH 8 +100 mM MgSO4). 0.5 mL of p-aminobenzyl sulfonamide (PAMBS)
agarose was prepared for binding by washing 3 times with 1 mL of binding buffer. The
washed PAMBS was placed into a Bio Rad Poly-Prep chromatography column and
washed further with 2 mL of binding buffer until nearly dry. Then 3 mL of the
carboxysome sample was added to the column and incubated for 1 hour on an orbital
rotator. After incubation, the buffer was allowed to flow out of the column and drops 50
to 60 were collected as the first flow through. Then 6 mL of binding buffer was added
43. 30
and drops 50 to 60 collected as second flow through. This was repeated until fourth flow
through was collected. After the fourth flow through 50 μL of PAMBS resin was saved
for analysis. As a positive control to see if PAMBS resin binds to bonafide carboxysomal
CA, CcaA, the above mentioned procedure was carried out and the resin analyzed using
Western blot.
Protein sequencing
The bound protein in the sulfonamide affinity column from Anabaena PCC7120
carboxysomal extract was removed by boiling in 10 mM Tris-HCL buffer for 5 min. The
protein that was bound was extracted and sent to the Advance Protein Technology Center
at Sick Kids Hospital for processing and sequencing using Liquid Chromatography
MS/MS. The protein sequence was analyzed using Scaffold 2 software.
CcmM209 and isolation on His.Bind®
affinity column
A segment of the ccmM gene encoding the N-terminal 209 amino acids was
cloned into the pET28A expression vector using PCR based methods by Dr. Y Tadesse in
our lab. This region encompasses the entire γ-CA domain of CcmM as predicted by the
homology model. The primers used for PCR amplification and the DNA sequence of the
insert used to express CcmM209 are in the Appendix.
E. coli cells expressing recombinant 6XHis tagged CcmM209 were grown using
the same protocol as described previously. Cells from 750 mL of culture were centrifuged
and the pellet lysed using BugBuster®
reagent from Novagen following the protocol
provided with the kit. Cellular debris was removed by centrifuging at 16,000 x g for 20
44. 31
min and the supernatant was collected. Binding of 6XHis-tagged protein was
accomplished by passing the supernatant through a His-bind immobilized metal affinity
chromatography (IMAC) column at a rate of 6 times the bed volume (1.5 mL) per hour.
400 uL of washed resin was retained for further analysis. Bound protein was eluted from
the remaining resin using the previously described method.
45. 32
Results
In Silico Search for a Carboxysomal Carbonic Anhydrase.
To identify potential carboxysomal carbonic anhydrase candidates within the
proteome of the cyanobacterium Anabaena PCC7120, in silico searches of the NCBI
database (http://www.ncbi.nlm.nih.gov/) and Cyanobase
(http://genome.kazusa.or.jp/cyanobase/) were performed using reference sequences
(NC_003272). The initial search query was a 274 amino acid protein (AAC46375,
slr1347) from the cyanobacterium Synechocystis PCC6803 which is a bonafide
carboxysomal carbonic anhydrase belonging to the β-class of CAs (Cot et al., 2008; So et
al., 2002; So and Espie, 1998; So and Espie, 2005). The BLASTP search identified a
single, high-probability ortholog within the Anabaena PCC7120 proteome having NCBI
accession number NP_486950 and cyanobase ID all2910. The ortholog had 29.9%
sequence identity to the bonafide β-CA, slr1347, of Synechocystis PCC6803. Reciprocal
BLASTP analysis also revealed that all2910 had greater than 40% amino acid sequence
similarity to an additional β-CA within the Synechocystis proteome, namely slr0051, a
putative periplasmic protein. Proteins from Synechocystis, the carboxysomal carbonic
anhydrase (CcaA) slr1347 and the periplasmic CA slr0051, along with all2910 contained
the β-CA superfamily conserved domain motif (Fig. 4). This included amino acid
residues involved in the formation of the zinc binding sites, dimer interfaces and active
site clefts, all of which were highly conserved in both all2910 and CcaA. However, the β-
CA superfamily conserved domain in all2910 and slr0051 was positioned towards the C-
terminal end of the protein whereas the conserved domain in CcaA was positioned
towards the N-terminal region of the protein (Fig. 4). Analysis of the amino acid
32
46. 33
sequence of all2910 using the web-based algorithm SignalP 3.0
(http://www.cbs.dtu.dk/services/SignalP/) within a gram negative bacterial model
revealed that the first 30 N-terminal amino acids of all2910 is a signal peptide with a
probability prediction of 1.0. A signal peptidase cleavage site was also predicted between
amino acid positions 30 and 31. Analysis of the same amino acid sequence using the TatP
1.0 algorithm (http://www.cbs.dtu.dk/services/TatP/) revealed that the amino acid
sequence of all2910 contained a specific twin arginine signal sequence with an RRNFL
motif starting at amino acid position 10. Unlike all2910, analysis of CcaA using the
SignalP 3.0 server and TatP 1.0 server showed that it did not possess a generic signal
peptide or a specific twin arginine signal sequence.
A second bonafide carboxysomal carbonic anhydrase is encoded by csoS3 (So et
al 2004, So & Espie, 2005) found within the cso operon of α-cyanobacteria and a variety
of chemolithoautotrophic bacteria (Badger et al., 2002). Consequently, BLASTP
searches of the Anabaena PCC7120 proteome using the ε-type CA, CsoS3, from
Halothiobacillus neapolitanus (EEG96215) and Prochlorococcus marinus MED4
(NP_892671) as the query sequences. The searches did not identify proteins with
significant amino acid sequence similarity. This was not unexpected as Anabaena
PCC7120 does not contain α-carboxysomes or the cso operon. However, the search was
necessary to exclude the possibility that Anabaena may have acquired csoS3 independent
of the cso operon.
T. weissflogii CA1 (TWCA1) is a rare δ-CA which has been discovered in a few
species of marine diatoms (Roberts et al., 1997). The Anabaena PCC7120 proteome was
47. 34
searched using TWCA1 (AAX08632) protein sequence as a template. The search did not
identify any proteins with significant similarity.
Although α-class CA has not been identified as a carboxysome constituent, α-CA
homologs have been identified in bacteria. The most relevant example is EcaA from
Anabaena PCC7120 and Synechococcus PCC7942 (So et al., 1998; Soltes-Rak et al.,
1997). EcaA was identified as a CA homolog prior to the complete sequencing of the
Anabaena PCC7120 genome and, consequently, other unidentified homologs may exist.
The Anabaena PCC7120 genome database was searched using human CA1
(AAH27890), an α-CA, as the query sequence. The BLASTP search yielded a single
polypeptide with 35% amino acid sequence similarity to the query sequence. This protein
is identical to the previously identified EcaA and is identified in Cyanobase as all2929.
Comparison of the amino acid residues within the α-CA conserved domain of all2929
with human CA1 (Fig 4) revealed a high degree of conservation within the active site
residues as well as the zinc – binding residues. Previous study on EcaA by Soltes-Rak et
al. (1997) indicated that EcaA cross-reacts with antibody directed against chicken α-CAII
(Soltes-Rak et al., 1997). Immunogold labeling of thin sections of Anabaena PCC7120
and Synechococcus PCC7942 using chicken α-CAII (Soltes-Rak et al., 1997) antibody
showed that EcaA appeared to reside on the surface of the cells, possibly in the
periplasmic space (So et al., 1998; Soltes-Rak et al., 1997). Analysis of the EcaA amino
acid sequence using the SignalP 3.0 and TatP 1.0 servers revealed that the first 33 N-
terminal amino acids comprised a signal peptide with an estimated probability of 1.0.
These results are consistent with the results of Soltes-Rak et al (1997). Again, a twin
arginine motif, RRQLL, was identified as the specific signal sequence beginning at
48. 35
residue 6. A signal peptidase cleavage site between amino acid residues 33 and 34 was
also predicted. Thus, it appears that the putative periplasmic carbonic anhydrases of
Anabaena PCC7120 are exported via the Tat, rather than the Sec, export machinery.
Overexpressed EcaA and EcaB from Synechococcus PCC7942 and Synechocystis
PCC6803 showed that these putative carbonic anhydrases were inactive (So et al., 1998).
Finally, Anabaena PCC7120 proteome was searched to find proteins similar to the
γ-type CA, using Cam from Methanosarcina thermophila (Protein Data Bank ID
1THJ_A) as the query. The BLASTP search identified the N-terminal 192 amino acids of
the 555 amino acid polypeptide CcmM as possessing a left-hand parallel beta helix
gamma CA conserved domain (Fig. 5). This region of CcmM had 40 % sequence identity
and 65 % sequence similarity with an e value of 8e-39
. Cam is a homotrimeric protein
that coordinates three separate zinc atoms at dimer interfaces (Kisker et al., 1996).
Dissecting CcmM further revealed that amino acid residues responsible for the formation
of the homotrimer interfaces and active site zinc binding residues, as denoted by the
small pyramids in Figure 5, are conserved. This suggests that CcmM may have CA
catalytic activity. However, there are distinct differences between Cam and CcmM. First,
CcmM is a much larger protein having a C-terminal domain of about 355 amino acids
that is absent in Cam. Within the C-terminal domain, CcmM has three RbcS-like motifs
that are unlikely to play a role in CA activity. Previous work has suggested that the RbcS-
like motifs may be involved in binding RuBisCO within the mature carboxysome
structure. Interestingly, the amino acid sequence of Cam, deduced from the gene,
indicates that Cam has a signal peptide typical of an extracellular enzyme, and in fact
Cam appears to be a periplasmic enzyme in Methanosarcina (Kisker et al., 1996).
49. 36
Analysis of the deduced amino acid sequence of CcmM using the SignalP 3.0 and TatP
1.0 servers shows that it is unlikely to possess a signal peptide with a calculated
probability of 0.019. CcmM is therefore unlikely to be exported to the periplasm.
Deduced amino acid sequences of Anabaena PCC7120 CcmM (all0865),
Synechococcus elongatus PCC6301 CcmM (syc0133_c), Synechococcus elongatus
PCC7942 CcmM, Thermosynechococcus eolongatus BP-1 CcmM (tll0944) and
Metahnosarcina thermophila Cam (1THJ_A) were aligned using ClustalX2
(http://www.clustal.org/ ) (Figure 6). The N-terminal 210 residues of CcmM proteins
were selected and aligned with the Cam. Only the N-terminal residues were chosen so as
to truncate the Rbcs like repeats on the C-terminal end which is not present in Cam. The
sequence alignment showed that the histidine residues involved in Zn2+
binding (His81,
His117 and His122 in Cam) were conserved in all the aligned amino acid sequences
among all the species (Kisker et al., 1996). The amino acid residues involved in trimer
formation in Cam are Arg59, Asp61 and Asp76 (Kisker et al., 1996). The amino acids,
Arg59 and Asp61, of Cam are conserved in all of the aligned amino acid sequences of
CcmM. Asp76 of Cam are conserved in Anabaena and Thermosynechococcus CcmM but
not by the CcmM of Synechococcus CcmM. In Syncechococcus CcmM the aspartic acid
is substituted by a glutamic acid residue. This substitution is unlikely to have major
functional impact as both aspartic acid and glutamic acid are negatively charged acidic
amino acids. The glutamine residue, Gln75, is thought to form hydrogen bonds to H2O in
the active site. It is observed that Gln75 is conserved among all the aligned CcmM and
Cam (Kisker et al., 1996). Finally, cysteine residues (Cys194 and Cys200) in Anabaena
PCC7120 CcmM and Thermosynechococcus elongatus BP-1 CcmM are conserved but
50. 37
are not conserved in the CcmM of Synechococcus elongatus PCC6301 or Synechococcus
elongatus PCC7942.
The 3-dimensional crystal structure of Cam has been determined by X-ray
diffraction and the spatial coordinates for the amino acids can be accessed in Protein Data
Bank (http://www.pdb.org/) using accession number 1THJ (Figure 7a, b Cam). One of
the unique features of the structure of Cam is that it contains seven complete turns of a
left-handed parallel β-helix. The β-helix is topped by a short α-helix and a second α-helix
is formed by the C-terminal portion of the protein. A short segment of the polypeptide
chain at the N-terminus is in extended conformation. Cross-section of the β-helix of Cam
resembles an equilateral triangle as each section of the β-helix contains three parallel
sheets of almost equal length (Kisker et al., 1996). Each of the β-helix contains two β-
turns.
The X-ray crystal structure of CcmM from Anabaena PCC7120 or any other
organism has not yet been determined. In order to compare the structural similarity of
CcmM to Cam, which have high amino acid sequence similarity, a 3D structure of CcmM
is required. Advances in protein structure determination and computational analysis has
led to the development of a suite of programs capable of predicting 3 dimensional protein
structure based on primary amino acid sequence. Chief among these are programs that
utilize template-based homology modeling, fold-recognition and profile–profile matching
algorithms (Kelley and Sternberg, 2009). A 3-D structural model was created for CcmM
using the Phyre server (http://www.sbg.bio.ic.ac.uk/phyre/). The entire 555 amino acids
of Anabaena PCC7120 CcmM could not be resolved by a single model. The best match
model was created using 192 amino acids of CcmM starting from the 4th
N-terminal
51. 38
residue having an e-value of 4.57e-14
(Figure 7a,b CcmM). The predicted 3D structure of
CcmM is strikingly similar to that of Cam. The left handed parallel β-helix observed in
Cam is also observed in CccM. The cross section along the β-helix of the CcmM
resembles an equilateral triangle just like that of Cam. The number, location and
orientation of α-helices are the same in both Cam and CcmM. However, CcmM appears
to have seven complete turns of the left handed parallel β-helix along with an additional
β-strand in the region where Cam has the extended conformation. CcmM appears to have
one β-turn compared to two β-turns in Cam.
Visual inspection revealed that Cam and CcmM have similar structural properties.
To assess the goodness of fit between the known crystal structure of Cam and the model
for CcmM a superimposition program (Superpose,
http://wishart.biology.ualberta.ca/SuperPose/ and SwissPdb, http://spdbv.vital-it.ch/ )
were used to compare mainchain spatial positioning (Figure 7a,b Cam + CcmM
superimposed). The RMS (root mean square deviation) of the crystal structure after
iterative magic fit function in SwissPdb Viewer using 185 α-carbons was 0.41 Å. The
RMS calculated using all 740 atoms of the backbone was 0.52Å. Overall and side chain
RMS values could not be obtained as Cam and CcmM do not contain the same number of
atoms in the side chains. The Cam structure was determined originally at a resolution of
2.8 Å, therefore, RMS values of 0.41 Å and 0.52Å for α-carbons and backbone atoms
respectively shows that the two structures match within the resolution of the available
data. The active site Zn2+
-binding residues (His81, His117 and His122 in Cam) are in the
same position and orientation in CcmM (His75, His102 and His107). The amino acid
residues involved in trimer formation (Arg59, Asp61 and Asp76 in Cam) also appear to
52. 39
be in the same position and orientation in CcmM (Arg57, Asp55 and Asp70 in CcmM).
Finally, spatial orientation of the residue responsible for binding to H2O (Gln75 in Cam)
is similar in Cam and CcmM (Gln69 in CcmM).
The in silico search for a carboxysomal carbonic anhydrase within the proteome
of Anabaena PCC7120 revealed that CcmM has sequence similarity within the N-
terminal region to γ-CA, Cam, of Methanosarcina thermophila. Structural modeling and
analysis revealed that CcmM has high structural similarity to Cam and is therefore a
likely candidate CA in Anabaena PCC7120 which lacks a previously characterized
carboxysomal CA. The other candidate CAs appears to be periplasmic carbonic
anhydrases based on the presence of export leader sequences and other data.
53. 40
Anabaena PCC7120 - all2910
Synechocystis PCC6803 - CcaA
Anabaena PCC7120 EcaA - all2929
NP_486969
Human CA1 – AAH27890
Figure 4: Representation of the location of conserved β-CA and α-CA domains in selected proteins from Anabaena PCC7120,
Synechocystis PCC6803 and humans obtained from the Conserved Domains Database from NCBI server.
54. 41
Anabaena PCC7120 CcmM – all0865
Methanosarcina thermophila Cam - 1THJ_A
Figure 5: Representation of the location of conserved γ-CA domains in selected proteins from Anabaena PCC7120 and
Methanosarcina thermophila obtained from the Conserved Domains Database from NCBI server (figures not to scale).
55. 42
Figure 6: Amino acid sequence alignment output from ClustalX2 for Cam of Mehanosarcina thermophila and CcmM of selected
species of cyanobacteria. Abbreviation used for species are: Ana for Anabaena PCC7120, Thermo for Thermosynechococcus
elongatus BP-1, Methano for Mehanosarcina thermophila, Syn6301 for Synechococcus elongatus PCC6301 and Syn7942 for
Synechococcus elongatus PCC7942. Amino acid residues in red boxes denote the Zn2+
binding residues, those in blue boxes are amino
acid residues involved in the formation of the trimer and the amino acid residues in the yellow box are those that are involved in
hydrogen bonding to water. The green ovals show conserved cysteine residues among Anabaena PCC7120 CcmM and
Thermosynechococcus elongatus BP-1 CcmM.
57. 44
Figure 7: 3D structure of Cam of Methanosarcina thermophila and CcmM of Anabaena
PCC7120. Crystal structure of Cam obtained from x-ray crystallography of γ-CA, Chain
A of Cam, is on the top left (PDB ID: 1THJ). On the top right is the computer modeled
3D structure of CcmM of Anabaena PCC7120 using Phyre server. The bottom 3D
structure denotes the superposition of Cam and CcmM using Superpose followed by an
iterative fit in Swiss-Pdb Viewer. Blue represents regions of β-sheets, red represents
regions of α-helices and green represents regions of extended conformation. All images
are from the same vantage point. a) is the side view and b) is a cross section through the
β-barrel.
b)
58. 45
Mass spectrometric CA assays
In order to establish a positive control, a bonafide carboxysomal CA, CcaA, from
Synechocystis PCC6803, was recombinantly expressed in E. coli and assayed for activity
(So and Espie, 2005). CA activity was determined mass spectrometrically as acceleration
in the rate of loss of 18
O from 13
C18
O labeled CO2 (Figure 8a). At time 0, 2.5 μL of 13
C
18
O labeled bicarbonate was added to the reaction vial as a substrate for CA. Addition of
13
C 18
O labeled bicarbonate to the cuvette initially resulted in the appearance of three
separate CO2 species having a mass/charge (m/z) ratio of 49, 47 and 45, corresponding to
13
C18
O18
O (green line), 13
C18
O16
O (red line) and 13
C16
O16
O (blue line). The mass
spectrometer does not detect charged carbonate species as these do not cross the
membrane of the inlet system. With time, a steady state reaction rate is achieved which
corresponds to the uncatalyzed rate of 18
O loss from CO2. This is reflected in a decrease
in m/z =49 and an increase in m/z = 45. Addition of 200 μL of E. coli lysate in which
CcaA overexpression had been induced resulted in a rapid loss of the substrate, m/z =49 ,
and intermediate, m/z =47, along with a rapid increase in the rate of production of the
product, m/z =45. The rapid increase in the formation of the product followed by the
rapid decrease in the substrate indicates that CA activity was present in the E. coli lysate.
The level of m/z=45 reached a plateau as all of the substrate was converted, indicated by
near zero levels of m/z=49 and m/z=47.
In order to calculate the fold increase in activity from the catalyzed reaction
compared to the uncatalyzed reaction, the atom fraction of 18
O in m/z 49 compared to the
total 18
O was calculated and plotted on a logarithmic scale (Figure 8b). Trend lines were
plotted for the uncatalyzed section of the plot and the catalyzed section of the plot. The
59. 46
equation of the trend line for the uncatalyzed reaction was y = -0.0346x + 1.7404 with a
R2
for the equation to be 0.9948. The equation of the trend line for the catalyzed reaction
was y = -1.7482x + 8.8172 with an R2
value of 0.9329. The R2
value being close to 1
indicates that the linear trend line is close to the actual data. Comparing the slopes of the
uncatalyzed and catalyzed trendline shows a 50 fold increase in the rate of 18
O loss from
m/z 49.
As a negative control, equal amounts of E. coli lysate harboring the pET15b
plasmid alone were added to the reaction vial after the substrate reached steady state
reaction. Addition of the negative control lysate did not increase the rate of production of
m/z =45 indicating that CA activity was absent.
60. 47
Time (min)
13CO2species(uM)
0.0
2.0
4.0
6.0
8.0
10.0
12.0
14.0
0.0 2.0 4.0 6.0 8.0 10.0
CO2-45, uM CO2-47, uM CO2-49, uM
200 uL of E. coli lysate with
overexpressed CcaA added
(a)
Time (min)
Log18O2AtomFraction
(b)
Uncatalyzed
y = -0.0346x + 1.7404
R
2
= 0.9948
With lysate
y = -1.7482x + 8.8172
R
2
= 0.9329
0.0
0.2
0.4
0.6
0.8
1.0
1.2
1.4
1.6
1.8
0.0 2.0 4.0 6.0 8.0
18O Atom Fraction Uncatalyzed trend Trend with lysate
Linear (Uncatalyzed trend) Linear (Trend with lysate)
50X
Figure 8: (a) Mass spectrometric assay for CA activity of E. coli lysate in which CcaA
expression was induced. (b) 18
O atom fraction in m/z 49 with respect to time. The
trendlines represent the uncatalyzed reaction and reaction upon addition of lysate.
61. 48
CA Activity in Synechococcus PCC7942 carboxysomes
Mass spectrometric assays of concentrated intact cells of Anabaena PCC 7120
and of concentrated whole cell lysates of Anabaena PCC7120 failed to show any
detectable CA activity (data not shown). This is consistent with past work that has shown
that CA levels in many cyanobacteria are quite low (Ingle and Colman, 1975; So and
Espie, 2005). What is clear is that the levels of both periplasmic CA and cytosolic CA are
below the level of detection even in concentrated extracts and are therefore unlikely to be
confounding factors in subsequent analysis. Similarly, if present, the level of
carboxysomal CA in Anabaena carboxysomes is also likely to be low and difficult to
detect.
To determine the level of CA activity anticipated from carboxysomes containing a
bonafide CA, CcaA, a carboxysome enriched fraction from Synechococcus PCC7942
lysate was obtained using standard procedures. Synechococcus PCC7942 is known to
contain CcaA and was used to provide a positive control for carboxysome enriched
fraction exhibiting CA activity. In these mass spectrometric assays the steady state
concentration of CO2 (m/z = 49, 47, 45) was reversed to that observed in the positive
control using overexpressed CcaA (Fig. 9a). This was due to the slow deterioration over
time in the content of 18
O in the 13
C labeled CO2. Trace amounts of atmospheric
moisture containing H2
16
O were inevitably introduced into the vial containing substrate
13
C 18
O. As a result there is less and less of m/z = 49 and increasing amounts of m/z = 47
and m/z = 45.
Addition of 200 μL of Synechococcus PCC7942 carboxysome enriched fraction to
the reaction cuvette resulted in an increase in the rate of formation of m/z = 45 with the
62. 49
subsequent drop in m/z = 49 and m/z = 47 (Figure 9a). However, the rate of increase of
m/z = 45 was not as rapid as in the case of overexpressed CcaA and did not plateau after
3 min. The rate of 18
O loss from m/z 49 was plotted on a logarithmic scale (Figure 9b).
The equation of the uncatalyzed steady state reaction was y = - 0.0788x + 1.2838 with an
R2
value of 0.9679 and with the carboxysome extract was y = - 0.1968x + 1.6522 with an
R2
value of 0.9954. Again, the high R2
value of the trend lines indicates that data and the
trend lines have high goodness of fit. The rate with the carboxysome extract was 2.5 fold
faster than the uncatalyzed rate in the loss of 18
O from m/z 49 thus indicating 2.5 fold
increase in the rate of reaction.
The catalysis rate was much lower than of E. coli lysate with overexpressed
CcaA. This was not unexpected as it is known that CcaA levels in cyanobacteria are
much lower than the amount of CcaA produced by an overexpression vector in E. coli.
Moreover, the substrate concentration m/z = 49 in which CA can act on was lower than
the CA assay of overexpressed CcaA.
63. 50
Time (min)
13CO2species(uM)
(a)
0.0
2.0
4.0
6.0
8.0
10.0
12.0
0.0 2.0 4.0 6.0 8.0
CO2-45, uM CO2-47, uM CO2-49, uM
200 uL of Synechococcus PCC7942
carboxysome extract added
Time (min)
Log18O2AtomFraction
(b)
Uncatalyzed
y = -0.0788x + 1.2838
R
2
= 0.9679
With Cbx extract
y = -0.1968x + 1.6522
R
2
= 0.9954
0.0
0.2
0.4
0.6
0.8
1.0
1.2
1.4
0.0 2.0 4.0 6.0 8.0
18O Atom Fraction Uncatalyzed trend
Trend with Cbx extract Linear (Uncatalyzed trend)
Linear (Trend with Cbx extract)
2.5X
Figure 9: (a) Mass spectrometric assay for CA activity of Synechococcus PCC7942
carboxysome extract (b) Log 18
O atom fraction in m/z 49 with respect to time. The
trendlines represent the uncatalyzed reaction and reaction upon addition of carboxysome
extract.
64. 51
CA Activity in Anabaena PCC7120 carboxysomes
Addition of 200 μL of a carboxysome enriched fraction from Anabaena PCC7120
resulted in an increase in the rate of formation of m/z = 45 indicating the presence of CA
activity (Figure 10a). On a protein basis, this increase was similar to that observed for the
Synechococcus PCC 7942 carboxysome enriched fraction. Growth, enrichment and
activity assays were repeated independently seven different times confirming the
presence of CA activity in the carboxysomal extract of Anabaena PCC7120. Addition of
20 μM of ethoxyzolamide, a classical inhibitor of CA, to the carboxysome enriched
fractions and assay buffer eliminated CA activity; so did boiling (indicated by dotted line
in Figure 10a). The rate of 18
O loss from m/z 49 was plotted on a logarithmic scale
(Figure 10b). The equation of the trend line for the uncatalyzed steady state reaction was
y = - 0.0636x + 1.6571 with an R2
value of 0.9978 and with the carboxysome extract was
y = - 0.1645x + 1.6522 with an R2
value of 0.9954. The R2
value of the trend lines being
close to 1 indicates that data and the trend lines have high goodness of fit. The rate with
carboxysome extract was 2.6 fold faster than the uncatalyzed rate in the loss of 18
O from
m/z 49 thus indicating 2.6 fold increase in the rate of reaction.
These results demonstrate a low, but consistently present level of CA activity
concentrated with the carboxysome enriched fraction of Anabaena PCC7120. The
combined results also show that periplasmic CA or cytosollic CA activity contributed
minimally to the activity detected in the carboxysome fraction. Moreover, this activity
was eliminated by the addition of a classical CA inhibitor, ethoxyzolamide. Therefore,
either there is a novel CA in the carboxysomes or one of the previously identified
carboxysomal shell proteins may contribute CA activity. Bioinformatics analysis and in
65. 52
silico search for a CA in Anabaena PCC7120 points towards CcmM as a likely candidate
CA.
66. 53
Time (min)
13CO2species(uM)
(a)
0.0
2.0
4.0
6.0
8.0
10.0
12.0
0.0 2.0 4.0 6.0 8.0 10.0
CO2-45, uM CO2-47, uM CO2-49, uM
200 uL of Anabaena PCC7120
carboxysome extract added
Time (min)
Log18O2AtomFraction
(b)
Uncatalyzed
y = -0.0636x + 1.2887
R
2
= 0.9922
With Cbx extract
y = -0.1645x + 1.6571
R
2
= 0.9978
0.0
0.2
0.4
0.6
0.8
1.0
1.2
1.4
0.0 2.0 4.0 6.0 8.0 10.0 12.0
18O Atom Fraction Uncatalyzed trend
Trend with cbx extract Linear (Uncatalyzed trend)
Linear (Trend with cbx extract)
2.6X
Figure 10: (a) Mass spectrometric CA assay of carboxysome enriched fraction from
Anabaena PCC7120. The dotted line represents the assay with 20 μM of CA inhibitor,
etoxyzolamide. (b) Log 18
O atom fraction in m/z 49 with respect to time. The trendlines
represent the uncatalyzed reaction and reaction upon addition of carboxysome extract.
67. 54
Activity of full length CcmM
CcmM protein was recombinantly expressed in E. coli using the overexpression
vector pET21. Western blot analysis was performed using a polyclonal antibody made
against Synechococcus PCC7942 CcmM to detect the presence of CcmM in Anabaena
PCC7120. Antibody staining and development showed bands at about 50 and 58 KDa in
lanes A and C containing 10X and 100X dilution of E. coli lysate in which CcmM was
induced respectively (Figure 11). The 50 KDa band was very faint in the 100X dilution
and was not detected by the scanner. The estimated size of CcmM in Anabaena PCC7120
is 58 KDa, which is same as the detected band in the western blot. Western blot analysis
of Anabaena carboxysome extract in lane D also produced bands at about 50 and 58 KDa
with CcmM antibody indicative of the presence of CcmM in Anabaena PCC7120. Lane
C which contained the negative control sample, E. coli lysate with induced empty vector,
did not cross-react with CcmM antibody.
Lysates of E. coli in which CcmM has been induced were assayed for activity.
Addition of the lysate did not increase the steady state reaction as indicated by no
increase in the rate of formation of m/z = 45 (Figure 12a). The rate of 18
O loss from m/z
49 was plotted on a logarithmic scale (Figure 12b). The equation of the trend line for the
uncatalyzed steady state reaction was y = - 0.0915x + 1.433 with an R2
value of 0.9982
and with lysate was y = - 0.1004x + 1.4792 with an R2
value of 0.9986. The R2
value of
the trend lines being close to 1 indicates that data and the trend lines have high goodness
of fit. Comparing the slopes of the catalyzed and uncatalyzed reaction trend lines reveals
that addition of the E. coli lysate with CcmM overexpressed resulted in minimal
enhancement (1.1 fold increase) of the reaction. Growth, induction and CA activity assay
68. 55
was repeated independently five times with minimal enhancement of CA activity. The
total protein assayed to detect CcmM activity was comparable to the total protein used in
CcaA assay. The CA activity enhancement using recombinantly expressed CcmM was
minimal, even when compared to CA activity from carboxysomal extracts of Anabaena
PCC7120 or Synechococcus PCC7942. E. coli lysate proteins without CcmM
overexpressed also resulted in the minimal increase (1.1 fold increase) in 18
O loss from
m/z 49 (Figure 13ab). Therefore, it may be concluded that E. coli lysate with
overexpressed CcmM does not show enhanced CA activity as it has no increase in CA
activity as compared to the control E. coli lysate with empty pET21 vector.
69. 56
M = Size marker
A = 10X dilution
B = -ve control
C = 100X dilution
D = Anabaena PCC7120 lysate
75
50
100
37
25
20
M A B C D
Figure 11: Western Blot using CcmM antibody for E. coli lysate overexpressing CcmM
and Anabaena PCC7120 lysate. Lane M is the marker lane, lane A is the 10X dilution of
E. coli lysate overexpressing CcmM, lane B is E. coli lysate containing no CcmM vector,
lane C is 100X dilution of E. coli lysate overexpressing CcmM and lane D is Anabaena
PCC7120 lysate. It is seen that CcmM corresponding to 58 kDa is expressed in the E. coli
as well as in the Anabaena PCC7120 lysate.
70. 57
Time (min)
13CO2species(uM)
(a)
0.0
2.0
4.0
6.0
8.0
10.0
0.0 2.0 4.0 6.0 8.0 10.0
CO2-45, uM CO2-47, uM CO2-49, uM
200 uL of E. coli lysate with
overexpressed CcmM added
Time (min)
Log18O2AtomFraction
(b)
Uncatalyzed
y = -0.0915x + 1.433
R
2
= 0.9982
With lysate
y = -0.1004x + 1.4792
R
2
= 0.9986
0.0
0.2
0.4
0.6
0.8
1.0
1.2
1.4
0.0 2.0 4.0 6.0 8.0 10.0 12.0
18O Atom Fraction Uncatalyzed trend Trend with lysate
Linear (Uncatalyzed trend) Linear (Trend with lysate)
1.1X
Figure 12: (a) Mass spectrometric assay for CA activity of E. coli lysate in which CcmM
expression was induced. (b) Log 18
O atom fraction in m/z 49 with respect to time. The
trend lines represent the uncatalyzed reaction and reaction upon addition of E. coli lysate
in which CcmM expression was induced.
71. 58
Time (min)
13CO2species(uM)
(a)
0.0
2.0
4.0
6.0
8.0
10.0
0.0 2.0 4.0 6.0 8.0 10.0
CO2-45, uM CO2-47, uM CO2-49, uM
200 uL of E. coli lysate
with empty pET21 vector
Time (min)
Log18O2AtomFraction
(b)
Uncatalyzed
y = -0.0829x + 1.4884
R
2
= 0.9954
With lysate
y = -0.0907x + 1.5243
R
2
= 0.9982
0.0
0.2
0.4
0.6
0.8
1.0
1.2
1.4
1.6
0.0 2.0 4.0 6.0 8.0 10.0
18O Atom Fraction Uncatalyzed trend Trend with lysate
Linear (Uncatalyzed trend) Linear (Trend with lysate)
1.1X
Figure 13: (a) Mass spectrometric assay for CA activity of E. coli lysate containing
empty pET21 vector. (b) Log 18
O atom fraction in m/z 49 with respect to time. The trend
lines represent the uncatalyzed reaction and reaction upon addition of E. coli lysate
containing empty pET21 vector.
72. 59
Attempts to activate CcmM
Various factors were altered in attempts to activate CcmM as summarized in
Table 3. Induction temperature was varied from 16°C to 37°C and the inducer, IPTG,
concentration was alternated between 1 or 2 mM to determine if induction temperature
and IPTG affected CcmM expression and activity. Equal quantity of total protein from E.
coli induced at different temperatures and inducer concentrations were loaded into wells
and electrophoresed. Western blot was carried out using CcmM antibody. The Western
blot showed that at 37°C using 2 mM IPTG was the optimal temperature for the
overexpression of CcmM (Figure 14). CcmM expression levels did not have any effect on
CcmM having CA activity. Zinc is a candidate cofactor for activation of CcmM. E. coli
lysate with overexpressed CcmM was incubated for 1 h with 0.05, 0.5, 1 and 2 mM Zn2+
and assayed for CA activity. Addition of Zn2+
at any of the tested concentration did not
appear to have made CcmM active. Redox active reagent dithiothreitol (DTT) at
concentrations of 0.05, 0.10 and 2 mM was added to the overexpressed CcmM extract
and in the assay buffer to see if DTT can activate CcmM. DTT did not appear to have
activated CcmM. Attempts were made to activate CcmM with excess bicarbonate.
Addition of 20 mM bicarbonate did not activate CcmM. As CcmM has RbcS like C-
terminal repeats, therefore RuBisCO may interact with CcmM C- terminal end and
activate it in the process. 1 mg of purified RuBisCO from spinach (Sigma R8000-1UN)
was added to 200 uL of E. coli lysate in which CcmM had been induced and incubated
for 15 min. Addition of RuBisCO did not make CcmM CA active. Assaying at a pH
range of 7.2 to 8.5 had no effect in activating CcmM. The CcmM lysate from E. coli was
concentrated to 10X but that did not result in the activation of the CcmM overexpressed
73. 60
protein. Bubbling of oxygen for 15 min did not activate CcmM. A combination of 1 mM
Zinc, 0.1 mM DTT and 20 mM bicarbonate at pH 8 did not activate the CcmM.
74. 61
1 2 3 4 5 6 7 8
250
150
100
75
50
37
25
20
Figure 14: Western blot using CcmM antibody for varying temperature and IPTG
treatments during CcmM overexpression. Lane 1 contains –ve control containing E. coli
lysate with empty expression vector, lane 2 contains standard protein marker with the size
indicated on the left side of the blot, lane 3 contains overexpressed CcmM at 16°C
induced with 2 mM IPTG, lane 4 contains overexpressed CcmM at 37°C with 2 mM
IPTG for induction. Lanes 5, 6, 7, 8 and 9 contains overexpressed CcmM at 25, 30, 37
and 16°C respectively induced with 1 mM IPTG.
75. 62
Table 3: Factors changed in attempts to activate CcmM. CcmM was overexpressed in E.
coli and cell lysate was assayed for CA activity after manipulation of the factors listed
below.
Factors tested Probable effect on CcmM CA Activity
Induction temperature (16 -37°C) Protein Folding No
Zinc (0.05 – 2.0 mM) Part of active site No
Dithiothreitol (DTT) (0.05, 0.1 & 2
mM)
Thioredoxin association with
CcmM
No
Bicarbonate (HCO3
-
) (20 mM) Non-active site regulator No
RuBisCO (1 mg in 200 μL of E. coli
lysate in which CcmM has been
induced)
C-terminal repeats of RbcS-like
sequence. Possible binding to
RbcL or RbcS.
No
pH (7.2 – 8.5) Enzyme requires optimum pH No
10X concentration Ensure enough protein No
Bubbling oxygen for 15 min Oxidative activation No
1 mM Zinc, 0.1 mM DTT and 20
mM bicarbonate at pH 8
Combinatorial activation No
76. 63
Cellulose acetate assay
Cellulose acetate assays to separate CA active protein from carboxysome were
performed. 0.01 mg, 0.001 mg, 0.0001 mg and 0.00001 mg of bovine CA was loaded as
positive control and 0.01 mg of boiled bovine CA was loaded as negative control.
Positive control using bovine CA produced transient yellow bands in a red background
after passing CO2 over the cellulose acetate plates which disappeared immediately after
removing the CO2 stream. This assay could detect a faint band up to the concentration of
0.0001 mg. Considering bovine CA has a molecular mass of 30 KDa, the limit of
detection was determined to be 3.3 x 10⁻¹²
moles. As bovine CA has one active site per
molecule this corresponds to 2 x 10¹²
active sites. Loading and electrophoresing 0.1 mg
of carboxysomes extract yielded no distinct band. Very faint yellowing was observed
around the carboxysome loading spot (picture could not be taken due to the lack of
appropriate camera).
T7 tag - affinity pull down experiments
Attempts were made to pull down and concentrate the CA active agent in the
Anabaena PCC7120 lysate using T7 tagged CcmM bound to anti-T7 tag resin. Western
blot analysis using CcmM antibody showed that CcmM did bind to the anti-T7 resin as
indicated by strong CcmM cross-reactivity in lane 3 of Figure 15. The T7-tagged resin
with CcmM bound to it did not have CA activity. A 2 L culture of Anabaena PCC7120
was centrifuged and the precipitated cells were lysed in a French press to a volume of 10
mL. The Anabaena PCC7120 lysate was incubated with CcmM bound to the anti-T7
resin. After incubation the lysate was allowed to flow out of the column and the column
77. 64
washed. Incubation of the Anabaena PCC7120 lysate with CcmM bound to anti-T7 resin
was done with the aim to pull out proteins in the Anabaena PCC7120 lysate which has
affinity to CcmM thus activating it or concentrating the active CA. The resin was then
assayed for CA activity. However, no activity could be detected in the resin.
78. 65
75
50
100
150
250
1 2 3 4 5 6
Figure 15: Western blot using CcmM antibody to show binding in anti-T7 agarose. Lane
1 contains the standard protein marker, lane 2 contains Anabaena PCC7120 lysate, lane 3
contains anti-T7 agarose which has been incubated with E. coli lysate expressing CcmM
and washed to remove non specific proteins, lane 4 contains anti-T7 agarose negative
control, lane 5 contains E. coli lysate expressing CcmM and lane 6 contains E. coli lysate
with empty expression vector.
79. 66
Sulfonamide pull down assays
Sulfonamide inhibits CA by binding to the active site metal ion (Coleman, 1967).
Since sulfonamides bind to the active site of CA, immobilized sulfonamide column can
be used to isolate CA. As a positive control E. coli lysate with His tagged CcaA
overexpressed was incubated with activated sulfonamide resin and then washed to
remove proteins weakly bound. Western blot using CcaA antibody produced bands at 31
kDa and 38 kDa for the resin and eluate as seen in lane 1 and 2 of Figure 16. Very faint
bands were observed in similar location in the wash buffer eluate in lane 4. No such
bands were observed in the negative control containing E. coli lysate with no insert.
Carboxysome extract of Anabaena PCC7120 was mixed with the sulfonamide binding
buffer and incubated for an hour with activated sulfonamide resin. The sulfonamide resin
was washed to remove proteins that were weakly bound. The sample was sent for protein
sequencing to see what proteins bound to the sulfonamide column and if they correspond
to any previously characterized protein from Anabaena PCC7120. 62 individual protein
sequences were detected by the mass spectrometer. The identified protein sequences were
compared to the NCBI proteome database for Anabaena PCC7120. The only identifiable
protein related to the CCM was CcmM (Figure 17). The probability of match to CcmM
was 100%. The rest of the identified proteins were membrane transporters or other
membrane related proteins. Nineteen hypothetical proteins were also identified. The
hypothetical proteins were modeled using PHYRE to identify if any of the hypothetical
proteins had structural similarity to any previously characterized proteins involved in the
CCM. However, all of the models of the hypothetical proteins produced had close
similarity to membrane transporters and porins.
80. 67
1 2 3 4 5
250
150
100
75
50
37
25
20
Figure 16: Western blot using CcaA antibody to show CcaA binding in sulfonamide
resin. Lane 1 contains E. coli lysate with overexpressed CcaA flow through, lane 2
contains E. coli lysate with overexpressed CcaA resin bound, lane 3 contains the protein
marker and lane 4 contains the wash buffer flow through. Lane five is negative control
containing E. coli lysate with an empty expression vector.
81. 68
gi|17228360 (100%), 59,464.3 Da
carbon dioxide concentrating m echanis m protein [Nostoc sp. PCC 7120], gi|17130210|dbj|BAB72822.1| carbon dioxide concentrating m echanism protein [No
4 unique peptide s, 4 unique spe ctra, 4 total spectra, 57/555 am ino acids (10% coverage)
M A V R S T A A P P T P W S R S L A E A Q I H E S A F V H P F S N I I G D V H I G A N V I I A P G T S I R A D E G T P F
H I G E N T N I Q D G V V I H G L E Q G R V V G D D N K E Y S V W V G S S A S L T H M A L I H G P A Y V G D N S F I G F
R S T V F N A K V G A G C I V M M H A L I K D V E V P P G K Y V P S G A I I T N Q K Q A D R L P D V Q P Q D R D F A H H
V I G I N Q A L R A G Y L C A A D S K C I A P L R N D Q V K S Y T S T T V I G L E R S S E V A S N S L G A E T I E Q V R
Y L L E Q G Y K I G S E H V D Q R R F R T G S W T S C Q P I E A R S V G D A L A A L E A C L A D H S G E Y V R L F G I D
P K G K R R V L E T I I Q R P D G V V A G S T S F K A P A S N T N G N G S Y H S N G N G N G Y S N G A T S G K V S A E T
V D Q I R Q L L A G G Y K I G T E H V D E R R F R T G S W N S C K P I E A T S A G E V V A A L E E C I D S H Q G E Y I R
L I G I D P K A K R R V L E S I I Q R P N G Q V A P S S S P R T V V S A S S A S S G T A T A T A T R L S T E V V D Q V R
Q I L G G G Y K L S I E H V D Q R R F R T G S W S S T G A I S A T S E R E A I A V I E A S L S E F A G E Y V R L I G I D
P K A K R R V L E T I I Q R P
gi|17228360 (100%), 59,464.3 Da
carbon dioxide concentrating m echanis m protein [Nostoc sp. PCC 7120], gi|17130210|dbj|BAB72822.1| carbon dioxide concentrating m echanism protein [No
3 unique peptide s, 3 unique spe ctra, 3 total spectra, 47/555 am ino acids (8% coverage)
M A V R S T A A P P T P W S R S L A E A Q I H E S A F V H P F S N I I G D V H I G A N V I I A P G T S I R A D E G T P F
H I G E N T N I Q D G V V I H G L E Q G R V V G D D N K E Y S V W V G S S A S L T H M A L I H G P A Y V G D N S F I G F
R S T V F N A K V G A G C I V M M H A L I K D V E V P P G K Y V P S G A I I T N Q K Q A D R L P D V Q P Q D R D F A H H
V I G I N Q A L R A G Y L C A A D S K C I A P L R N D Q V K S Y T S T T V I G L E R S S E V A S N S L G A E T I E Q V R
Y L L E Q G Y K I G S E H V D Q R R F R T G S W T S C Q P I E A R S V G D A L A A L E A C L A D H S G E Y V R L F G I D
P K G K R R V L E T I I Q R P D G V V A G S T S F K A P A S N T N G N G S Y H S N G N G N G Y S N G A T S G K V S A E T
V D Q I R Q L L A G G Y K I G T E H V D E R R F R T G S W N S C K P I E A T S A G E V V A A L E E C I D S H Q G E Y I R
L I G I D P K A K R R V L E S I I Q R P N G Q V A P S S S P R T V V S A S S A S S G T A T A T A T R L S T E V V D Q V R
Q I L G G G Y K L S I E H V D Q R R F R T G S W S S T G A I S A T S E R E A I A V I E A S L S E F A G E Y V R L I G I D
P K A K R R V L E T I I Q R P
Figure 17: Mass spectrometric analysis of proteins isolated from the sulfonamide column. Mass spectrometric analysis identified
stretches of amino acid sequences highlighted in yellow. BLASTP search of the NCBI database using the identified amino acid
sequences identified the protein to be CcmM of Anabaena PCC7120. b) Second mass spectrometric analysis of the same sample.
CcmM of Anabaena PCC7120 was again identified.
a)
b)
82. 69
Analysis of Anabaena PCC7120 CcmM209
Results of the sulfonamide pull down assay again lead to CcmM as the
carboxysomal CA in Anabaena PCC7120, but its lack of CA activity is problematic.
Potentially, the long C-terminal region of CcmM, when outside the carboxysome
environment, may cause torsional strain on the protein leading to a distorted active site in
the N-terminal γ-CA domain resulting in the lack of activity. In order to circumvent the
influence of the C-terminal end, a His tagged truncated version of CcmM containing only
the N-terminal 209 amino acids (CcmM209) was constructed. CA activity assays of
freshly prepared E. coli lysate over-expressing CcmM209 proved to be negative (not
shown). However, lysate incubated with the thiol oxidizing agent diamide (20 mM) for 1
hour, exhibited CA activity (Figure 18a). The equation of the trend line for the
uncatalyzed steady state reaction was y = -0.0617x + 1.7954 with a R2
value of 0.9994
and the equation of the trend line for diamide treated E. coli lysate expressing CcmM209
was y = -0.1668x + 2.0197 with an R2
value of 0.9986 (Figure 18b). Comparing the
slopes of the uncatalyzed reaction to the reaction with diamide treated E. coli lysate
expressing CcmM209 showed a 2.7 fold increase from the steady state uncatalyzed rate.
CcmM209 was concentrated by binding to the His.Bind affinity resin. After
binding, the resin from the His.Bind affinity column was also assayed for CA activity.
CcmM209 bound to the resin also exhibited CA activity (Figure 19a). The equation of the
trend line for the uncatalyzed steady state reaction was y = -0.0678x + 1.8769 with a R2
for the equation to be 0.9987 and the equation of the trend line for CcmM209 bound to
His.Bind affinity column was y = -0.2508x + 2.2235 with an R2
value of 0.9954 (Figure
19b). The resin bound CcmM209 showed a 3.7 fold increase in activity compared to the
83. 70
steady state uncatalyzed rate (Figure 19b). Freshly prepared E. coli lysate in which
CcmM209 was not expressed displayed no CA activity nor did the resin through which
the lysate was passed (Figure 20ab).