1. 1. Background: What are we talking about & why?
5. Proposed Solutions / Countermeasures: What do you purpose and why?
2. Current Condition: Where do things stand now?
1. Trinity- Health Emergency Care Redesign Initiative:
2. ED-IP Placement Measure (iDashboard)
3. Goals & Target: What specific outcome is required?
By end of year 2015, June 30th, 2016: Focus on...
KPI #1: Decrease Median Arrival to Discharge time to ≤ 140.0 min (Treat & Release Patients)
KPI #2: Decrease Median Arrival to Provider time to consistently ≤ 15.0 min. (Treat & Release Patients)
KPI #3: Decrease Left without Being Seen percentage to consistently ≤ .50% (All Patients)
4. Analysis & Root Cause: Why does the problem exist?
Increased ED volume, higher acuity patients & high hospital census is driving up boarder hours, while negatively impacting
Patient Throughput & Satisfaction. The current process is unpredictable with a significant amount of variation with regards to
handoffs & communications from unit to unit, and shift to shift. Staffing constraints & turn-over is impacting team morale. Teams
not following standardized work or effectively collaborating on transferring patient to the units.
Huddles are not being utilized effectively to facilitate, communicate & engage associates in continuous improvement activities.
Problem Statement:
Reference Cause & Effect Diagram (Source File: TBD)
A3 Template
Process Owner(s): Denise Bajer / Dr. Rahul Mehta
Champion: Kathleen Brodbeck /Shannon Striebich
Px Coach: Dave Follis
Project Title: ED Process Improvement_2.0 (ref. Hoshin Kanri: KPI's O3 & O4 )
Overall Status: Complete
Start Date: 6/15/15
Last Update: 7/31/16
Green: On Track
Yellow: Some what Delayed
Red: Major Barrier
Blue: Complete
Background:
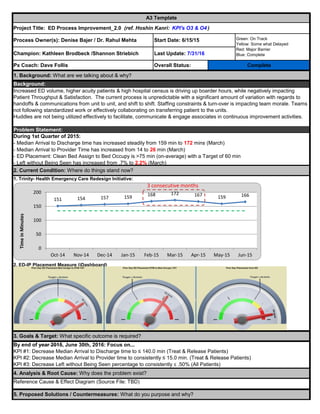
During 1st Quarter of 2015:
- Median Arrival to Discharge time has increased steadily from 159 min to 172 mins (March)
- Median Arrival to Provider Time has increased from 14 to 26 min (March)
- ED Placement: Clean Bed Assign to Bed Occupy is >75 min (on-average) with a Target of 60 min
- Left without Being Seen has increased from .7% to 2.2% (March)
151 154 157 159 168 172 167 159 166
0
50
100
150
200
Oct-14 Nov-14 Dec-14 Jan-15 Feb-15 Mar-15 Apr-15 May-15 Jun-15
TimeinMinutes
3 consecutive months
2. Completion
Date
6/30/2015
6/30/2015
7/15/2015
7/31/2015
7/31/2015
7/31/2015
7/31/2015
8/30/2015
7/31/2015
9/30/2015
12/15/2015
5/31/2016
9/30/16
On-going
10/31/2015
10/31/2015
On-going
11/30/2015
4/30/16
12/15/2015
3/31/16
9/16/2016
9/30/2016
3/31/16
9/15/16
Complete A2
, Livonia, Hackley, Muskegon
Sub A3: Increase Vertical Lean Volume Complete Before: 21 Pts /day; After: 33 Pts. / day
Hansei/Transition to Process Owner
Publish / Share results w/Ops SLT
Pilot (PDCA Cycles) Complete Pilot #3 (In-progress)
On Track
On Track
Comments
Complete
Complete
6. Implementation Plan: How will you implement?
Complete
Status (RYG)Key Deliverables
Implementations:
1. POD Model Cell / Vertical Lean (ESI 4&5 w/simple 3's)
2. Patient Placement Sheet (Pull to Full)
3. PFC Role (Coordination of Care)
4. Quick Reg. (Pt Name, DOB, PH # & CC)
5. Bedside Registration (Full Reg.)
6. ED Playbook - Standard Work (PFC/Triage, ERTA,
Medic, CLC...etc.)
7. KPI Measures (Huddles & iDashboard Update)
8. Abreviated Intake Process (w/Vitals & EKG)
9. Dedicated PA / Provider in Vertical Lean (expanded
hours)
10. CLC / Charge RN Std Work (Guidelines for Pace of
Care)
11. Optimize Ancillary Services (Lab & Radiology), Pull vs. Push
12. Streamline Discharge Process / POS Collections (Before:
$10K; After: $23K/month)
13. ED-EVS Service Level Agreements (Cleanliness & Bed
Turnover)
14. Leader Standard Work w/daily audits (Manager, CLC, Charge
Nurse)
15. 5S Area (Clean Supply Closets, VL /Triage Areas...etc)
16. Omicell & Ortho Supplies relocated to VL (Reduce Motion)
17. Installation of dedicated Pyxis/Medications in Vertical Lean
18. Staffing / Workload Balance (Changed hours of nurses)
19. Mini Huddles w/POD Team (Run the Board)
20. 2-Bin Kanban replenishment system for Supply Carts
Document Current State
Update & Post Huddle Performance Metrics Complete Plan to update & post metric week of 6/29
Develop Future State
Complete
On-going w /Leadership rounding
Change Management Toolkit (as
Reinstitute Leadership Standard Work
(Audits)
Complete
On Track
Changing Beliefs & Behaviors (daily)
Gemba rounds every Thursday at 0730 in
ED (CNO)
CompleteTrain & Educate "New" Standard
Patient Care Experience Team has started
Coordination of Care (ED-IP)Develop / Update Standard Work (as
Complete
Complete
On-going w/Pilots
Identify Countermeasures (S/T) On-going w/Pilots
Prioritize Recommendations /
Updating weekly action plans per pilot
resultsComplete
Continue to work on weekly action plansComplete
On-going w/PilotsCompleteBrainstorm Improvement / Suggestion
Develop 30, 60, & 90 day Action Plan
Implementation Plan (Master Task List)
Piloting POD Model Cell Concept
Voice of Customer Gathering
Benchmarking RHM's (POD Models)
Sub A3: 5S-Workplace Organization Complete
5S work with SCM on PAR levels (2-bin
Kanbans), Armstrong Carts
ROI (Financial Impact)
On Track
Update ED iDashboard & Care
Redesign Dashboard
Complete
Finalized changes to iDashboard to
integrate EC data as single source for
Planning celebration with Process OwnerProject completion has been extended to
end of June, 2016
7. Metrics: Planned vs. Actual Results
Roseann, Dave & Katie reviewed Business
Impact, still need to finalize numbers based
3.
4. Baseline % Improv
172.0 15%
23.0 42%
2.2% 66%
77.9% 13%
146.0
Emergency Care Optimization Summit Presentation on ED Improvement Work @ SJMO (6/10)
8. Follow-up / Control Plan: How will you ensure on-going sustainability (PDCA)?
9. Best Practice Sharing: How can you share your learning's?
Y3 = %LWBS ≤ .50% 0.75%
Started rollout of Standard Leader Work (Audits) - week of 3/21/16, 2nd PDCA cycle started 6/27/16
≤ 15.0 13.3Y2 = Median Door to Doc Time
Measure/Metric
7. Metrics: How will you know if you've impacted need / expectations?
Target/Goal Actual to Date
Y4 = Likelihood of Recommending ≥ 88.1% 87.8%
Y1 = Median Arrival to Discharge Time ≤ 140.0
Before After