The role of mobile in US consumer's omni-channel path to purchase
•
53 likes•9,594 views

In this report we will look into why retailers and retail marketers need to pay more attention to the role of mobile in the US shopper’s consumer journey and track how shoppers use mobile devices to fulfill their needs and wants from initial research to final purchase. We trace the US consumer’s mobile path to purchase as they use smartphones and tablets across three stages: 1. The Awareness Stage where consumers conduct pre-purchase research 2. The Influence Stage where consumers make a purchase decision 3. The Conversion Stage where consumers buy the product or service

Recommended
Recommended
More Related Content
Viewers also liked
Viewers also liked (14)
The role of mobile in US consumer's omni-channel path to purchase
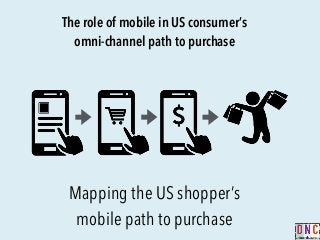
- 1. The role of mobile in US consumer’s omni-channel path to purchase Mapping the US shopper’s mobile path to purchase
- 2. • In 2014, 29% of US consumers said smartphones were the most important shopping tool up from 23% in 2013. • 42% of consumers consider a mobile device as the most important resource for a purchase decision just behind laptops and desktops at 43%. • 60% of US consumers claim to have used only their smartphones when deciding which restaurant to visit. • 40% of US consumers claim to have used only smartphones when deciding on their choice of entertainment.35% of US consumers say they used only smartphones when deciding on which car to buy. • 68% of US consumers conduct pre-purchase research on their smartphones at some point in their purchase journey. • Among US consumers who research on their smartphones, 37% make the final purchase in a store followed by 35% who make the final purchase on their smartphones. • 67% of US consumers conduct pre-purchase research on their tablets at some point in their purchase journey. • Among consumers who use tablets for research, 41% end up making the final purchase on tablets, 33% make the final purchase in store, and 32% use the laptop to make the final purchase. • 74% of US consumers conduct pre-purchase research on their laptops at some point in their purchase journey. Key Findings
- 3. • Among consumers who use laptops for research, 52% make the final purchase on laptops followed by 37% who make the final purchase in store and 21% use their tablets to make the final purchase. • 60% of US shoppers conducted research in stores. • Among the store researchers, 57% end up buying from the store compared to 29% who buy from their laptops. • 53% of US smartphone using shoppers accessed the device when inside their homes in 2014 up from 32% in 2013. • 76% of tablet using shoppers accessed the device in their homes in 2014. • 49% of entertainment shoppers used their mobile device to browse and see options. • 48% of telecom shoppers and 47% of auto shoppers used their mobile device to browse and find options compared to 36% of restaurant shoppers. • 58% of US shoppers prefer visiting retailer website for product discovery. • 33% of US shoppers preferred to access retailer branded apps. • Only 13% of US shoppers prefer to discover products and services through opt-in notifications and alerts. • 72% of US consumers use their mobile devices to research electronic products. • 57% of shoppers in the clothing category and 46% in the shoes & fashion accessories category use their mobile devices to research products. • 46% of US consumers research household items on mobile devices and 45% research appliances to discover possible purchase options. Key Findings
- 4. • 49% of telecom shoppers conduct in-depth research on mobile devices to narrow down their choices compared to 20% of restaurant goers. • 61% of smartphone using shoppers and 50% of tablet using shoppers look up possible locations they can visit near them. • 52% of shoppers access smartphones and 44% access tablets to look up directions to local stores. • 41% of US shoppers accessed smartphones and 42% accessed tablets to look up reviews and decide on which store to visit. • 38% of smartphone using shoppers and 32% of tablet using shoppers called local stores asking for information such as opening and closing times, availability of product, and on-going promotions before deciding to visit. • 80% of consumers use mobile devices inside a store to enhance their shopping experience, up from 64% a year ago. • The most popular way to use mobile devices while in-store is to comparison shop (59%) followed by searching for coupons (48%) and reviews (47%). • Retail stores are the top business venue for consumer mobile usage accounting for 31% of mobile connections followed by restaurants (21%), service-related venues (19%) and financial institutions (15%). • 28% of in-store mobile usage happens in clothing stores followed by convenience stores (18%) and specialty stores (12%). • 52% of US consumers share retail related posts on social media. Key Findings
- 5. • 51% of consumers visit social media platforms to post pictures of items they are interested to purchase. • Only 18% of consumers visit social media sites to post videos of the products they are considering for purchase. • On average, 62% of consumers who used a mobile device during the shopping process made a purchase. An additional 16% deferred purchase for a future date. • 49% of smartphone using shoppers and 42% of tablet using shoppers complete their purchase within an hour or less of using their mobile device to start browsing for options. • On average 65% of mobile using shoppers make a purchase on the same day they started browsing for possible options on the device. • 23% of US shoppers who used their mobile device inside a retail store made a purchase on the device itself up from 12% a year ago. • For both smartphones and tablets people are most comfortable spending $100-$249. Smartphones outpace tablets for purchases under $250, while tablets outpace smartphones for purchase over $250. Key Findings
- 6. The role of mobile in US consumer’s omni-channel path to purchase Click to read the full briefing
- 7. Most important media source for information, 2013 vs 2014 % US Consumers who picked smartphones as the most important media source for information Source: xAd/Telemetrics, 2014 29% 23% 2013 2014 Get this chart on PPT & KEY
- 8. Source: xAd/Telemetrics, 2014 Most important media source for information while shopping % US Consumers by their choice of most important media source of information 1% 8% 5% Tablet 13% Smartphone 29% 43% Laptop or Desktop Smartphone Tablet Print sources Television Other Get this chart on PPT & KEY
- 9. Source: xAd/Telemetrics, 2014 Single device usage to make a final purchase decision % US Consumers that used only a single mobile device to make purchase decision across categories 31% 16% 40% 15% 40% 35% 60% 13% Smartphone Tablet Telecom Restaurant Auto Entertainment Get this chart on PPT & KEY
- 10. Source: NinthDecimal, 2014 Final purchase location for shoppers who used smartphones % US Consumers who used smartphones to research by venue where they completed the purchase 68%32% Did not use smartphone Used smartphone for research 21% 28% 35% 37% Purchased in-store Purchased on smartphones Purchased on laptop Purchased on tablet Get this chart on PPT & KEY
- 11. Source: NinthDecimal, 2014 Final purchase location for shoppers who used tablets % US Consumers who used smartphones to research by venue where they completed the purchase 67%33% Did not use tablet Used tablet for research 41% 32% 15% 33% Purchased in-store Purchased on smartphones Purchased on laptop Purchased on tablet Get this chart on PPT & KEY
- 12. Source: NinthDecimal, 2014 Final purchase location for shoppers who used laptops % US Consumers who used smartphones to research by venue where they completed the purchase 74%26% Did not use laptop Used laptop for research 21% 52% 16% 37% Purchased in-store Purchased on smartphones Purchased on laptop Purchased on tablet Get this chart on PPT & KEY
- 13. Source: NinthDecimal, 2014 Final purchase location for shoppers who visited retail stores % US Consumers who used smartphones to research by venue where they completed the purchase 60%40% Did not visit retail store Visited retail store for research 18% 29% 19% 57% Purchased in-store Purchased on smartphones Purchased on laptop Purchased on tablet Get this chart on PPT & KEY
- 14. Source: xAd/Telemetrics, 2014 Mobile activity by consumer journey stage % US Consumers who used a mobile device 10% 25% 48% 13% 37% 55% 12% 24% 51% 14% 39% 51% Telecom Restaurant Auto Entertainment Awareness Stage Influence Stage Conversion Stage Get this chart on PPT & KEY
- 15. Source: xAd/Telemetrics, 2014 Mobile device usage location for shopping purpose % US Consumers who used a mobile device for shopping by location and type of device 47% 68% 53% 32% In home Out of home 2013 2014 24% 20% 76% 80% In home Out of home 2013 2014 Smartphones Tablets Get this chart on PPT & KEY
- 16. Mobile search activity among consumers across categories % US Consumers who browsed to see available options on their mobile devices Source: xAd/Telemetrics, 2014 36% 47%48%49% Entertainment Telecom Auto Restaurants Get this chart on PPT & KEY
- 17. Source: NinthDecimal, 2014 Product discovery methods among US consumers % US Consumers used given mobile tool to discover products before buying 13% 15% 18% 22% 39% 55% 13%13%13% 21% 33% 58% All shoppers Shoppers who bought on mobile Retailer’s Website Retailer’s Branded App Retailer’s Mobile Site Shopping Aggregator App Shopping Aggregator Website Opt-in notifications and Alerts Get this chart on PPT & KEY
- 18. Pre-purchase research behavior on mobile device by category % US Consumers who conducted pre-purchase research on their mobile device Source: NinthDecimal, 2014 33% 35% 45%46%46% 57% 72% Electronics Clothing Shoes & Fashion Accessories Household Items Appliances Furniture Jewelry Get this chart on PPT & KEY
- 19. Pre-purchase research behavior by category & mobile device % US Consumers who conducted pre-purchase research on their mobile device by type of device Source: NinthDecimal, 2014 Electronics Clothing Shoes & Fashion Accessories Household Items Appliances Furniture Jewelry 21%24% 30%31%28% 38% 41% 12%11% 15%15%18%19% 31% Smartphone Tablet Get this chart on PPT & KEY
- 20. Source: xAd/Telemetrics, 2014 Consumer mindset at the start of mobile activity while shopping % US Consumers by mindset at beginning of mobile path to purchase by category 21% 19% 42% 4% 19% 21% 46% 8% 25% 18% 43% 7% 13% 18% 51% 7% Telecom Restaurant Auto Entertainment I had no idea what I was looking for I had a general idea of what I was looking for I had narrowed down what I was looking for I knew exactly what I was looking for Get this chart on PPT & KEY
- 21. In-depth mobile research among consumers across categories % US Consumers who carried out in-depth research on mobile device by category Source: xAd/Telemetrics, 2014 20% 34% 44% 49% Entertainment Telecom Auto Restaurants Get this chart on PPT & KEY
- 22. Source: xAd/Telemetrics, 2014 Mobile app or website usage by purpose % US Consumers who used a mobile app or website by purpose and type of device 32% 42% 50% 44% 59% 50% 38% 41% 49% 52% 57% 61% Smartphone Tablet Look for a location near me Find/compare prices Look up directions to visit a local store Find coupons/deals/promos Use reviews to decide on location to visit Call the store for more info Get this chart on PPT & KEY
- 23. Source: NinthDecimal, 2014 In-store mobile device usage among US shoppers % US Consumers who used mobile device when visiting a store 36% 64% Regularly use mobile device in-store Don't use mobile device in-store 20% 80% 2012 2013 Get this chart on PPT & KEY
- 24. In-store mobile device usage behavior among US consumers % US Consumers who use mobile device inside a store by type of activity Source: NinthDecimal, 2014 23% 25% 29% 47%48% 59% Comparison shopped Searched for coupons Searched for product reviews Obtained additional information Searched for a friend’s review Purchased on mobile while in-store Get this chart on PPT & KEY
- 25. Source: NinthDecimal, 2014 Top commercial venues where consumers use a mobile device % mobile connections by commercial venue 9%1%2%2% Financial 15% Service 19% Restaurants 21% Retail 31% Retail Restaurants Service Financial Hospitality Gyms Churches Other Get this chart on PPT & KEY
- 26. Top retail venues where people use their mobile device % mobile connections inside a store by type of store Source: NinthDecimal, 2014 3% 3% 3% 3% 4% 5% 6% 6% 9% 12% 18% 28%Clothing Convenience stores Specialty stores Electronics Auto Discount Big box / Dept. stores D.I.Y. Food & Grocery Sporting goods Home furnishings Beauty Get this chart on PPT & KEY
- 27. Source: NinthDecimal, 2014 Types of posts retail consumers share on social media % US Consumers who visited a store and shared content on social media 52%48% Did not share retail discovery on social media Shared retail discovery on social media 18% 27% 28% 29% 37% 51% Pictures of items I’m interested in Items I’ve purchased Coupons via mobile ads Sales via email Sales via mobile ad Videos Get this chart on PPT & KEY
- 28. Conversion rates among mobile shoppers by category % US Consumers who use a mobile device during the shopping process Source: xAd/Telemetrics, 2014 Overall Telecom Restaurant Auto Entertainment 26%26% 12% 23%22% 15% 20% 8% 22% 16% 59% 54% 80% 55% 62% Yes, I completed a transaction/purchase Not yet but I plan to in the near future No, I did not complete a transaction/purchase Get this chart on PPT & KEY
- 29. Source: xAd/Telemetrics, 2014 Time taken from mobile research to conversion % US Consumers who used a mobile device for shopping research by time taken to buy 15%6%12%18%49% Immediately/within the hour Within the day Within the week Within the month Longer than month/not looking Smartphones Tablets 18%7%14%19%42% Get this chart on PPT & KEY
- 30. Conversion rates among mobile shoppers by category % US Consumers who use a mobile device during the shopping process Source: xAd/Telemetrics, 2014 Telecom Restaurant Auto Entertainment 4% 7%8%11% 37% 9%9% 20% 26% 16% 5% 26% 32% 67% 77% 42% In person at the store/location Online via PC Online via mobile device By phone call Get this chart on PPT & KEY
- 31. Location search on a mobile device by shopping category % US Consumers looked up store location on their mobile device before making a purchase Source: NinthDecimal, 2014 13% 24% 26% 31% Auto Telecom Restaurant Entertainment Get this chart on PPT & KEY
- 32. Source: NinthDecimal, 2014 Mobile purchase behavior among US shoppers % US Consumers who purchased a product after store visit by mode of payment 88% 12% Purchased on mobile after store visit for research Purchased in-store during store visit for research 77% 23% 2012 2013 Get this chart on PPT & KEY
- 33. Source: NinthDecimal, 2014 Mobile spending among US consumers for retail purchase % US Consumers who use a mobile device to buy products by amount spent 17% 12% 21% 24% 14% 13% 9% 7% 16% 25% 20% 22% Smartphone Tablet $1-49 $50-99 $100-249 $250-499 $500-999 $1000+ Get this chart on PPT & KEY
- 34. The role of mobile in US consumer’s omni-channel path to purchase Click to get charts ready for PowerPoint and Keynote