1. Correlations
Phosphate Vibrations as Reporters of DNA Hydration
Danyal Floisand and Steve A. Corcelli
Department of Chemistry and Biochemistry, University of Notre Dame, Notre Dame, IN 46556
0 10 20 30 40 50
Time (ps)
0
0.2
0.4
0.6
0.8
C(t)
CFull
(t)
CHB
(t)
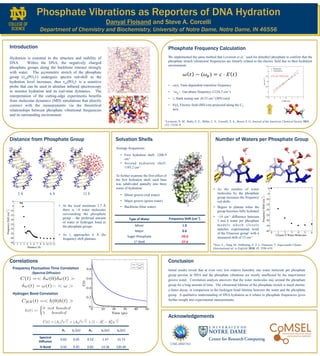
• ω(t), Time-dependent transition frequency
• <ωg>, Gas phase frequency (1234.5 cm-1)
• c, Stark tuning rate (0.53 cm-1/(MV/cm))
• E(t), Electric field (MV/cm) projected along the C2
axis
CHE-0845763
Introduction Phosphate Frequency Calculation
Distance from Phosphate Group Solvation Shells Number of Waters per Phosphate Group
Conclusion
Acknowledgements
A1
τ1
(ps)
A2
τ2
(ps)
τ3
(ps)
Spectral
Diffusion
0.83
0.05
0.52
1.47
15.73
H-‐Bond
0.42
0.45
0.82
14.36
120.40
Frequency Fluctuation Time Correlation
Hydrogen Bond Correlation
Type
of
Water
Frequency
ShiA
(cm-‐1
)
Minor
1.0
Major
0.6
Sugar-‐Phosphate
-‐29.0
1st
Shell
-‐27.6
6 Å
12 Å
2 Å
• At the local minimum 3.7 Å
there is ~4 water molecules
surrounding the phosphate
group – the preferred amount
of water to hydrogen bond to
the phosphate groups
• As rj approaches 6 Å the
frequency shift plateaus
Average frequencies:
• First hydration shell: 1206.9
cm-1
• Second hydration shell:
1195.2 cm-1
To further examine the first effect of
the first hydration shell, each base
was subdivided spatially into three
zones of hydration:
• Minor groove (red water)
• Major groove (green water)
• Backbone (blue water)
• As the number of water
molecules by the phosphate
group increases the frequency
red shifts
• Begins to plateau when the
group becomes fully hydrated
• ~14 cm-1 difference between
1 and 6 water per phosphate
models which closely
matches experimental work
of the Elsaesser group* with a
measured shift of 15 cm-1
*Szyc, Ł.; Yang, M.; Nibbering, E. T. J.; Elsaesser, T. Angewandte Chemie
(International ed. in English) 2010, 49, 3598–610.
! ! − !! = ! ⋅ ! ! !
We implemented the same method that Levinson et al.^ used for dimethyl phosphate to confirm that the
phosphate stretch vibrational frequencies are linearly related to the electric field due to their hydration
environment:
^Levinson, N. M.; Bolte, E. E.; Miller, C. S.; Corcelli, S. A.; Boxer, S. G. Journal of the American Chemical Society 2011,
133, 13236–9.
Hydration is essential to the structure and stability of
DNA. Within the DNA, the negatively charged
phosphate groups along the backbone interact strongly
with water. The asymmetric stretch of the phosphate
group (νas(PO2)-) undergoes spectra red-shift as the
hydration level increases, thus νas(PO2)- is a sensitive
probe that can be used in ultrafast infrared spectroscopy
to monitor hydration and its real-time dynamics. The
interpretation of the cutting-edge experiments benefits
from molecular dynamics (MD) simulations that directly
connect with the measurements via the theoretical
relationships between phosphate vibrational frequencies
and its surrounding environment.
!
Initial results reveal that at even very low relative humidity one water molecule per phosphate
group persists in DNA and the phosphate vibrations are mostly unaffected by the major/minor
groove water. Correlation analysis uncovers that the water molecules stay around the phosphate
group for a long amount of time. The vibrational lifetime of the phosphate stretch is much shorter,
a faster decay, in comparison to the hydrogen bond lifetime between the water and the phosphate
group. A qualitative understanding of DNA hydration as it relates to phosphate frequencies gives
further insight into experimental measurements.
-3 -2 -1 0 1 2 3
E (MV/cm)
-1.5
-1
-0.5
0
0.5
1
1.5
!"(cm
-1
)
Symmetric
Asymmetric
E
0.53 cm-1/(MV/cm)
(Spectral Diffusion)