
Recommended
Recommended
More Related Content
What's hot
What's hot (20)
Similar to 20200331 asia covid 19 - grocery retail survey - india v final-ds
Similar to 20200331 asia covid 19 - grocery retail survey - india v final-ds (20)
Recently uploaded
Recently uploaded (20)
20200331 asia covid 19 - grocery retail survey - india v final-ds
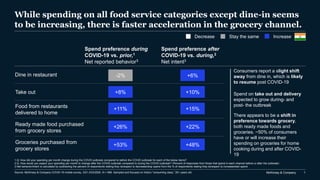
- 1. McKinsey & Company 1 While spending on all food service categories except dine-in seems to be increasing, there is faster acceleration in the grocery channel. 1.Q: How did your spending per month change during the COVID outbreak compared to before the COVID outbreak for each of the below items? 2.Q: How would you expect your spending per month to change after the COVID outbreak compared to during the COVID outbreak? (Percent of responses from those that spend in each channel before or after the outbreak) 3.Net behavior/intent is calculated by subtracting the percent of respondents stating they do/expect to decrease/stop spend from the % of respondents stating they do/expect to increase/start spend Spend preference during COVID-19 vs. prior,1 Net reported behavior3 Spend preference after COVID-19 vs. during,2 Net intent3 Groceries purchased from grocery stores +53% Dine in restaurant -2% +6% Ready made food purchased from grocery stores +26% +22% Food from restaurants delivered to home +11% +48% +15% Take out +8% +10% Decrease Stay the same Increase There appears to be a shift in preference towards grocery, both ready made foods and groceries. ~50% of consumers have or will increase their spending on groceries for home cooking during and after COVID- 19 Consumers report a slight shift away from dine in, which is likely to resume post COVID-19 Spend on take out and delivery expected to grow during- and post- the outbreak Source: McKinsey & Company COVID-19 mobile survey, 3/21-3/23/2020, N = 568. Sampled and focused on India’s “consuming class,” 20+ years old.
- 2. McKinsey & Company 2 Indian consumers are also spending more often on groceries during COVID-19, including in online channels. 1. Percent of responses from consumers who visited each channel before COVID. 2. Q: Among the below grocery shopping channels, which ones do you visit more/less frequently during the COVID-19 outbreak compared to before? 3. Net behavior/intent is calculated by subtracting the percent of respondents stating they do/expect to decrease frequency/spend from the % of respondents stating they do/expect to increase frequency/spend. 4. Q: Within the below store types, which ones do you think you will visit more/less frequently after the COVID-19 outbreak stabilize? 5. Q: Which store types have you increase your spending per month during the COVID-19 outbreak compared to before? (Percentage of consumers who have used each channel). 6. Q: Which store types have you decrease your spending per month during the COVID-19 outbreak compared to before? (Percentage of consumers who have used each channel, excl. those who increased their spend at a particular channel). Change in grocery purchase frequency1 % of respondents Decrease Stay the same Increase Change in grocery spending % of respondents Decrease Stay the same Increase Source: McKinsey & Company COVID-19 mobile survey, 3/21-3/23/2020, N = 568. Sampled and focused on India’s “consuming class,” 20+ years old. Kirana shops Hypermarket National chain supermarket Local supermarket Cash and carry Local fruits and vegetables shop Chemists Convenience store Online During vs. prior,2 Net reported behavior3 +39% -5% +25% -4% +5% +28% +11% +40% +7% After vs. during,4 Net intent3 +29% +9% +23% +9% +23% +2% +26% +38% 0% During vs. prior,56 Net reported behavior3 +26% +3% +19% -3% +3% +4% +18% +31% +5%
- 3. McKinsey & Company 3 In physical stores, hygiene is a major driver of customer experience; less than 15 percent report promotions as a top three factor. Most important factors impacting consumers’ current in-store experience,1 % of respondents selecting factor as top three 50 39 38 37 30 27 24 22 21 12 Availability of assistance from store staff Availability of hygienic services for in-store use for customers Store staff demonstrating cleanliness practices Product availability Able to shop without interacting with staff Proactive communication of store cleaning procedures/policies Transparent communication of changes Promotions Product prices for branded products Availability of private brands 1. Q: What were the most important factors impacting your in-store grocery shopping experience during the COVID outbreak? Cleanliness attributes Source: McKinsey & Company COVID-19 mobile survey, 3/21-3/23/2020, N = 568. Sampled and focused on India’s “consuming class,” 20+ years old.
- 4. McKinsey & Company 4 Important factors for store selection in the next few weeks remain the availability of fresh food, proximity to home, and crowd levels. 39 39 38 33 31 28 23 21 20 15 13 Competitive prices on branded products Stable availability of private brands2 Crowd levels/number of people in store Ability to shop and pay without interacting with staff Stable availability of fresh food products Store location (close to home or work) I can order online before going to store and pick up or get delivered Robustness of cleanliness/hygiene practices in store Store is open early in the morning Stable availability of home brands2 Store is open until late at night Most important factors in choosing a grocer to go to in the next four weeks,1 % of respondents selecting factor as top three 1. Q: What are the top 3 most important factors that will influence which physical store you do grocery shopping in during the next 4 weeks? 2. Home brands are local brands, and private brands are only available in modern trade. Source: McKinsey & Company COVID-19 mobile survey, 3/21-3/23/2020, N = 568. Sampled and focused on India’s “consuming class,” 20+ years old.
- 5. McKinsey & Company 5 One-third of shoppers have switched from their regular stores, and one-third may not switch back. 35% of consumers have switched to a different store1 70 41 30 29 28 24 21 20 16 8 Changed to a store closer to home Primary/ regular store does not offer competitive prices on national brand products (excl. fresh products) Changed to an online store/mobile app-based store Changed to a store that offers better delivery service Primary/ regular store feels not to be safe/infection free Changed to a store that offers better curbside or in-store pick up service Primary/ regular store is out of stock of a lot of items Changed to a store closer to work Primary/regular store did not have good quality fresh products Primary/ regular store stocked out on their private brands Reason for trying or switching to a different store2 Post-COVID situation3 66% of consumers who switched stores are expected to switch back to their primary store 1. Q: During the COVID-19 outbreak, did you go to your regular/ primary store to shop for groceries? 2. Q: Why have you switched from your regular/ primary store for your grocery store? Select all that apply. (Percent of responses from those that have switched to/ visited the other stores) 3. Q: Do you plan to go back to shopping at your regular/ primary store after the COVID outbreak? (Percent of responses from those that have switched to/ visited the other stores) 4. Including complete and partial switching 65% of consumers are still visiting their regular/primary store for grocery needs1 Source: McKinsey & Company COVID-19 mobile survey, 3/21-3/23/2020, N = 568. Sampled and focused on India’s “consuming class,” 20+ years old. 28% 9% 45%4 41%4 11%4 48%4 53% 60% 92% 88% 73% 98%
- 6. McKinsey & Company 6 Categories with high consumption before COVID-19 (such as dairy and eggs) are expected to remain in high demand. Consumption during COVID-19 situation vs. before12 Anticipated consumption after COVID-19 situation vs. during3 34 34 32 34 32 29 28 27 27 24 23 25 23 23 20 20 23 33 32 34 32 31 31 31 31 28 31 30 28 28 28 30 27 21 21 20 22 23 22 27 26 26 29 25 25 22 28 32 25 25 19 7 9 7 7 8 8 9 11 9 13 13 14 12 13 14 15 17 5 5 5 5 6 4 6 6 6 8 8 11 9 5 12 13 20 Baby Personal care Dairy Bottled water Fresh food Household care5 Household paper goods Staples Beverages Health food/supplements/herbals Frozen meat Packaged food Snacks Eggs Pet care Frozen food Food prepared in store Significantly increased (+20% or more) Significantly decreased (-20% or less)No change in spending (more or less 5% difference) Somewhat decreased (-5 to -20%)Somewhat increased (+5 to +20% more) 52 39 35 31 36 36 28 28 29 24 23 25 24 27 18 23 23 23 29 30 32 29 26 28 29 33 28 29 27 27 21 26 27 19 14 20 23 23 22 22 26 26 25 23 25 23 26 29 24 23 18 8 9 11 11 11 11 12 9 9 14 15 15 14 13 18 18 19 3 2 3 3 4 6 7 3 11 7 10 9 11 13 10 20 2 1. Q: How did you or your family’s spending per month change during the COVID-19 outbreak compared to before the COVID-19 outbreak? 2. Percent of responses from consumers who buy each item before, during and after the COVID-19 outbreak. 3. Q: How would you expect you or your family’s spending per month to change after the COVID-19 outbreak compared to now (during the COVID-19 outbreak)? (Percent of responses from consumers who buy each item before, during or after the COVID-19 outbreak). 4. Net inflow is calculated by subtracting the percent of respondents stating they stop buying the item they have bought before during the outbreak from the % of respondents stating they only start purchasing the item during the outbreak. 5. Cleaning & detergent -2% Net inflow,4 % of respondents5 -1% -2% -2% -3% -2% -2% -1% -2% -5% -4% -4% -6% +2% -4% -5% -4% Source: McKinsey & Company COVID-19 mobile survey, 3/21-3/23/2020, N = 568. Sampled and focused on India’s “consuming class,” 20+ years old.
- 7. McKinsey & Company 7 Two-thirds of consumers have tried new brands, based on ease of consumption and availability, and about 10 percent intend to not switch back. 35% of consumers have not tried new/alternate product brands1 65% of consumers have tried new/alternate product brands1 55 49 43 40 40 New/alternate options offer better value (are cheaper) New/alternate options are perceived to be easier for consumption during the COVID outbreak Brands that I usually purchase were not available New/alternate options are perceived to be safer New/alternate options were under promotions/display Primary driver for switching to a new brand/product during COVID-19,2 % respondents who have tried new/alternate product brands Post-COVID-19 situation3 89% of consumers who switched brands expect to switch back to the brands they usually purchased before 1. Q: Have you tried new/ alternate product brands during the current COVID outbreak that you do not usually purchase? 2. Q: If yes, why did you switch from the brands you usually purchase to new/ alternate options? (N = 371, Percent of responses from consumers who have tried new new/alternate product brands). 3. Q: After the COVID outbreak, do you plan to switch back to the product brand you usually purchased? (N = 371, Percent of responses from consumers who have tried new new/alternate product brands). Source: COVID-19 mobile survey, 3/21-3/23/2020 N = 568, sampled and focused on “consuming class” 20+ years old 32% 9% 68% 43% 17% 35% 80% 91% 95% 92% 61% 94%