Impact of foreign exchange on the revenue and profit of selected IT companies
EURUSD Currency Par - August 2016
1. EURUSD Currency Par All Rights Reserved ®
Contrary to mainstream, suggesting a more hawkish Fed (when compared to ECB & BOJ) will drive the
USD stronger, empirical evidence suggests the opposite.
Over the past two years, currency markets were responsible for the transmission mechanism of global
growth rebalancing. The evidence was noticeable in the EU/US Real Yield Spread differential (Real
interest rates in Europe have entered into negative territory, while in US, yet coming down, it stayed
range bound from the beginning of 2014 until the end of 2015). That was a result of investors pricing a
much higher probability of US rate hikes.
With the convergence of developed world interest rates, it makes noticeable the difficulty of the USD to
keep appreciating over the course of 2016 (Brexit was an outlier, momentarily reverting the trend).
Let’s take a look where we are in terms of the Par technical levels, and the interest rate differential
among the two continents:
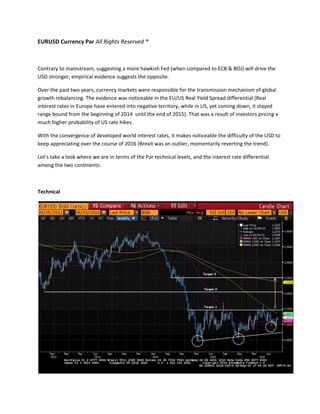
Technical
2. Since the low of EURUSD in March/April 2015, the Par has been making higher lows (trending up),
suggesting strengthening momentum. It has tested the 1.15 a few times since then, and the more it
tests, the more likely it “wants” to break-up.
The 200-day Moving Average (50-pink line in the Weekly chart below) has flattened and is beginning to
trend up, and the Par is already trading above this important level.
Interest Rates Differential
The second chart shows the correlation among the EURUSD Par and the two continents’ Real Interest
Rate Differential. Real Rates in Europe have reached extreme low (negative) levels, and also a historical
low in the difference to US, at the end of 2015.
Since that point, rates in US have traded lower, to reach levels closer to EU. The two forces of this move
is (1) the convergence of nominal rates among US and EU, and (2) higher inflation expectations in US,
backed by stronger economic data. So, the second chart suggests a historical bottom, at the end of last
year, in Real Rate Differential, and the beginning of the uptrend (It is more likely for interest rates to
move higher when they are further into negative territory).
3. Regression
The last chart is the Ln Regression of the Correlation of chart 2. Here, the interesting point is the red
circle in the chart, showing that even when the rate differential dives into negative (extreme) territory,
the Par doesn’t trade much lower than 1.10 (note that the same happens when the rate differential is at
the other opposite extreme, the currency Par stays between 1.40 to 1.50).
Even if nominal rates in US starts to trend higher than in Europe, considering a higher probability of a
hawkish Fed to be priced ahead, the extreme (negative) low rates in Europe are unlikely to move further
into negative territory, and (mainly) inflation in US is likely to surprise to the upside, keeping real rates in
check.
4. Conclusion
USD is unlikely to get weaker from here, and evidence suggests a relative weakening towards the
EUR.
Logical target zone, as shown on chart 1, is 1.15, then 1.20 and ultimately 1.25.
With inflation expectation likely to surprise to the upside in US, versus in Europe, the real rate
spread is likely to trade in the old range between 0.25 – 1.25, supporting the EURUSD Par target
zone.
Stable to lower USD will keep supporting EM equities & debt, US equities’ earnings and exports, and
sectors like materials, industrials, tech.
Daniel Mancia Nunes
All Rights Reserved ®