1. Beer Monitor Basic: a new, economic method
for inline alcohol measurement in the brewery
Daniel L. Gore, Brewer & Maltster, Application & Product Specialist
Anton Paar GmbH, Austria # 0167
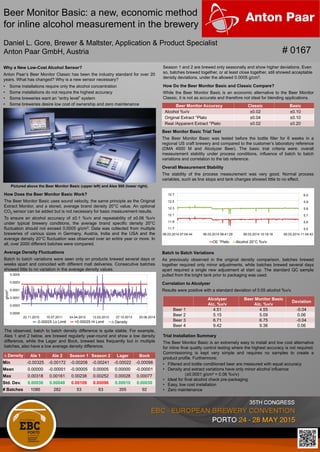
Beer Monitor Accuracy Classic Basic
Alcohol %v/v ±0.02 ±0.10
Original Extract °Plato ±0.04 ±0.10
Real /Apparent Extract °Plato ±0.02 ±0.20
Alcolyzer
Alc. %v/v
Beer Monitor Basic
Alc. %v/v
Deviation
Beer 1 4.51 4.55 -0.04
Beer 2 5.15 5.09 0.06
Beer 3 6.71 6.75 -0.04
Beer 4 9.42 9.36 0.06
Why a New Low-Cost Alcohol Sensor?
Anton Paar’s Beer Monitor Classic has been the industry standard for over 20
years. What has changed? Why is a new sensor necessary?
• Some installations require only the alcohol concentration
• Some installations do not require the highest accuracy
• Some breweries want an “entry level” system
• Some breweries desire low cost of ownership and zero maintenance
The observed, batch to batch density difference is quite stable. For example,
Ales 1 and 2 below, are brewed regularly year-round and show a low density
difference, while the Lager and Bock, brewed less frequently but in multiple
batches, also have a low average density difference.
Beer Monitor Basic Trial Test
The Beer Monitor Basic was tested before the bottle filler for 6 weeks in a
regional US craft brewery and compared to the customer’s laboratory reference
(DMA 4500 M and Alcolyzer Beer). The basic trial criteria were: overall
measurement stability under process conditions, influence of batch to batch
variations and correlation to the lab reference.
Overall Measurement Stability
The stability of the process measurement was very good. Normal process
variables, such as line stops and tank changes showed little to no effect.
Batch to Batch Variations
As previously observed in the original density comparison, batches brewed
together required only minor adjustments, while batches brewed several days
apart required a single new adjustment at start up. The standard QC sample
pulled from the bright tank prior to packaging was used.
Correlation to Alcolyzer
Results were positive with a standard deviation of 0.05 alcohol %v/v.
Trial Installation Summary
The Beer Monitor Basic is an extremely easy to install and low cost alternative
for inline final quality control testing where the highest accuracy is not required.
Commissioning is kept very simple and requires no samples to create a
product profile. Furthermore:
• Filtered and bottle conditioned beer are measured with equal accuracy
• Density and extract variations have only minor alcohol influence
(±0.0001 g/cm³ = 0.06 %v/v)
• Ideal for final alcohol check pre-packaging
• Easy, low cost installation
• Zero maintenance
∆ Density Ale 1 Ale 2 Season 1 Season 2 Lager Bock
Min -0.00325 -0.00172 -0.00208 -0.00241 -0.00022 -0.00098
Mean 0.00000 -0.00001 -0.00005 0.00005 0.00000 -0.00001
Max 0.00318 0.00161 0.00238 0.00252 0.00028 0.00077
Std. Dev. 0.00036 0.00048 0.00109 0.00096 0.00010 0.00030
# Batches 1086 282 53 63 355 92
Pictured above the Beer Monitor Basic (upper left) and Alex 500 (lower right).
How Does the Beer Monitor Basic Work?
The Beer Monitor Basic uses sound velocity, the same principle as the Original
Extract Monitor, and a stored, average brand density 20°C value. An optional
CO2 sensor can be added but is not necessary for basic measurement results.
To ensure an alcohol accuracy of ±0.1 %v/v and repeatability of ±0.06 %v/v
under typical brewery conditions, the average brand specific density 20°C
fluctuation should not exceed 0.0005 g/cm3. Data was collected from multiple
breweries of various sizes in Germany, Austria, India and the USA and the
average density 20°C fluctuation was observed over an entire year or more. In
all, over 2000 different batches were compared.
Average Density Fluctuations
Batch to batch variations were seen only on products brewed several days or
weeks apart and coincided with different malt deliveries. Consecutive batches
showed little to no variation in the average density values.
06.03.2014 07:04:44 06.03.2014 08:41:29 06.03.2014 10:18:16 06.03.2014 11:54:42
OE °Plato Alcohol 20°C %v/v
12.7
12.5
12.3
12.1
11.9
11.7
6.0
5.9
5.8
5.7
5.6
5.5
25.06.201427.10.201312.02.201324.04.201215.07.201122.11.2010
-0.00025 Lo Limit +0.00025 Hi Limit ∆ Density
0.0005
0.0003
0.0001
0.0001
0.0003
0.0005
g/cm3
Season 1 and 2 are brewed only seasonally and show higher deviations. Even
so, batches brewed together, or at least close together, still showed acceptable
density deviations, under the allowed 0.0005 g/cm3.
How Do the Beer Monitor Basic and Classic Compare?
While the Beer Monitor Basic is an economic alternative to the Beer Monitor
Classic, it is not as accurate and therefore not ideal for blending applications.