1. I
2009 Ford Flex Fuel Efficiency
MATLS. 3J03 Statistics for Process Improvement
A Design of Experiments Project; 2009 Ford Flex Fuel Efficiency
Hallatt, Dan
Materials Science & Engineering; McMaster Univeristy, Ontario Canada
Introduction
Thriving in an age of personal transportation our society has become progressively conscious
of the arduous affect that fuel efficiency has on both the economy and the environment. With such
copious amount of time and money being exhausted on improving the fuel efficiency of such
machines I found it appropriate to investigate the factors affecting said efficiency. Employing a
2009 Ford FlexTM
, I set out to investigate the physical aspects that could affect the fuel efficiency
through a factorial designed statistical experiment. My completion of such an experiment resulted
in producing a linear model of the significant factors tested. This consequently allows me to dissect
the experimental scenario that took place and formulate a statistically backed proposal for future
experiments designed to further improve fuel efficiency.
Experimental Framework
In order to develop a suitable experimental design I formulated a broad collection of all
possible influential factors on fuel efficiency and then suitably reduced the number of factors down
to ones that were reasonable and feasible to adjust in practice. The shortened list of viable variables
was narrowed down to the following:
mass, speed, acceleration, center of gravity, windows, trunk
Fittingly, reference to the ‘design trade off table’ (appx.A) was taken advantage of to take
comprehensive consideration of all possible experimental designs. Due to time constraints it was
found that as a basis, the maximum number of runs that could be performed was 16. Naturally, with
the constraint of 16 maximum experimental runs, this restricted the freedom of experimental design
to a maximum resolution of five. From this point, if I was to remain with six factors, I could either
accept a resolution three or four design. In addition, if I was to perform an experiment of resolution
four with the six outlined variables, I could fundamentally add two more factors into the design
without losing anything due to confounding or expenditures. I realized that I could essentially gain
more knowledge without having to spend more money, time, or accuracy. The two factors that I
considered adding to my experiment, if a resolution of four proved appropriate, were:
air conditioning, road type
To conclusively determine which exact experimental design was to be implemented, all
possible interactions between each factor had to be evaluated. In this manner, I used my
engineering knowledge to draw the conclusion that enough of the two and three factor interactions
may transpire to be significant in their influence of the fuel efficiency that I could in-fact not afford
to run a resolution four or less design with such factors. A resolution four design would require that
two factor interactions were confounded with other two factor interactions and main effects were
2. II
2009 Ford Flex Fuel Efficiency
confounded with three factor interactions. This, based on my prior anticipations, was not
acceptable. Specifically this was due to interactions such as {windows*speed},
{acceleration*speed}, {speed*windows*trunk}, and many more, that with engineering knowledge
could have factored into affecting the desired response of the experiment. This conclusive result
restricted my optimistic hopes of testing eight factors by realizing that I could only investigate five
if I wanted to respect the possible interactions. But, if I was to reduce the number of variable factors
that I could test, I would have to sacrifice one of the above original factors that I hypothesized
would affect fuel efficiency. Eventually, by weighing the trade-offs of lower resolution against
lower number of factors, I came to the conclusion that because of the nature of the experimental
subject, dropping a factor in my experiment should not be a critical verdict. Thus it was set that I
would run a 25-1
, five factor, resolution five experiment by dropping the center of gravity variable to
finalize to the following factors:
mass, speed, acceleration, windows, trunk
The subject of feasibility was then considered for a final time by exploring the possible
metrics and controls for the experiment’s factors, response, and non-accounted for variables.
Firstly, the response of the experiment was measured using the ability of the 2009 Ford Flex to
offer a direct measurement of the vehicle’s total fuel consumption per 100 kilometers. By the nature
of the measurement of the vehicle’s efficiency as the summation of the trip’s fuel used per distance,
this was a specific reason for not dropping the acceleration factor from the design instead of the
center of gravity factor. In other words, the acceleration of the vehicle was an anticipated
significant factor of fuel efficiency and the nature of the fuel efficiency measurement allowed for
this factor to be contributed into the response. A track length of 1.6 kilometers was decided upon to
ensure accuracy in the measurement of the fuel efficiency. The mass of the vehicle (pounds) was
simply measured by the mass of the person’s inside, since the mass of the vehicle alone is the same
in every run and would thus block itself out of the variable. The speed (km/h) of the vehicle, being
a continuous variable, was measured by the vehicle’s speedometer and controlled by the use of
implementing the cruise control feature of the vehicle once the desired speed was met. The
acceleration (RPM), also being a continuous variable, was measured using the vehicle’s
accelerometer gauge and controlled by human ability. By controlling the mechanical settings of the
vehicle, the window’s elevation factor could be also be measured and controlled. Lastly, the trunk
of the vehicle, being a binary variable, was measured by inspection and controlled by the
mechanical mechanisms of the vehicle.
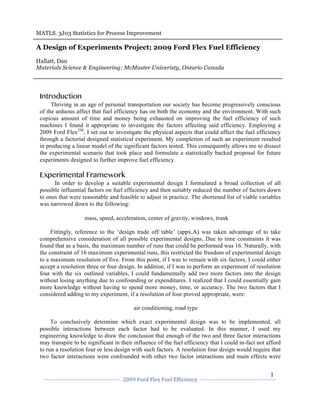
Each of the tested factors were implemented into a half fractional factorial design experiment
and thus assigned an investigational range that respected both safety and feasibility concerns in the
construction of the extrema. These factors’ desired extrema were then entered into a factorial
design table (Fig.1) along with using Minitab 17TM
to calculate the confounding pattern and
generator which was assigned to the trunk factor. Coding a random number set mixer in PythonTM
,
the experimental run order was generated from the standard order.
3. III
2009 Ford Flex Fuel Efficiency
Fig. 1: Factorial design table of experiment performed
External Variability
In preparation of the performance of the experiment that I designed, careful consideration had
to be taken into account while formulating and controlling external and unaccounted for variability.
Some variability that was intentionally unaccounted for was the road conditions, center of mass,
and air conditioning. These were unaccounted for in the model because of feasibility issues and
scenario specific conditions such that air conditioning would not be used in the time of experiment,
winter. The variability of the external conditions also included the weather, passing cars, human
performance, temperature, and measurement error in the fuel efficiency by the vehicle’s gauge
itself. The majority of these factors were controlled by a form of blocking by running the
experimental runs under similar conditions. This included running the experiment during the same
day, on the same road, and having a single driver perform the entire experiment. The experiment
was also run on a country road so external traffic could be limited. Despite these precautions and
others being accounted for, uncontrollable variability is always present and that is why I
implemented a recorder to record any abnormal factors that could affect the response of the
experiment throughout time. The principal unaccounted for variability proved to be the
inconsistency in the number of cars passing, shown in appendix C.
4. IV
2009 Ford Flex Fuel Efficiency
Results
After preparation of the experiment had concluded, the experiment was run to produce results
of fuel efficiency (Fig.2). These responses were immediately linearly modeled to be dependent on
all of the included factors.
Fig.2: Results from experiment of each 16 runs
The results of the experimental runs provided 16 values of fuel efficiency respective of each half-
fraction factorial run. I can thus construct a linear regression model based on all of the possible base
factors that are, by nature, confounded with other variables. From here, a Pareto plot can be drawn
to illustrate and distinguish particular insignificant factors in the model (Fig.3).
Fig. 3: Pareto chart of each effect tested
From employment of the Main Effects Principle I determined that all factors below the D*E
(windows*trunk) interaction in figure 3 have an insignificant effect on fuel efficiency and therefore
can be dropped from the model. This was affirmed by the decrease in P-value levels into an
acceptable range in the new model. This cut-off of factors deduces that the main effect of
5. V
2009 Ford Flex Fuel Efficiency
acceleration, controlling for mass, speed, windows, and trunk, is not significant. This proves to be
against my original engineering presumption and provides an interesting outcome of the
experiment. The increase in the model’s degrees of freedom, by decreasing the number of modeled
factors, allows for additional plots of residuals (Fig.5) to be constructed from a new Pareto plot
(Fig.4). These degrees of freedom were not obtained from repetition of runs because runs were
limited by time constraints to 16.
Fig. 4: Pareto chart of each standardized effect tested
Fig.5: Residual plots from experiment
6. VI
2009 Ford Flex Fuel Efficiency
This new data set produces a linear model approximating the significant factors’ influence on the
experiment’s response, fuel efficiency. The effects of such factors are with respect to coded binary
units, which can be un-coded using figures 1-2:
Efficiency = 11.688 + 0.813A + 1.563B + 0.688D - 0.688E - 0.688(A*D)
+ 1.062(B*D) + 0.937(B*E) - 0.688(D*E)
It should be noted that these factors are technically confounded with other factors, from the
generator of the half fraction design, as follows:
A + BCDE B + ACDE D +ABCE E + ABCD
AD + BCE BD + ACE BE + ACD DE + ABC
Due to this constraint in a fractional factorial designed experiment, any conclusions drawn from the
linear model must be understood to be non-exact and respectful of the possibility of their aliased
partner. Considering this, the accuracy in my model is emphasized because no significant factors
are confounded with one another.
Interpretation
The immediate conclusion from the formulated model is done so by evaluating the sign of the
coefficients. This concludes that in order to maximize the fuel efficiency, by nature of the measurement
taken for fuel efficiency as liters/100km, one should in fact minimize the response of efficiency. To do
this, based on the graphs produced for each factor (Fig.6), one should look to employ low mass, low
speed, open windows, and closed trunk conditions while driving. The factor of acceleration was shown
to be insignificant. It is also clear from figure. 4 & 6 that the most influential effect on fuel efficiency,
out of the factors tested, is the speed of the vehicle.
Fig. 6: Effects of significant factors tested
Before any of the outcomes or suggestions from this report are practically considered it should
be made very clear that the residuals produced from this latest model suggest to be themselves non-
normally distributed. This is revealed by the histogram and distribution plot of residuals in figure 5,
and can be resolved by performing a transformation on the response, Y. A transformation of ln(Y)
7. VII
2009 Ford Flex Fuel Efficiency
on the response produces a new factor effect distribution (Fig.7), a new linear model of fuel
efficiency, and ultimately a normally distributed residual distribution plot.
Fig. 7: Pareto chart of transformed effects tested
Nonetheless, for the scope of this report it was instructed to remain with the original model of fuel
efficiency with non-normally distributed residuals. In a practical viewpoint, this oversight would
cause any conclusions drawn from this model to be erroneous. From the set of residual graphs, it is
exposed that the residuals are independent of response using the Versus Fit plot (Fig.5). The Versus
Order plot illustrates that possibly the residuals (error of fitted values) may be decreasing with
experimental runs. This could be due to many explanations, although some can be ruled out as
precautions were taken to limit these effects. This included giving the vehicle ample time to warm
up along with driving and measurement practice prior to the first run. Also, reference to appendix C
and figure 5 indicates that the number of external vehicles passing by during each experimental run
failed to produce significant outliers in the data set.
In reference to the linear model we are confident in our produced effects of each significant
factor because the factors are independent through the use of the factorial design of experiments.
With respect to the model for ‘Efficiency’ a response surface method can be introduced to gain a
suggestion for future experiments when further increases in fuel efficiency are desired. In order to
obtain a basis for constructing a future suggestion, a baseline value of fuel efficiency produced by
each factor’s baseline values had to be attained. From here, factor’s effects on the response were
obtained through the model’s coefficients or partial differentiation. These represent the change in
fuel efficiency with a single coded unit change in the respective main factor while all other factors
are held constant. This allows me to design a suggestion of at least four further experimental runs
(Fig.8).
8. VIII
2009 Ford Flex Fuel Efficiency
Fig. 8
Based on the calculations of efficiency, the fuel efficiency in the model tested (L/100km) was
sought to be minimized. This requires the coded unit changes in factors A, B, and D to be a
negative value with respect to figure 6. In comparison, the E factor should be a positive value, and
actually remain constant since it is a binary variable. Also, since acceleration has been found to be
insignificant to the model, its value can be arbitrary and should be chosen as a low value since
higher accelerations are in practice hard to control and perform. It is also necessary to understand
that practical limits on each factor exist during experimentation and thus the size of each change
was altered by a fraction (10, 20, or 30%) to accommodate these ceilings. By following this
suggested plan of future experimental runs on the response surface, an even better response will be
predicted using this sequential experimentation suggestion. Following the performance of such runs
evaluating responses should lead to another response surface experiment being designed based on
where and when the present model becomes inadequate. This would then lead to possible non-
linear terms being added to the model to increase accuracy in its fit to the actual fuel efficiency
exhibited. This could be done using a central composite design.
Conclusion
After optimally designing and performing a half fraction factorial design on five factors of fuel
efficiency of a 2009 Ford FlexTM
a linear model can be produced to approximate the contributing
factor’s effect on fuel efficiency. From this model it is shown that the significant contributing
factors to fuel efficiency are most probably mass, speed, window openness, and the trunk being
open or closed. Emerging from this, an improved fuel efficiency is established when the mass is
low, speed is low, windows are open, and the trunk is closed. These and all other conclusions
drawn from the non-transformed response are acceptably erroneous and in future practice the
employment of a response transformation should be used to normalize the distribution of the
model’s residuals.