Call Girls in Sarai Kale Khan Delhi 💯 Call Us 🔝9205541914 🔝( Delhi) Escorts S...
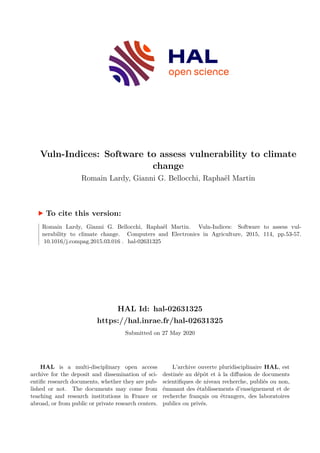
Vulnerability Indices Software.pdf
1. HAL Id: hal-02631325
https://hal.inrae.fr/hal-02631325
Submitted on 27 May 2020
HAL is a multi-disciplinary open access
archive for the deposit and dissemination of sci-
entific research documents, whether they are pub-
lished or not. The documents may come from
teaching and research institutions in France or
abroad, or from public or private research centers.
L’archive ouverte pluridisciplinaire HAL, est
destinée au dépôt et à la diffusion de documents
scientifiques de niveau recherche, publiés ou non,
émanant des établissements d’enseignement et de
recherche français ou étrangers, des laboratoires
publics ou privés.
Vuln-Indices: Software to assess vulnerability to climate
change
Romain Lardy, Gianni G. Bellocchi, Raphaël Martin
To cite this version:
Romain Lardy, Gianni G. Bellocchi, Raphaël Martin. Vuln-Indices: Software to assess vul-
nerability to climate change. Computers and Electronics in Agriculture, 2015, 114, pp.53-57.
�10.1016/j.compag.2015.03.016�. �hal-02631325�
2. Application note
Vuln-Indices: Software to assess vulnerability to climate change
R. Lardy 1
, G. Bellocchi ⇑
, R. Martin
Grassland Ecosystem Research Unit, French National Institute for Agricultural Research (INRA), 5 chemin de, 6 Beaulieu, 63039 Clermont-Ferrand, France
a r t i c l e i n f o
Article history:
Received 5 December 2014
Received in revised form 23 March 2015
Accepted 24 March 2015
Keywords:
Climate change
Java
Vulnerability indices
a b s t r a c t
Vuln-Indices Java-based software was developed on concepts of vulnerability to climate change of agro-
ecological systems. It implements the calculation of vulnerability indices on series of state variables for
assessments at both site and region levels. The tool is useful because synthetic indices help capturing
complex processes and prove effective to identify the factors responsible for vulnerability and their rela-
tive importance. It is suggested that the tool may be plausible for use with stakeholders to disseminate
information of climate change impacts.
Ó 2015 Elsevier B.V. All rights reserved.
1. Introduction
Vulnerability is the degree to which a human or environmental
system is likely to experience harm before being damaged (Turner
II et al., 2003). Understanding what potentially unprecedented eco-
logical and climatic changes might do to human well-being and the
integrity and functioning of agro-ecosystems is perceived as a cen-
tral issue in a range of regional and national concerns (Ericksen,
2008). In climate change impact studies, in particular, vulnerability
indices are calculated from state variables characterising the sys-
tem under study and linked to a threshold or a baseline (Lardy
et al., 2014). These indices can be generated from simulations
under current and altered climate scenarios and used to provide
a description of the system performance under climate-change
induced hazards or locate vulnerable systems and regions. A line
of evolution of vulnerability studies is to enlarge the scale of study
(Frazier, 2012), as the complexity in modelling shifts towards
applications at progressively larger scales (e.g. Ewert et al., 2011).
Maps of vulnerability indices are thus often represented to move
from site-based to regional analyses (Metzger and Schröter,
2006; Metzger et al., 2006; Nelson et al., 2010).
To the best of our knowledge, freely available software solu-
tions are not available to compute vulnerability indices in custom
developed applications. This paper documents a novel software
tool (Vuln-Indices) based on vulnerability concepts from the
Intergovernmental Panel on Climate Change (IPCC, 2001) and
revised by Füssel and Klein (2006). In Section 2, details are pro-
vided about the metrics implemented in Vuln-Indices. Examples
are considered in Section 3 to illustrate the effectiveness of the
indices. Conclusions are drawn in Section 4, where the issue of vul-
nerability assessment is discussed in the context of current
research.
2. Vulnerability indices and software support
Lardy et al. (2014) reviewed the indices used in vulnerability
studies and proposed their utilization in climate change impact
assessments (Table 1).
Vuln-Indices Java-based software allows computing vulnerabil-
ity indices of Table 1 (with an option to extend them) from series of
state variables (e.g. time series of simulated annual yields). The tool
is meant to perform vulnerability assessment on agro-ecological
systems, such as crop and grass-based production systems. Input
data contain yearly series of impact variables characterising the
system (primary production, harvested yield, etc.), generally
obtained via model-based simulations under alternative climate
forcing conditions. The main Graphical User Interface (GUI) is
based on SWING (http://docs.oracle.com/javase/7/docs/technotes/
guides/swing) and JFreeChart libraries (http://www.jfree.org/jfree-
chart/) using platform-independent Java language to allow users to
load and visualize the input data, as well as display and export out-
puts in the form of summary tables, histograms and radar scores
(Fig. 1). The data formats of input (I) and output (O) files supported
are CSV and NetCDF, with export capabilities in Excel and PDF
formats.
Comma Separated Values (CSV) is a simple, widely supported
(by almost all spreadsheet software and database management
http://dx.doi.org/10.1016/j.compag.2015.03.016
0168-1699/Ó 2015 Elsevier B.V. All rights reserved.
⇑ Corresponding author. Tel.: +33 4 73624866; fax: +33 4 73624457.
E-mail addresses: romain.lardy@toulouse.inra.fr (R. Lardy), gianni.bellocchi@
clermont.inra.fr (G. Bellocchi), raphael.martin@clermont.inra.fr (R. Martin).
1
Current address: UMR 5505 IRIT, CNRS, University of Toulouse, 31062 Toulouse,
France and UMR 1248 AGIR, INRA-INPT, 31326 Castanet-Tolosan, France.
Computers and Electronics in Agriculture 114 (2015) 53–57
Contents lists available at ScienceDirect
Computers and Electronics in Agriculture
journal homepage: www.elsevier.com/locate/compag
3. systems) file format. CSV files are meant for site-specific vulnera-
bility assessment. In this case, different sets of projection data
can be used to take into account different uncertainty sources
(e.g. alternative climate models or downscaling methods), the user
being enabled to set weighting factors for expressing the relative
probability of each feature at each location.
To facilitate moving from site-based to regional analyses, we
use NetCDF file for pixel-based assessments covering large regional
areas. The NetCDF (Network Common Data Form, http://www.uni-
data.ucar.edu/software/netcdf) binary format is a self-describing,
compact binary format, used to store and distribute large volumes
of data in machine-independent way. The NetCDF files also include
embedded information on the spatial grid, making explicit the time
dimension (other than latitude and longitude) as well as the units
of the gridded variables. A large set of software tools and languages
(e.g. R, Matlab, Java, C++) have libraries or packages to treat this
format, which is used for global and regional simulations provided
for the Fifth Assessment Report (AR5) of the IPCC (Williams et al.,
2009). NetCDF is already widely used in the community of spatial
modelling because it is suitable to handle with pixel-wise data
acquired over a defined geographical area. The result of the
pixel-based rendering can be displayed in maps of vulnerability
indices, as generated by using applications which plot geo-gridded
arrays.
One single JAR file is freely distributed together with a file
documenting the indices, software design and use.
3. Illustrative cases
The numerical examples provided here refer to simulations of
European grasslands using the Pasture Simulation model (PaSim,
Fig. 1. Screenshot of the Vuln-Indices user interface.
54 R. Lardy et al. / Computers and Electronics in Agriculture 114 (2015) 53–57
4. Ben Touhami et al., 2013; Ma et al., 2015), which is engineered for
distributed computing to meet the needs of high-resolution regio-
nal simulations (Vital et al., 2013).
3.1. Site-specific assessment
Table 2 reports four vulnerability indices calculated upon grass-
land yields (harvested dry biomass) per year obtained at a low pro-
ductivity upland permanent pasture in France (Theix; 45°430
North, 03°010
East, 850 m a.s.l.) for three 30-year time horizons
(extracted from a simulation from 1970 to 2099), representative
of near past (1970–1999), near future (2020–2049) and far future
(2070–2099). The hourly weather data used to force the model
were from the SRES-A2 storyline, which envisages high emissions
of greenhouse gases as a result of continuous population growth
and regionally-oriented economic development (IPCC, 2000). To
quantify the probability for the grassland system to incur poten-
tially hazardous climate events, precipitation and temperature
hazardous events in each year were quantified via an agro-climatic
metric of aridity, b P 0, arid conditions being represented by small
values of b (after Diodato and Ceccarelli, 2004). The results show
that the overall mean annual yield may increase with climate
change. However, a greater chance of exposure to heat and drought
stress (shift towards lower b values) may also lead to higher inter-
annual variability (higher standard deviation of yields). The vul-
nerability indices are presented as both absolute and relative
changes with respect to the baseline (time slice 1970–1999). A
relative value greater than one is indicative of higher expected vul-
nerability for adverse climate effects in the future, while a value
less than one provides the clue to less vulnerability. Due to the
specific construction of the Luers-based index, this normalisation
also makes it independent on the threshold setting.
Different vulnerability indices offer complementary insights
into the system yet with contrasting views of vulnerability.
According to both proportional vulnerability and vulnerability
gap (relative values lower than one), the probability for the grass-
land yields to go down below the threshold value is lower in the
future because the distance to the threshold is higher in the past.
Vulnerability severity reflects a more complex pattern (relative
value lower than one in the near future, higher than one in the
far future) depending on the distribution of all of the distances to
the threshold. However, in the metrics used by these indices, there
is no analytical expression of the sensitivity of the state variable to
a change in the climatic hazard. When the sensitivity factor is
taken into account (as reflected in the inter-annual variability of
climate conditions), as in the Luers-based index, conditions of
higher vulnerability are disclosed (relative values higher than
one) due to the expectation of more severe aridity conditions in
the future.
3.2. Regional assessment
The example sketched in Fig. 2 shows the spatial pattern of
Luers-based vulnerability index, as obtained by using freeware
Panoply Data Viewer (DataONE, 2014). The index was calculated
for 2070–2099 on the harvested dry biomass estimated for three
intensification scenarios in Europe according to SRES-A1B story-
line, in which current trends in emissions continue leading to a
doubling in CO2 levels by the end of the 21th century (IPCC,
2000). The simulations (based on a protocol established in the
frame of EU-FP7 GHG-Europe, http://www.ghg-europe.eu) were
run on 170 278 grid points at 0.25 0.25° resolution, spamming
from 29.125 to 71.375 latitude North and from 23.875 longitude
West to 45.375 longitude East. In some pixels, the index was not
calculated (e.g. in some Spanish regions) as the simulated biomass
was not sufficient to initiate a harvest. The maps also show the
importance of management to influence the vulnerability of grass-
lands to climate change.
Overall, the IPCC SRES A1B climate change projections to the
end of the 21st century are shown to reduce the vulnerability of
intensively managed European grasslands (Fig. 2C). The results
obtained suggest instead that an increased vulnerability is on aver-
age expected with intermediate level of management (Fig. 2B). It is
also interesting to see the pattern of regional variations. For
instance, climate change is likely driving grassland systems with
intermediate management into more vulnerable conditions in a
noticeable portion of western France.
Table 1
Vulnerability indices implemented in Vuln-Indices.
Index Equation Description Source
Proportional vulnerability V0 ¼ q
n
It corresponds to the ratio of vulnerable individuals to total individuals in a population
(e.g. the proportion of years over a period of time in which agricultural production is
below the threshold)
Foster et al. (1984)
Vulnerability gap V1 ¼ 1
n
Pq
t¼1
W0 Wt
W0
In a population of individuals, it represents the mean proportion of deficit of vulnerable
individuals from the value selected as threshold (e.g. the difference from the threshold of
below-the-threshold annual production values over a number of years)
Foster et al. (1984)
Vulnerability severity
V2 ¼ 1
n
Pq
t¼1
W0 Wt
W0
2 In a population of individuals, it represents the mean proportional distance of vulnerable
individuals from the threshold. The quadratic distance to threshold is used, which gives
more weight to the most vulnerable cases, i.e. the greater the vulnerability is skewed
towards the most vulnerable case (e.g. the least productive year) the greater is the
severity
Foster et al. (1984)
Most vulnerable individual V1 ¼ 1 minðWt Þ
W0
It is the distance from one of the ratio of the state of the most vulnerable case (e.g. the
least productive year) to the threshold.
Lardy et al. (2012)
Luers-based VL ¼ dW=dX
W=W0
It accounts for the sensitivity of the system to a stress factor (e.g. changes of agricultural
production with aridity conditions), with respect to a given state. The coefficient of
variation calculated over a series of states (e.g. a time series of agricultural production
values) is adopted here to represent sensitivity (after Lardy et al., 2014)
Luers et al. (2003)
q, number of vulnerable individuals (e.g. number of vulnerable years).
n, population size of individuals (e.g. number of years).
W, average state of the system over a time period (e.g. mean agricultural production over a number of years).
Wt, state of the system at time t (e.g. agricultural production at a given year).
W0, threshold value of the state of the system (e.g. agricultural production below which the system is considered vulnerable).
dW, variation of the state of the system over a time period (e.g. variability of agricultural production over a number of years).
dX, variation of a climate exposure factor over a time period (e.g. variability of aridity conditions over a number of years).
R. Lardy et al. / Computers and Electronics in Agriculture 114 (2015) 53–57 55
5. 4. Conclusions
We proposea softwaretooltosupport quantitative(index-based)
assessments of vulnerability to climate change (even if the tool is
generic enough to be used for other assessments of vulnerability
on virtually any kind of systems). Providing usable values of
synthetic indices, the approach allows performing model-based
inference of agro-ecological systems vulnerability to a variety of cli-
mate forcing scenarios, and can be complementary to probability
risk analyses (van Oijen et al., 2013, 2014). The approach proposed
seeks to combine an index-based scheme with computer-based
simulationmodelling, both being part of a deliberative process in cli-
mate change studies (e.g. Rivington et al., 2007; Bellocchi et al.,
2015). In fact, the latter is a useful means of providing new informa-
tion to stakeholders (land managers and decision makers) about
vulnerability to climate change and generating dialogue around its
interpretation. With synthetic indices there is the trade-off between
the level of detail provided by climate and impact models under sets
of conditions and timeliness for decision-making. Integrating the
presentation of spatially refined gridded maps with sensitivity to
climate, they may support the communication flow of the vulnera-
bilities and the co-construction of knowledge among scientists and
stakeholders (Rivington et al., 2013).
The results presented here are illustrative and, as such are not
meant as conclusive findings on the vulnerability of European
grasslands. These results, not accounting for the many sources of
uncertainties associated with grassland management, emission
scenarios, climate and impact modelling, are exemplary of the type
of achievement that can be attained in vulnerability analysis based
on the use of synthetic indices on both site-specific and regional
perspectives. Further developments on model-based vulnerability
analyses are certainly needed. The investigation should be
extended to the recent scenarios used by the 5th IPCC Assessment
Report (IPCC, 2013), while covering the pattern of services (not only
marketable yield) provided by agro-ecological systems (thus
identifying the vulnerabilities to each service). This kind of action
is ongoing, in interaction with stakeholders, under the guidance
and conditions laid down by the EU-FP7 project AnimalChange
(Bellocchi et al., 2013), and other initiatives aiming at assembling
Vuln-Indices and other tools for vulnerability assessment, and auto-
mate their linking to high-performance computing tools (Bellocchi
et al., 2014).
Software availability
Name of Software: Vuln-Indices
Developer: Raphaël Martin
Contact Address: INRA, UR0874 Grassland Ecosystem Research,
63039 Clermont-Ferrand, France
Tel.: +33 4 73624872
E-mail: raphael.martin@clermont.inra.fr
Availability: On request to the authors
Cost: free for no-profit use
Program language: Java
Table 2
Grassland yields estimated over three time horizons: climate exposure (mean aridity conditions), mean and standard deviation, and vulnerability indices (threshold yield set
equal to 5 t DM ha1
).
Period Mean yield Standard deviation Mean aridity index (b)*
Vulnerability indices
t DM ha1
Proportional
vulnerability
Vulnerability gap Vulnerability
severity
Luers-based
Absolute Relative Absolute Relative Absolute Relative Absolute Relative
1970–1999 4.25 0.57 29.10 0.866 – 0.157 – 0.034 – 0.158 –
2020–2049 4.62 0.75 27.50 0.733 0.846 0.101 0.643 0.024 0.686 0.176 1.114
2070–2099 4.45 0.81 16.50 0.733 0.846 0.130 0.828 0.036 1.052 0.205 1.297
*
b ¼ 1
2 PY
TY þ10 þ pa
Ta þ10
(De-Martonne, 1942): PY: yearly precipitation total (mm), YY: mean annual temperature (°C), pa: precipitation total of the driest month (mm), Ta:
mean temperature of the driest month (°C).
extensive intensive
intermediate
Fig. 2. Luers-based vulnerability index for harvested dry biomass in far future (2070–2099) for: (A) extensive management, (B) intermediate management and (C) intensive
management. Index values were normalised over the reference period (1980–2009). Each pixel value is a three-pixel depth average, i.e. the average across 25 pixels, weighted
as follows: 0.5 the pixel of interest, 0.3 the eight nearest ones, 0.2 the other 16 pixels (details provided by Lardy (2013), p. 154).
56 R. Lardy et al. / Computers and Electronics in Agriculture 114 (2015) 53–57
6. Acknowledgements
Vuln-Indices Java-based software was developed with funding
from the European Community’s Seventh Framework Programme
(FP7/2007-2013) under the Grant agreement No. 266018
(AnimalChange). It was also supported by the research grant
(Bourse Recherche Filière) of the region Auvergne of France (financed
by the European Regional Development Fund), within the frame of
an international research project named ‘‘FACCE MACSUR –
Modelling European Agriculture with Climate Change for Food
Security, a FACCE JPI knowledge hub’’. Claude Mazel (Blaise Pascal
University, LIMOS, Aubière, France) is acknowledged for his support.
References
Bellocchi, G., Lardy, R., Martin, R., 2013. The European pasture sensitivity to climate
change. AnimalChange E-Newsletter, November 2013. http://www.
animalchange.eu/docs/newsletter_Nov2013.pdf (accessed 22.03.2015).
Bellocchi, G., Martin, R., Shtiliyanova, A., Ben Touhami, H., Carrère, P., 2014. Vul’Clim
– Climate change vulnerability studies in the region Auvergne (France). FACCE
MACSUR Mid-term Scientific Conference, ‘‘Achievements, Activities,
Advancement’’, April 01-04, Sassari, Italy http://ocs.macsur.eu/index.php/
Hub/Mid-term/paper/view/209/15 (accessed 22.03.2015).
Bellocchi, G., Rivington, M., Matthews, K., Acutis, M., 2015. Deliberative processes
for comprehensive evaluation of agroecological models. A review. Agronomy
Sustain. Dev. 35, 589–605.
Ben Touhami, H., Lardy, R., Barra, V., Bellocchi, G., 2013. Screening parameters in the
Pasture Simulation model using the Morris method. Ecol. Model. 266, 42–57.
DataONE, 2014. Panoply data viewer. Data Observation Network for Earth,
Albuquerque, NM. http://www.dataone.org/software-tools/panoply-dataviewer
(accessed 22.03.2015).
De Martonne, E., 1942. Nouvelle carte mondiale de l’indice d’aridité. Annales de
Géographie 51, 242–250 (in French).
Diodato, N., Ceccarelli, M., 2004. Multivariate indicator Kriging approach using a GIS
to classify soil degradation for Mediterranean agricultural lands. Ecol. Indic. 4,
177–187.
Ericksen, P.J., 2008. What is the vulnerability of a food system to global
environmental change? Ecol. Soc. 13, 14.
Ewert, F., van Ittersum, M.K., Heckelei, T., Therond, O., Bezlepkina, I., Andersen, E.,
2011. Scale changes and model linking methods for integrated assessment of
agri-environmental systems. Agr. Ecosyst. Environ. 142, 6–17.
Foster, J., Greer, J., Thorbecke, E., 1984. A class of decomposable poverty measures.
Econometrica 52, 761–766.
Frazier, T.G., 2012. Selection of scale in vulnerability and resilience assessments. J.
Geogr. Nat. Disasters 2, e108.
Füssel, H.-M., Klein, R.J.T., 2006. Climate change vulnerability assessments: an
evolution of conceptual thinking. Clim. Change 75, 301–329.
IPCC, 2000. A1 Storyline and Scenario Family. In: Nakičenovič, N., Swart, R. (Eds.),
Summary for Policymakers, Intergovernmental Panel of Climate Change,
Geneva. http://www.ipcc.ch/ipccreports/sres/emission/index.php?idp=93
(accessed 22.03.2015).
IPCC, 2001. Climate change 2001: impacts, adaptation, and vulnerability. Third
Assessment Report of the Intergovernmental Panel on Climate Change.
Cambridge University Press, Cambridge, United Kingdom, 1032 p.
IPCC, 2013. IPCC 5th Assessment Report Climate Change 2013: the Physical Science
Basis. University Press, Cambridge, UK. http://www.ipcc.ch/report/ar5/wg1/#.
Uk7O1xBvCVq (accessed 22.03.2015).
Lardy, R., 2013. Calcul intensif pour l’évaluation de la vulnérabilité en utilisant une
approche d’Ingénierie Dirigée par les Modèles. Application à la vulnérabilité des
prairies au changement climatique sous contraintes de plans d’expériences.
PhD thesis, Blaise Pascal University, Clermont-Ferrand, France, p. 258. (in
French).
Lardy, R., Martin, R., Bachelet, B., Hill, D., R., C., Bellocchi, B., 2012. Ecosystem climate
change vulnerability assessment framework. In: Seppelt, R., Voinov, A.A., Lange,
S., Bankamp, D. (Eds.), Proceedings of the International Environmental
Modelling and Software Society (iEMSs) 2012 International Congress on
Environmental Modelling and Software. Managing Resources of a Limited
Planet: Pathways and Visions under Uncertainty, Sixth Biennial Meeting, 1–5
July, Leipzig, Germany. pp. 777–784.
Lardy, R., Bachelet, B., Bellocchi, G., Hill, D.R.C., 2014. Towards vulnerability
minimization of grassland soil organic matter using metamodels. Environ.
Model. Softw. 52, 38–50.
Luers, A.L., Lobell, D.B., Sklar, L.S., Addams, C.L., Matson, P.M., 2003. A method for
quantifying vulnerability, applied to the agricultural system of the Yaqui Valley,
Mexico. Global Environ. Change 13, 255–267.
Ma, S., Lardy, R., Graux, A.-I., Ben Touhami, H., Klumpp, K., Martin, R., Bellocchi, G.,
2015. Regional-scale analysis of carbon and water cycles on managed grassland
systems. Environ. Model. Softw. http://dx.doi.org/10.1016/j.envsoft.2015.
03.007.
Metzger, M.J., Schröter, D., 2006. Towards a spatially explicit and quantitative
vulnerability assessment of environmental change in Europe. Regional Environ.
Change 6, 201–216.
Metzger, M.J., Rounsevell, M.D.A., Acosta-Michlik, L., Leemans, R., Schröter, D., 2006.
The vulnerability of ecosystem services to land use change. Agr. Ecosyst.
Environ. 114, 69–85.
Nelson, R., Kokic, P., Crimp, S., Martin, P., Meinke, H., Howden, S.M., 2010. The
vulnerability of Australian rural communities to climate variability and change:
Part II-integrating impacts with adaptive capacity. Environ. Sci. Policy 13, 18–
27.
Rivington, M., Matthews, K.B., Bellocchi, G., Buchan, K., Stöckle, C.O., Donatelli, M.,
2007. An integrated assessment approach to conduct analyses of climate change
impacts on whole-farm systems. Environ. Model. Softw. 22, 202–210.
Rivington, M., Matthews, K.B., Buchan, K., Miller, D.G., Bellocchi, G., Russell, G., 2013.
Climate change impacts and adaptation scope for agriculture indicated by
agrometeorological metrics. Agr. Syst. 114, 15–31.
Turner II, B.L., Kasperson, R.E., Matson, P.A., Mccarthy, J.J., Corell, R.W., Christensen,
L., Eckley, N., Kasperson, J.X., Luers, A., Martello, M.L., Polsky, C., Pulsipher, A.,
Schiller, A., 2003. A framework for vulnerability analysis in sustainability
science. In: Proceedings of the National Academy of Sciences of the United
States of America 100, pp. 8074–8079.
Van Oijen, M., Beer, C., Cramer, W., Rammig, A., Reichstein, M., Rolinski, S., Soussana,
J.-F., 2013. A novel probabilistic risk analysis to determine the vulnerability of
ecosystems to extreme climatic events. Environ. Res. Lett 8, 015032.
Van Oijen, M., Balkovič, J., Beer, C., Cameron, D., Ciais, P., Cramer, W., Kato, T.,
Kuhnert, M., Martin, R., Myneni, R., Rammig, A., Rolinksi, S., Soussana, J.-F.,
Thonicke, K., Van der Velde, M., Xu, L., 2014. Impact of droughts on the C-cycle
in European vegetation: a probabilistic risk analysis using six vegetation
models. Biogeosci. Discuss. 11, 8325–8371.
Vital, J.-A., Gaurut, M., Lardy, R., Viovy, N., Soussana, J.-F., Bellocchi, G., Martin, R.,
2013. High-performance computing for climate change impact studies with the
Pasture Simulation model. Comput. Electron. Agr. 98, 131–135.
Williams, D.N., Ananthakrishnan, R., Bernholdt, D.E., Barathi, S., Brown, D., Chen, M.,
Chervenak, A.L., Cinquini, L., Drach, R., Foster, I.T., Fox, P., Fraser, D., Garcia, J.,
Hankin, S., Jones, P., Middleton, D.E., Schwidder, J., Schweitzer, R., Schuler, R.,
Shoshani, A., Siebenlist, F., Sim, A., Strand, W.G., Su, M., Wilhelmi, N.C., 2009.
The Earth System Grid: enabling access to multimodel climate simulation data.
Bull. Am. Meteorol. Soc. 90, 195–205.
R. Lardy et al. / Computers and Electronics in Agriculture 114 (2015) 53–57 57