SlideShare a Scribd company logo
1 of 184
1
YOTTA DESIGNS, INC.
Natural Gasoline Expansion
Natural Gasoline to LPG and Sales Gas
Curtis Edwards, Michael Polmear, Mark Colbenson
CHEN 4530: Senior Design
Professor Clough
Mr. Sean Arendell – URS
5/5/2010
Wellhead
Gas
Outlet
Water
Outlet
Water
Oil
Oil
Inlet
Divertor
Mist
Extractor
Oil
Outlet
Baffle
Liquid
Level
Control
Figure 1 Three Phase Inlet Separator to Initiate the Magic (1).
Yotta Designs CHEN 4530 Senior Design Project May 5, 2010
2
Table of Contents
Executive Summary.........................................................................................................................6
Project Description and Scope ........................................................................................................7
Problem Statement ......................................................................................................................7
Scope ...........................................................................................................................................8
Design Criteria..............................................................................................................................9
Wellhead Conditions.................................................................................................................9
Wellhead Flow Rate to Facility ...............................................................................................11
Gas Re-Injection .....................................................................................................................11
Pipeline Gas Production Specifications .................................................................................12
Minimum Air Temperature Constraints ..................................................................................12
Product Specifications............................................................................................................12
Economic Considerations.......................................................................................................13
Background Information.................................................................................................................13
The Yamal Megaproject.............................................................................................................13
Definitions...................................................................................................................................15
Natural Gas Processing.............................................................................................................16
Alternatives to the Proposed Process........................................................................................18
Dehydration.............................................................................................................................19
Heat Integration ......................................................................................................................21
Column Optimization ..............................................................................................................22
Refrigeration Cycle .................................................................................................................22
Recycle Operators..................................................................................................................23
Safety, Environmental, and Health Considerations ......................................................................23
Plant Safety (16).........................................................................................................................23
Environmental Concerns (16) ....................................................................................................24
MSDS Summaries......................................................................................................................25
Natural Gasoline (17)..............................................................................................................25
Liquefied Petroleum Gas (18) ................................................................................................26
Natural Gas (19) .....................................................................................................................26
Triethylene Glycol (20) ...........................................................................................................27
Yotta Designs CHEN 4530 Senior Design Project May 5, 2010
3
Project Premises and Corresponding Simulation Parameters......................................................27
Design Assumptions ..................................................................................................................28
Economic Assumptions..............................................................................................................29
Overall Process Flow Diagrams ....................................................................................................29
Natural Gasoline Process Flow Diagrams.................................................................................29
Natural Gasoline Expansion Process Flow Diagram ................................................................31
Process Descriptions .....................................................................................................................33
Inlet Separation and Natural Gasoline Recovery ......................................................................33
Natural Gasoline PFD.............................................................................................................33
Natural Gasoline Expansion PFD...........................................................................................33
Approach.................................................................................................................................34
Triethylene Glycol Dehydration..................................................................................................36
Triethylene Glycol Dehydration PFD......................................................................................36
Approach.................................................................................................................................37
Propane Refrigeration Cycle......................................................................................................38
Propane Refrigeration Cycle PFD..........................................................................................38
Approach.................................................................................................................................39
Sales Gas and LPG Recovery...................................................................................................40
PFD.........................................................................................................................................40
Approach.................................................................................................................................41
Material and Energy Balances.......................................................................................................43
Material and Energy Balances...................................................................................................43
Natural Gasoline Process Balances.......................................................................................43
Expansion Process Balances.................................................................................................45
Process Description & Equipment Specifications .........................................................................50
Distillation Columns....................................................................................................................51
Estimating Column Pressure and Condenser Type...............................................................51
Calculating Number of Trays..................................................................................................53
Determining the Dimensions of the Distillation Columns.......................................................54
Distillation Column Costing.....................................................................................................58
Flash Drums...............................................................................................................................59
Three-Phase Separator..........................................................................................................59
Yotta Designs CHEN 4530 Senior Design Project May 5, 2010
4
Flash Drums............................................................................................................................61
Heat Exchangers........................................................................................................................62
Design of the Heat Exchangers..............................................................................................63
Pumps ........................................................................................................................................67
Compressors..............................................................................................................................67
Valves.........................................................................................................................................70
Storage Tank..............................................................................................................................71
Utility Summary..............................................................................................................................72
Estimation of Capital Investment and Total Product Cost ............................................................77
Economic Premises ...................................................................................................................77
Venture Guidance Appraisal ..................................................................................................77
Variable Costs.........................................................................................................................78
Fixed Costs.............................................................................................................................79
Cash Flow...............................................................................................................................79
Capital Investment .....................................................................................................................80
Cost Indices ............................................................................................................................80
Commodity Chemicals............................................................................................................81
Total Permanent Investment (TPI) .........................................................................................81
Working Capital (WC).............................................................................................................91
Operating Cost...........................................................................................................................91
Variable Cost ..........................................................................................................................92
Fixed Cost...............................................................................................................................95
Profitability Analysis.......................................................................................................................99
Profitability................................................................................................................................ 100
Cost of Capital ...................................................................................................................... 100
Net Present Value................................................................................................................. 100
Internal Rate of Return ......................................................................................................... 100
Return on Investment ........................................................................................................... 100
Break-Even Point.................................................................................................................. 101
Benefit-Cost Ratio................................................................................................................. 101
Depreciation.......................................................................................................................... 101
Salvage Percent ................................................................................................................... 102
Yotta Designs CHEN 4530 Senior Design Project May 5, 2010
5
Accounts Receivable............................................................................................................ 102
Corporate Income Tax.......................................................................................................... 102
Cash Flow Analyses ............................................................................................................. 102
Sensitivity Analysis................................................................................................................... 112
Present ROI and IRR for a +/- 100% Variation in TPI ......................................................... 112
Present ROI and IRR for a +/- 100% Variation in Fixed Operating Cost ............................ 113
Conclusion ...................................................................................................................................113
Bibliography .................................................................................................................................115
Appendix A: Acronyms................................................................................................................. 118
Appendix B: Chemical Information .............................................................................................. 120
LPG MSDS (18)............................................................................................................................ 120
Natural Gas MSDS (19)................................................................................................................ 124
Natural Gasoline MSDS ............................................................................................................... 130
Propane MSDS............................................................................................................................ 130
TEG MSDS (20)............................................................................................................................ 130
Appendix C: Engineering Calculations ........................................................................................ 137
Design ......................................................................................................................................137
Costing .....................................................................................................................................160
Natural Gasoline Process.....................................................................................................160
Natural Gasoline Expansion Plant Process ......................................................................... 164
Appendix D: Computer Process Modeling .................................................................................. 173
Aspen HYSYS.......................................................................................................................... 173
Appendix E: Economic Spreadsheets......................................................................................... 174
Total Capital Investment .......................................................................................................... 174
Natural Gasoline Process ........................................................................................................ 175
Natural Gasoline Expansion Plant ........................................................................................... 181
Yotta Designs CHEN 4530 Senior Design Project May 5, 2010
6
Executive Summary
Natural gas processing represents an opportunity to exploit natural resources to provide
energy sources for a profit. The Yamal Peninsula contains a significant and valuable reserve for
the Russian economy. The objective of this project was to design two processes that separate
natural gasoline from a natural gas wellhead. Whereas the first process re-injects the overhead
streams back into the well, the second process expands the initial process to negate re-injection
and instead separate the overhead products into sales gas and liquefied petroleum gas (LPG)
product streams. These products are nearly equal in value to natural gasoline, with selling
prices of $50/bbl and $55/bbl, respectively, as compared with natural gasoline at $80/bbl. Both
processes yield approximately 10,000 bpd of natural gasoline, a scaled-up value from the 2,500
bpd that were initially being produced.
Product specifications are stringent for safety and energetic quality purposes. Design
specifications ensure that machinery functions in the extreme climate encountered above the
Arctic Circle. All design and product specifications were met, including the mitigation of hydrate
formation. Plant safety and environmental considerations were characterized and deemed
achievable through diligent planning and adherence to local and federal laws.
The economics of the two processes were estimated for a 15-year plant lifetime with one
design year and two years of construction. In the following summaries, economic parameters of
the natural gasoline and re-injection process will precede those of the expansion process to
produce the additional product streams. The total permanent investments were $170,600k and
$36,600k, respectively. The expansion process equipment was designed to use the reinjection
process equipment, thus realizing significant savings in investment. The internal rates of return
with the aforementioned selling prices were 52% and 164%, respectively. The break-even
points were during the first year of operation, the startup year for both processes. The benefits-
cost ratios were 14 and 67, respectively. For these reasons, the expansion process presents
favorable profitability, assuming that the well capacity remains fruitful and the selling prices
remain competitive.
Several improvements to the process merit further consideration. Dehydration
technology exists to minimize the product water content if the specifications change upon
integration with the approaching pipeline. Each of the distillation columns contains a reboiler
and condenser that could be integrated into a heat exchange network that contains process
Yotta Designs CHEN 4530 Senior Design Project May 5, 2010
7
streams in an effort to reduce utility costs. The execution of the current design may be improved
by tightening convergence tolerances on columns and recycle functions.
Project Description and Scope
A plethora of natural gas reserves exist on and offshore of the Yamal Peninsula in
Northern Siberia, Russia. One of the clients of URS was initially recovering natural gasoline
from three wells on this peninsula, though due to the absence of a natural gas pipeline in the
area, they were flaring the excess natural gas. This client planned to expand their facility to
quadruple their production of natural gasoline, and initiate the recovery of liquefied petroleum
gas (LPG) and natural gas upon the imminent arrival of a natural gas pipeline. However, due to
the volatile nature of the Russian economy and the high cost of energy the client desired to
accomplish this expansion with minimal capital investment (2).
Problem Statement
Prior to the facility expansion project the client was producing natural gasoline from the
three remote wells. These wells are located far above the Arctic Circle on the Yamal Peninsula
in Northwestern Russia. There is little infrastructure in place in the area, and the natives sustain
themselves by hunting and fishing. The facility was producing approximately 2,500 BPD of
natural gasoline and burning all of the excess gas.
The expansions made to the facility were to consist of two phases. In the first, the
production of natural gasoline was to be increased to 10,000 BPD and the excess gas was to be
re-injected back into the reservoir instead of flared. As a natural gas pipeline was being routed
to the area and was to be in place within five years after the initiation of the expansion, the
second phase was to consist of the modification of the existing facility to include extra
processing equipment to separate and produce LPG and pipeline-quality natural “sales” gas
from the previously re-injected gas.
The remote location of the facility necessitated the consideration of several additional
factors that affected the design of the gas processing plant modifications. The most notable of
these was the extremely cold winter temperatures experienced at the location of the plant. The
wellheads are located in a region where permafrost exists, so the wellhead pipelines were
routed aboveground on piers to avoid degradation of the permafrost, and the equipment had to
be designed to a -60 °F design temperature. Also, due to the fact that electric power was
Yotta Designs CHEN 4530 Senior Design Project May 5, 2010
8
unavailable at the site, natural gas engine-driven compressors were to be utilized for gas re-
injection. These were provided by Caterpillar, who has a presence in Siberia (2).
Scope
The first phase of the project was to involve the design of equipment to separate the
hydrocarbon liquids, water, and natural gas in the feed stream, to stabilize the hydrocarbon
liquids to shipping specifications, and to re-inject the residue gas back into the reservoir as
illustrated by the block flow diagram shown in Figure 2.
Inlet
Separation
C5+
Recovery
Hydrocarbons
Water
Overheads
Wellhead
Compression Re-Injection
C5+ $
-$
-$
Figure 2. Block flow diagram for natural gasoline production facility
This process is hereafter to be referred to as the natural gasoline process.
Subsequent to the arrival of the natural gas pipeline, the plant modifications were to
include equipment to dehydrate the gas, reduce its hydrocarbon dew point, and compress it for
delivery to the pipeline. From the initial plant configuration the design was to be made easily
convertible to production of pipeline-quality gas. The block flow diagram for the facility following
the second plant modification, hereafter to be referred to as the natural gasoline expansion
process or simply the expansion process is shown in Figure 3.
Yotta Designs CHEN 4530 Senior Design Project May 5, 2010
9
Inlet
Separation
C5+
Recovery
Hydrocarbons
Water
Overheads
Wellhead
Dehydration
C5+
Dry Gas
Water
LPG
Recovery
Sales Gas
LPG
C5+ Recycle
$
$
$
TEG
Compression
-$
-$
Refrigeration
HX
Cooled
Dry Gas
Propane
Figure 3. Block flow diagram for natural gasoline, sales gas, and LPG production (natural gasoline expansion
process)
The reduction in hydrocarbon dew point was to take place within the LPG recovery separation
train.
Additional requirements of the project included identifying and evaluating process
alternatives, identifying all the assumptions necessary for the design, and delineating the
requirements for the storage, shipping, and utility systems (2). Taken together, these factors
yielded a profitability analysis that favors expanding the process to produce sales gas and LPG.
DesignCriteria
The following criteria and specifications were provided for the gas processing facility
expansion (2).
Wellhead Conditions
The conditions at the wellhead and inlet of the process are given in Table 1.
Yotta Designs CHEN 4530 Senior Design Project May 5, 2010
10
Table 1. Process inlet conditions
Inlet Conditions
Wellhead Pressure
(bar g)
150
Wellhead Temperature
Range (°F)
20 - 50
Process Inlet
Pressure (bar g)
103
The wellhead compositions are listed in Table 2.
Table 2. Composition of the wellhead stream (excluding water)
Composition
Component Mole %
N2 0.405
CO2 0.305
CH4 86.121
C2H6 6.637
C3H8 2.484
iC4H10 0.359
nC4H10 0.415
C5+ 3.274
COS/CS2 0.0
H2S 0.0
For the 3.274 mol % of the wellhead stream that is composed of C5+, ASTM D86 data
were given, which is shown in Table 3. ASTM D86 is a standard distillation-based assay used to
characterize petroleum, in which the temperature is recorded at which successive fractions of
the oil mixture have evaporated.
Yotta Designs CHEN 4530 Senior Design Project May 5, 2010
11
Table 3. ASTM D86 oil characterization assay data of C5+ at wellhead
ASTM D86 Assay
Percent Evaporated
(% Liquid Volume)
Temperature
(°C)
Bubble Point 38.7
10 64.3
20 83.7
30 99.7
40 112
50 129
60 148.7
70 171.3
80 214.7
90 281
End Point 295
The data in Table 4 were also given for the C5+ content at the wellhead.
Table 4. Physical data for the C5+ at the wellhead
Natural Gasoline (C5+)
Density (g/cm3
) 0.731
Average MW (Da) 101
Wellhead Flow Rate to Facility
The gas flow rate from the wellhead was to be determined based on a natural gasoline
(C5+) standard production rate of approximately 10,000 BPD. The flow rate of water in the
wellhead was to be found based on 1.5 bbl of water produced for every MMSCF of gas flow
from the inlet separator.
Gas Re-Injection
Before the plant modifications for LPG and natural gas recovery were implemented, in
the first phase of the facility expansions, gas was to be re-injected into the well at a pressure of
180 bar g.
Yotta Designs CHEN 4530 Senior Design Project May 5, 2010
12
Pipeline Gas Production Specifications
After the facility expansion for the production of LPG and sales gas, in the second phase
of the project, the sales gas was specified to have a hydrocarbon dew point of not more than 0
°F at a pressure of 55 bar g.
Minimum Air Temperature Constraints
Owing to the frigid climate of the Siberian Yamal Peninsula the process and mechanical
design was to allow for a minimum air temperature of -60 °F. Furthermore, all equipment was to
be designed from low-temperature carbon steel impact tested to -65 °F. And finally, any air
coolers were to be designed for the use of air at 85 °F to account for the hottest ambient air
temperature that would likely be reached during the summer months.
Product Specifications
The criteria for the purity and production rate of natural gasoline were based on Reid
Vapor Pressure (RVP), a common measure of purity in the natural gas processing industry, and
standard flow rates, as illustrated in Table 5.
Table 5. Natural gasoline purity and flow rate product specifications
Natural Gasoline (C5+)
Max Reid Vapor Pressure (RVP in psia) 10
Min Standard Flow rate (BPD) 8,000
Design Standard Flow rate (BPD) 10,000
Max Standard Flow rate (BPD) 11,000
The LPG product was to be characterized as having a True Vapor Pressure (TVP) of 210 psia
at 100 °F, and a C5+ content of no more than 2.0% by volume.
Finally, the sales gas product specifications were to be based on Hydrocarbon (HC) dew
point, the temperature at which hydrocarbons begin condensing out of the gas, as well as the
CO2 and H2O content of the gas as shown in Table 6.
Yotta Designs CHEN 4530 Senior Design Project May 5, 2010
13
Table 6. Sales gas purity product specifications
Sales Gas (Natural Gas)
Max Hydrocarbon
Dew Point (°F)
0
Max CO2 Content
(Mole %)
2.0
Max H2O Content
(lbs/MMSCF)
4
Economic Considerations
The sales prices of each of the three products were given and tabulated in Table 7.
Table 7. Sales prices of products
Product Sales Prices
Sales Gas $50/bbl $1.19/US gal
LPG $55/bbl $1.31/US gal
Natural Gasoline $80/bbl $1.90/US gal
Also, the operating cost of gas re-injection was given as $1.50/1000 SCF, and the future gas
sales price was given as $4/MMBTU.
Background Information
In order to better understand the expansions that were to be made to the operating
natural gas processing facility it was useful to situate this expansion within the Russian
economic and political climate in the area, to research natural gas processing and the unit
operations that are utilized in the industry and the proposed process, and several processing
alternatives.
The Yamal Megaproject
Owing to the fact that the gas reservoir to be modified is located on the Yamal Peninsula
in Northern Siberia, Russian Federation, information on the nature of Russian gas reserves and
the economic and political climate in which the project will take place are relevant concerns.
Yotta Designs CHEN 4530 Senior Design Project May 5, 2010
14
Russia currently supplies one quarter of Europe’s natural gas, and plans to expand in this
market (3). However, over the last several years Russia has lost credibility with many of the
former Soviet Union countries and Europe as a reliable supplier of natural gas. In January of
2006 Russia cut off the gas supply to Ukraine and Moldova, and in late 2006 threatened to cut
supplies to Belarus and Georgia over pricing disputes (4). Then, again, in January of 2009,
fueled by ongoing political tensions between the two countries, Russia curtailed the flow of gas
through Ukraine during a particularly cold period of the winter, affecting in particular the Balkans
and Eastern Europe (3). These and other similar instances have encouraged some countries to
seek other sources of natural gas, and have incited criticism of Russia as using energy as a
political tool (4). However, petroleum and natural gas are vital to the Russian economy, and
Russia plans to further develop and expand the industry largely through the utilization of the
Yamal Peninsula. There are plans to increase production of natural gas from the peninsula by a
factor of almost 42 from 2011 to 2030, a reflection of the vast gas reserves present in the area
(5).
Russia owns approximately one third of the world’s gas reserves, which according to the
International Energy Agency consisted of 46.9 trillion cubic meters (tcm) of proven and probable
reserves at the beginning of 2001 (6). In the North Siberian Yamal Peninsula and adjacent
areas 11 gas and 15 oil, gas, and condensate fields have been discovered which contain
approximately 16 tcm of gas according to exploration and preliminary estimates. These fields
have even been projected to contain as much as 22 tcm of gas reserves (5). The majority of
these fields are owned and licensed to the corporation Gazprom, which is pursuing their
development under the ‘Yamal Megaproject.’
Gazprom is “one of the world’s largest energy companies,” and holds a monopoly in the
Russian gas market (5) (3). It is owned largely by the Russian government, though is a
privatized company which specializes in geological exploration, the production, transportation,
storage, processing, and marketing of hydrocarbons, and the marketing of heat and electric
power (5). In a 2007 initiative, Gazprom, in collaboration with the Yamal-Nenets Autonomous
Okrug (YaNAO) Administration, amended a 2002 draft program for the development of the
peninsula’s gas reserves with the aim of the expansion of the reserve fields and the construction
of gas pipelines on the Yamal Peninsula. The initiative plans for the launch of drilling at several
of the fields, the further development of the production capacities of the existing operational
fields, and the construction of a 2,500 km gas pipeline system. The company purports to be
taking into consideration the myriad environmental and social responsibility issues that the
Yotta Designs CHEN 4530 Senior Design Project May 5, 2010
15
project warrants including pollution concerns and the welfare of the indigenous people and
wildlife. Due to the fact that the Yamal Peninsula is the most explored region for gas
production, is located near existing gas pipelines, and has significant reserves, Gazprom
regards the Yamal Megaproject as central to the development of the Russian economy (5).
Definitions
There are three product streams from the proposed process, these being natural
gasoline, liquefied petroleum gas, and natural gas. Each of these distinct products requires
definition.
 Natural Gasoline (C5+) – Natural gasoline is a liquid product consisting of pentane, and
all of the hydrocarbons heavier than pentane. For the purposes of this project the purity
of this product stream is defined by a Reid Vapor Pressure of 10 psia at 100 °F, and its
temperature was to be as close to an upper limit of 400 °F as possible to meet common
shipping requirements (2).
 Liquefied Petroleum Gas (LPG) – LPG is a liquid product consisting primarily of propane,
n-butane, and isobutane. The purity specifications for this product are a maximum True
Vapor Pressure of 210 psia at 100 °F and a C5+ content of no more than 2.0 % by
volume (2).
 Natural Gas (Sales Gas) – Natural gas must meet certain quality specifications before
injection into a pipeline to ensure that the pipeline operates properly. Gas that does not
meet specification can lead to deleterious hydrate formation, operational problems in the
pipeline, pipeline deterioration, or even pipeline rupture (7). These quality measures
often include specifications on the energy content of the gas per volume, its hydrocarbon
dew point temperature, maximum levels of contaminants such as hydrogen sulfide,
carbon dioxide, nitrogen, water vapor, and oxygen, and maximum amounts of particulate
solids and liquid water, as these can damage the pipeline (7). For the expansion of the
relevant natural gas processing plant the quality measures required to be met included a
hydrocarbon dew point of no more than 0 °F, a CO2 content of no more than 2.0 mol %,
and a maximum water content of 4 lbs/MMSCF of gas (2).
Yotta Designs CHEN 4530 Senior Design Project May 5, 2010
16
Natural Gas Processing
Natural gas exists in a variety of forms, its composition depending on the type, depth,
and location of the deposit as well as the geology of the area in which it is tapped. Oil and
natural gas are often found in the same reservoir, and natural gas is classified as associated-
dissolved when dissolved in crude oil, or non-associated when it occurs in the absence of oil.
The relevant raw gas being gathered for the proposed process is non-associated. The raw gas
most often consists of two to eight carbon hydrocarbons that are gaseous at underground
pressures, though condense to liquid at atmospheric pressure. These liquids are called
condensates or natural gas liquids (NGLs). The recovery of NGLs can involve any of several
initial processing steps depending on the particular composition of the well (7).
Due to the myriad possible compositions of the raw gas, these initial processing steps
can be quite complex. Producing areas can contain hundreds of wells, from which gas and
NGL is “gathered” via small-diameter pipes that connect the well to processing facilities. At the
wellhead the gas is often put through scrubbers to remove sand and any particulate matter
and/or heaters to ensure that the temperature does not drop low enough for hydrates to form in
the stream.
Hydrates are crystalline, ice-like solids that form with the water vapor in the stream, and
can pose serious risks to the process, as they have the potential to clog the valves and pipes
that the gas passes through during processing, thus leading to dead-heads. They form within a
certain temperature/pressure envelope, oftentimes above the freezing point of water, the limits
of which are dependent on the composition of the stream. Therefore, the avoidance of hydrate
formation was a concern in the design of the proposed process.
The various streams gathered at a given site can require differing initial processing steps
including heating, compression, scrubbing, carbon dioxide removal, and sulfur removal,
contributing to the complexity of the gathering process. After these steps are taken, the further
processing steps that are commonly performed include, but are not limited to the following (7).
Gas-Oil Separation
When natural gas is associated with crude oil it is first necessary to separate the gas
from the oil. Oftentimes pressure relief at the wellhead alone accomplishes this separation, and
just a simple closed tank is required. However, sometimes a multi-stage separation train is
required, in which a series of cylindrical shell, horizontal tanks are commonly utilized. These
Yotta Designs CHEN 4530 Senior Design Project May 5, 2010
17
include an inlet at one end, and top and bottom outlets for gas and oil respectively. Separation
is effected by compressing and expanding the feed between tanks, causing heating and cooling
of the stream (7). As mentioned previously, the wellhead stream for the proposed process
consists of non-associated gas, eliminating the need for this step.
Condensate Separation
Condensate separation is most often accomplished through the use of mechanical
separators. It is at times preceded by a slug catcher to remove any free water from the
wellhead stream, and is usually employed when gas-oil separation is not required (7). In the
proposed process this step is carried out by the three phase separator unit.
Dehydration
It is necessary to remove any free water from the natural gas stream to avoid the
formation of hydrates in the process. The most common method of dehydration, and the one
employed in the proposed process, is absorption of water by glycol, though a variety of other
processes have been used, several of which will be discussed in the Alternatives to the
Proposed Process section. Triethylene glycol is the most common type of glycol used for this
purpose (7).
Contaminant Removal
Contaminants that must be removed during processing include hydrogen sulfide and
other sulfur-containing compounds, carbon dioxide, water vapor, helium, and oxygen. To
remove sulfurous compounds flow is often directed through a tower containing a solution of
amines. The amines absorb sulfur compounds from the gas stream, and have the advantage of
being able to be used repeatedly. Desulfurization can then be followed by a series of filter tubes
where gravity, centrifugal force, and flocculation of particulates elicit the removal of other stream
contaminants (7). As the wellhead feed stream in the proposed process does not contain
sulfurous compounds, helium, or oxygen, and carbon dioxide is present at acceptable levels,
this step was not required.
Nitrogen Extraction
Nitrogen, the excessive presence of which can lower the energy content of the gas, is
most often removed from natural gas streams via a nitrogen rejection unit (NRU), which also
works to further dehydrate the gas using molecular sieve beds. Separation can occur through
Yotta Designs CHEN 4530 Senior Design Project May 5, 2010
18
the use of cryogenic methods, a column, and a brazed aluminum plate fin heat exchanger, or by
an absorbing solvent (7). Once again, since nitrogen was present at acceptable levels in the
wellhead inlet stream to the proposed process, this step was not needed.
Methane Separation
Methane is the primary component of sales gas, and can be separated from natural gas
streams either as part of the NRU unit or in a separate unit operation. If done separately, there
are two primary methods that are utilized for this purpose, these being cryogenic methods and
absorption. The cryogenic approach, which is better at extracting the lighter liquids in the
stream, such as ethane, is accomplished by lowering the temperature of the gas stream to
around -120 °F. This is often done through the use of a turbo expander in combination with
external refrigerants, and results in the condensation of all stream components besides
methane. The absorption method can be carried out by using absorption oil to absorb the
majority of the NGLs, which are subsequently distilled from the absorbing liquid oil (7). In the
proposed process the use of absorption oils was unnecessary, and methane separation was
achieved by the Sales Gas refluxed absorption column.
Fractionation
Fractionation is the process of separating the various NGLs by virtue of the differing
boiling points of the hydrocarbons in the stream. This is generally done through successive
distillation of the NGL stream, though to produce LPG in the proposed process just a single
distillation column was required (7).
Which of these steps are performed depends on the composition of the raw gas, and
multiple steps can be performed in a single unit operation, or at different locations (7).
Alternativesto the ProposedProcess
In modeling the natural gasoline with re-injection and natural gasoline expansion
processes, a number of process alternatives were identified and considered. These included
both alternative processes to those utilized to simulate these two natural gas processing plant
configurations, as well as methods for eliminating various assumptions and simplifications that
were utilized. A description of each process alternative is outlined below.
Yotta Designs CHEN 4530 Senior Design Project May 5, 2010
19
Dehydration
Glycol Fluids Package
The Peng-Robinson fluids package was utilized to model both the natural gasoline with
re-injection and natural gasoline expansion processes. This fluids package is ideal for the
modeling of non-polar hydrocarbons, of which the vast majority of the process streams consist;
however, as triethylene glycol (TEG) is hydrophilic, it is not always modeled well by this
package (8). It was therefore considered to use the glycol fluids package in Aspen HYSYS for
the TEG dehydration cycle (9). This matter was discussed with Mr. Arendell, though for the
conditions and purposes of this simulation it was determined that the modeling of this cycle by
the Peng-Robinson fluids package would be sufficient. Mr. Arendell noted that the simplifying
assumption that the Peng-Robinson package accurately modeled TEG dehydration could result
in an underestimate of the amount of water absorbed by the TEG. Nevertheless, the amount of
water in the final sales gas stream came out to be about half of the maximum given specification
of 4 lbs/MMSCF, which was deemed an appropriate tolerance for any extra water that may have
been present in the stream due to an underestimate in its removal during dehydration.
Drizo®
The effectiveness with which a TEG dehydration cycle removes water from a natural gas
stream is dependent on the purity of the glycol upon regeneration. The GPSA section 20 on
dehydration quotes an achievable TEG purity of 98.6 wt% by reboiling TEG at 400°F at
atmospheric pressure (8). However, the proposed process achieves a purity of 99.0 wt% TEG
by reboiling at just below 400°F and just above atmospheric pressure. This very small
discrepancy may be due to the fact that TEG is modeled by the Peng-Robinson fluids package
rather than the glycol package, as discussed in the Glycol Fluids Package section; though as
the quoted value is nearly reproduced, the use of the Peng-Robinson package is further
justified. Various enhanced glycol recovery processes exist, each of which is based on the
principle of reducing the effective partial pressure of water in the vapor space of the lean (water-
deficient) glycol stream, allowing for higher glycol concentrations to be obtained at the same
temperature (8). This results in a greater water dew point depression than can generally be
achieved. The Drizo® process is among these enhanced dehydration processes.
The process regenerates glycol by solvent stripping as opposed to the conventional gas
stripping that is ordinarily employed (10). The solvent is obtained from the natural gas itself,
and is composed of paraffinic and aromatic hydrocarbons (BTEX) that exhibit a C5+ boiling point
Yotta Designs CHEN 4530 Senior Design Project May 5, 2010
20
range (10) (8). In the regeneration column for the process, heavy hydrocarbons and water are
condensed from the overhead while non-condensable species are vented to the atmosphere
nearly free of BTEX. The condensed hydrocarbons are separated from the water, vaporized,
and superheated before being routed to the lean-glycol stripping column where they serve as
the stripping gas (8). This results in glycol purities of up to 99.998 wt% according to the
manufacturer, yielding water dew point depressions of upwards of 100 °C (10). The process
can even be supplemented with drying of the solvent by a solid desiccant, which can yield glycol
purities of as high as 99.999 wt% and water dew point depressions of 121 °C (8).
Aside from the fact that this process is exceedingly complicated to model, the extent of
glycol regeneration achieved and the water dew point depressions reached are unnecessary to
meet the sales gas purity specifications of 4 lbs/MMSCF of water and a hydrocarbon dew point
of 0 °F for the proposed process (11). While the Drizo® dehydration system seems well-suited
to applications with very stringent water removal criteria, its implementation in the proposed
process was deemed superfluous.
Coldfinger®
Another proprietary process for achieving enhanced glycol purities upon regeneration is
the Coldfinger® process. In this process, a bundle of condensing tubes (the cold finger), in
which rich TEG is commonly utilized as the coolant, is inserted into the vapor space of a surge
tank half full of lean TEG. The cold finger continuously condenses equilibrium water vapor,
which is discharged from the unit via a collecting trough placed beneath the finger. This
continuous condensation maintains the partial pressure of water in the vapor below its
equilibrium vapor pressure, which works to further draw water out of the lean TEG liquid phase.
The process results in glycol regeneration of upwards of 99.7 wt% TEG in the lean glycol
stream (8). Due to the fact that this process is not in equilibrium, while Apsen HYSYS models
all unit operations as if they were in equilibrium, the Coldfinger® process could not be easily
modeled using this software (11). And further, the extent of glycol regeneration achieved was
again deemed unnecessary to reach the water removal specifications required by the natural
gasoline expansion process.
Advanced Prism® Membranes
A fairly novel process for natural gas dehydration is membrane separation technology.
Advanced Prism® Membranes utilize the principle of selective gas permeation, in which the
Yotta Designs CHEN 4530 Senior Design Project May 5, 2010
21
driving force for separation is differing gas partial pressures on either side of a membrane, to
separate water from a natural gas stream (12). These units consist of bundles of hundreds of
thousands of hollow-fiber membranes enclosed in a pressure-rated casing. The gas to be
dehydrated is passed through this casing on the outside of the hollow fibers. Due to the faster
permeation rate of water through these membranes as compared with the hydrocarbons in the
stream, water diffuses through to the inside of the fibers, in which a lower pressure is
maintained. The many fibers provide a large area for membrane separation, resulting in
significant water removal from the stream. These separators can be arranged in parallel, in
series, or in a cascade fashion, and can yield gas streams of up to 98% purity (13). These units
have the potential to incur lower maintenance costs and operate with less downtime than
comparable dehydration units as there are no moving parts involved in the separation. In
addition, raw material costs can be lowered through the use of membrane separation as no
chemical inventory is required for their operation (12).
While membrane-based dehydration systems show much potential for the economic
dehydration of natural gas, this avenue was not pursued due to the impossibility of modeling
these units in Aspen HYSYS. However, this technology could provide a very viable option for
dehydration in similar natural gas recovery processes to the proposed processes.
Heat Integration
The implementation of a heat exchange network to minimize the utilization of process
utilities was investigated in designing the proposed processes. However, heat integration
among utility streams was determined to be infeasible given the thermal properties of these
streams. For instance, the chilled water that is used in the condensers of each column, after
being heated to 90 °F, no longer possesses enough of a cooling capacity to be used for any
other heat exchange processes. Similarly, the low and high pressure steam utilized in the
reboilers of each of the columns, after being condensed, no longer possesses enough of a
heating capacity to be used for any other heat exchange processes.
Any feasible heat integration that could be performed on the proposed processes would
have to involve process streams as opposed to solely utility streams. Though, due to
inexperience in the natural gas processing industry, this option was not considered. A possible
route for heat exchange would be to use the overhead from the sales gas column to cool the
inlet to this column as mentioned by Mr. Arendell. Another option brought up by Mr. Arendell
would be to use the hot C5+ product stream to run the reboiler of one of the other distillation
Yotta Designs CHEN 4530 Senior Design Project May 5, 2010
22
columns. While configurations like these have the potential to reduce the utility costs of the
plant, process stream heat integration greatly complicates the startup and control of the given
processes (14). For this reason a cost/benefit analysis would need to be performed in order to
determine if this type of heat integration would be economical without overcomplicating the
control systems for the processes.
A final process alternative relating to heat exchange that was considered was the
expansion of the propane refrigeration cycle to include cooling streams to each of the column
condensers. As the propane, which is recycled, would replace non-recycled cooling water
utilities in each of these condensers, this option may have provided an economic advantage to
the proposed natural gasoline expansion process, however, without a full economic analysis on
this expanded refrigeration cycle, its economic feasibility cannot be determined. Unfortunately,
time constraints did not permit proper investigation of this alternative.
Column Optimization
Due to the numerous variables involved in distillation and absorber column design there
are a plethora of alternate configurations that each of these could assume. For example,
columns could have different numbers of trays, pressures, inlet temperatures, etc. Nonetheless,
by adjusting column parameters such that the design specifications were met, the column
designs were optimized towards the designs that would actually be implemented in industry.
Further optimization was performed by changing the number of trays and the feed tray location
such that reboiler duties were minimized, thus minimizing the amount of heating utility required
to run the column. Finally, the feed tray was chosen based on matching the temperature of the
inlet stream to the inlet tray temperature as closely as possible. This provides for a smoother
temperature profile up the length of the column and allows for better control of column dynamics
upon disturbances (14). The design of each of the distillation and absorption columns was
honed throughout the project by conversations and parameters suggested by Mr. Arendell and
Professor Clough.
Refrigeration Cycle
The propane in the propane refrigeration cycle was modeled as pure propane; however,
this is not entirely accurate. In actuality, refrigeration-grade propane consists of 98% propane
and 2% ethane by weight (15). While this simplifying assumption may have resulted in the
modeling of the processes in this cycle slightly differently due to the different composition of this
exchange fluid, it was determined upon the discovery of the actual composition of refrigeration
Yotta Designs CHEN 4530 Senior Design Project May 5, 2010
23
propane that modeling it as pure propane would be sufficient for the proposed process.
However, to model the heat exchange more accurately in this aspect of the simulation, the
correct composition of refrigeration-grade propane would need to be used.
Recycle Operators
Two recycle operators were used in the design of the natural gasoline expansion
process, one in the TEG dehydration cycle and one that recycles C5+ back from the LPG
recovery column to the C5+ column. During the implementation of these operators into the
design, the performance of intermittent mass and energy balances was overlooked, and these
were performed only when the natural gas expansion process was complete. It was then
discovered that the sensitivities for mass and energy flows aligning with one another on either
side of the recycle operators were not tight enough, resulting in a 5.6 % discrepancy in the
energy balance on the process. However, in attempting to tighten the tolerances of the recycle
operators it was found that this was impossible with a complete process including two of these
operators, and Aspen HYSYS was unable to converge with tightened tolerances. While
unfortunate, this discrepancy does not invalidate the proposed process as the mass balance
was very nearly closed. Though in modeling similar processes, it is advisable to tighten the
tolerances for mass and energy flows on any recycle operators while the process is being
modeled, rather than at the end, when it is already complete.
Safety, Environmental, and Health Considerations
Natural gas processing presents a wide variety of safety, environmental, and health
considerations. These are reviewed herein.
PlantSafety (16)
In order to safely operate a natural gas processing plant it is of the utmost concern that
all industry safety standards and protocols are strictly adhered to. Basic safety measures such
as extensive personnel training for the operation of equipment containing flammable and
explosive hydrocarbons under high pressures and at high temperatures must be implemented.
All equipment should be preventatively maintained on a regular schedule. The control systems
of the plant should be optimized for safety, and backup and emergency shutdown systems
should be included for all major unit operations. Systems should be in place to monitor all
equipment for leaks, fluid levels, pressure and temperature, such that any irregularities will
quickly become evident before any situations become critically dangerous. Risk assessment
Yotta Designs CHEN 4530 Senior Design Project May 5, 2010
24
protocols should be in place to identify and evaluate any and all potential risks associated with
new or modified process equipment. Also, emergency response procedures should be in place
for any emergency that might occur.
Furthermore, the operation of a natural gas processing plant in particular requires that
concern be paid to various extra safety matters relating to flammability, fire, and explosions.
Again, all industry standard protocols regarding these risks should be followed with care.
Processes should be appropriately segregated from flammable product storage areas, or if this
cannot be achieved, blast walls should be implemented where they are necessary. The plant
should be designed such that potential ignition sources are avoided, such as the elimination of
fixtures that could leak flammable material onto or near heated piping or equipment. Finally the
specific dangers associated with each flammable material in the process should be known and
accounted for. For instance, pressurized flammable gasses can result in jet fires, while
flammable liquid spills can lead to pool fires. The specific dangers of the hydrocarbons and
chemicals employed in the proposed processes will further be outlined in the MSDS summary
section below.
EnvironmentalConcerns (16)
There are several environmental concerns associated with natural gas processing
including fugitive emissions, gas flaring, and wastewater treatment, each of which will be
implemented in the proposed processes.
Gas release to the environment is common in natural gas processing. Fugitive gas
emissions to the environment can occur from leaks in piping, valves, flanges, or other process
connections. In addition, emissions can occur during the loading and unloading of any
hydrocarbon streams or products. These emissions, which can include greenhouse gasses,
can be minimized through the installation of monitoring systems as well as by the maintenance
of stable tank pressures and vapor spaces. Oftentimes flammable gasses are flared from
natural gas processes either for byproduct disposal or as a safety measure for emergencies.
The proposed natural gasoline expansion process includes a Flare Gas stream in the TEG
regeneration cycle. For the sake of safety as well as the prevention of the release of
greenhouse gasses to the atmosphere, this process should be carried out in the most controlled
manner possible.
Yotta Designs CHEN 4530 Senior Design Project May 5, 2010
25
Wastewater treatment is also a concern for streams that are contaminated with
hydrocarbons or other chemicals. In the proposed processes the water separated from the inlet
separator, Water 1, as well as the overhead to the TEG Regeneration column, Water 2, are
wastewater streams. These would be treated with an onsite wastewater treatment unit, such
that no contaminated liquids were released into the environment. In addition, all plants that deal
with wastewater treatment should include secondary containment basins with impervious
surfaces to further prevent the release of deleterious compounds into groundwater or soil.
MSDSSummaries
The pertinent points of the MSDS for each of the products and chemicals in the process
are given below. While this information provides many of the key relevant safety issues
involved with working with these chemicals, it DOES NOT substitute for the actual MSDSs.
These should be reviewed and kept in an accessible location at the plant.
It is to be noted that the hazards of propane will not be summarized, as propane is
present in significant quantity in LPG, and the hazards can therefore be assumed to be the
same as for LPG.
Natural Gasoline (17)
 May contain benzene, cyclohexane, xylene, and/or toluene
o Can be carcinogenic due to presence of benzene
 Clear, colorless liquid with a distinct hydrocarbon odor
 Flash point: -45 °F
 Extinguishing media: dry chemical, foam, carbon dioxide
 Unusual fire and explosion hazards:
o Flames impinging on a product storage vessel above the liquid level can cause
vessel failure within nine minutes, resulting in a boiling liquid expanding vapor
explosion.
o Liquid product will change to vapor quickly at temperatures well below ambient
and form flammable mixtures with air.
Yotta Designs CHEN 4530 Senior Design Project May 5, 2010
26
o Vapors are heavier than air, and can travel long distances to an ignition source.
 Inhalation risk to respiratory and central nervous systems potentially resulting in death
 Frostbite can occur
Liquefied Petroleum Gas (18)
 May contain propane, propylene, and/or butane
 Clear, colorless gas
 Flash point: -156 °F; Autoignition temperature: 842 °F
 Extinguishing media: dry chemical, foam, carbon dioxide, water spray
 Unusual fire and explosion hazards:
o Containers of product may rupture upon exposure to heat or flame.
o Approach a flame-enveloped container only from the sides, and never from the
head ends.
o Vapors are heavier than air, and can travel long distances to an ignition source.
 Inhalation risk to respiratory and central nervous systems potentially resulting in death
 Freeze burns can occur
Natural Gas (19)
 May contain natural gas, benzene, and/or n-hexane
o Can be carcinogenic due to presence of benzene
 Clear, colorless gas
 Flash point: <100 °F
 Extinguishing media: dry chemical, foam, carbon dioxide, water fog
o Do not use a direct stream of water to extinguish, as natural gas will float, and
can reignite on the surface of water.
Yotta Designs CHEN 4530 Senior Design Project May 5, 2010
27
 Unusual fire and explosion hazards:
o Do not weld, heat, or drill on or near containers of the product.
o Do not enter confined-space fire without full bunker gear including a face shield,
bunker coat, gloves, rubber boots, and a positive-pressure breathing apparatus.
o Vapors are heavier than air, and can travel long distances to an ignition source.
 Inhalation risk to respiratory and central nervous systems potentially resulting in death
Triethylene Glycol (20)
 Clear, colorless liquid with no odor
 Slightly flammable
 Skin irritant
 Flash point: 351 °F; Autoignition temperature: 700 °F
 Can form explosive mixture with air above flash point
 Extinguishing media: dry chemical, alcohol foam, carbon dioxide
o Water or foam may cause frothing
Project Premises and Corresponding Simulation Parameters
The design specifications were given by Mr. Arendell and URS Corporation. Table 8
outlines these specifications and the corresponding simulation parameters.
Yotta Designs CHEN 4530 Senior Design Project May 5, 2010
28
Table 8. Project specifications and corresponding simulation and design parameters.
Design Specification Design Value
Current
Design
Value
Wellhead Flow Rates to Facility
Adjusted by design group to produce approximately 10,000 BPD of natural
gasoline.
Adjust 1
Natural gasoline and re-injection process dry wellhead flow rate (bpd): 1.068E5
Natural gasoline expansion dry wellhead flow rate (bpd): 1.068E5
Produced Water Rate
1.5 bbl water per MMSCF of gas flow out of the inlet separator. Adjust 2
Natural gasoline and re-injection process wet wellhead and water production
flow rate from inlet separator (bpd):
360.4 344.7
Natural gasoline expansion wet wellhead and water production flow rates from
inlet separator (bpd):
360.4 344.7
Gas Re-Injection
Normal gas injection pressure (bar g): 180 180
Future Pipeline Gas Product Specification
Maximum hydrocarbon dew point (°F) at 55 barg: 0 -41.2
Future pipeline gas delivery pressure (bar g): 55 55
Product Specifications
Natural Gasoline (C5+ product)
Maximum Reid Vapor Pressure (RVP) (psia): 10 10
Design standard flow rate (bpd): 8,000-11,000
Re-Injection standard flow rate (bpd): 9,202
Expansion standard flow rate (bpd): 9,869
Liquefied Petroleum Gas
Maximum true vapor pressure (TVP) (psia) at 100°F: 210 208.2
C5+ content (% volume maximum): 2.0 0.98
Future Residue (Sales) Gas
Maximum CO2 content (mole %): 2.0 0.0032
H2O content (lbs/MMSCF): 4 2.0
Maximum hydrocarbon dew point (°F): 0 -41.2
These results demonstrate that every design and product specification was met.
The process was developed using the following assumptions and specifications with
regard to design and economics.
DesignAssumptions
 Peng-Robinson equation of state is valid for the entire process
 Ignore light ends in Oil Manager
Yotta Designs CHEN 4530 Senior Design Project May 5, 2010
29
 Mole fractions of C5+ hypothetical components are distributed equally in the Dry Well
inlet material stream
 The dehydration step effectively removes enough water to negate hydrate formation
EconomicAssumptions
 The plant is an expansion on an existing process that has produced 2,500 bpd of natural
gasoline for an unknown duration of time
 Conservatively, the salvage value of the current process is unknown and assumed to be
negligible
 The purchase of land is not required
 The plant is to be constructed in the Yamal Peninsula, Siberia, Russia
 Plant is operated 90% of the year for 7,884 operating hours
 No royalties
Overall Process Flow Diagrams
Process flow diagrams are linear representations of the process. Both processes were
modeled in Aspen HYSYS V7.0 (9).
Natural Gasoline ProcessFlowDiagrams
The current plant in the Yamal Peninsula produces 2,500 bpd of natural gasoline. The
overhead products from inlet separation and C5+recovery are reinjected into the well,
representing a significant cost for compression power and significant profit loss for the
contained sales gas and LPG products. Figure 4 is the final Aspen HSYSYS process flow
diagram (PFD) diagram.
30
Figure 4. Final simulation of “current” natural gasoline production.
Material streams are blue, energy streams are red, and special controls are illustrated in neon green. Large blue arrows represent
products.
31
Natural Gasoline ExpansionProcessFlowDiagram
The proposed design curtails the necessity for re-injection by expanding the separation
train to include sales gas and LPG recovery processes. The process builds off of the overhead
streams that were re-injected. The additional sales gas and LPG recovery streams required
dehydration, refrigeration, and heat exchange prior to the final separation steps.
32
Figure 5. Final simulation of “expanded” natural gasoline production.
Material streams are blue, energy streams are red, and special controls are illustrated in neon green. Large blue arrows represent
products.
33
Process Descriptions
Inlet Separationand NaturalGasolineRecovery
In the inlet separation and natural gasoline recovery portion of the process water in the
wellhead stream is separated from the liquid hydrocarbons and natural gas prior to natural
gasoline recovery in the C5+ distillation column.
Natural Gasoline PFD
Figure 6 depicts the process of inlet separation of the wellhead stream, natural gasoline
recovery, and natural gas compression for re-injection into the well:
1Wellhead
50 °F
2190 psia
2 3
Water 1
Hydrocarbons
C5+ Column
Overhead 1
Qheat
3-Phase Inlet
Separator
Overhead 2
4
Qcomp1
Overhead 3
Qc1
Qr1
C5+
$
C5+ Storage
C5+
Qcomp2
Overhead 2
Compressor
Re-Injection
Compressor 1
Qcomp3
Re-Injection
Compressor 2
5
Qcomp4
Re-Injection
Compressor 3
6 Re-Injection
105 °F
1505 psia
50 °F
155 psia
400 °F
160 psia
322 °F
2625 psia
69 °F
605 psia
66 °F
605 psia
-$
-$
Figure 6. “Current” natural gasoline production process flow diagram with select stream conditions.
Natural Gasoline Expansion PFD
In the natural gasoline expansion process, inlet separation proceeds in a similar fashion
to the natural gasoline process; however, the natural gasoline recovery column includes a
recycled feed from the LPG recovery process. In this process the natural gas was not
compressed for re-injection, but rather simply piped to the TEG dehydration cycle as illustrated
in Figure 7.
Yotta Designs CHEN 4530 Senior Design Project May 5, 2010
34
1Wellhead
50 °F
2190 psia
2 3
Water 1
Hydrocarbons
C5+ Column
Overhead 1
Qheat
3-Phase Inlet
Separator
Overhead 2
4
Qcomp1
Overhead 3 to TEG Dehydration
Qc1
Qr1
C5+
$
C5+ Storage
C5+
Overhead 2
Compressor
105 °F
1505 psia
50 °F
165 psia
393 °F
175 psia
69 °F
605 psia
C5+ Recycled
278 °F
200 psia
C5+ from Sales/LPG Recovery
300 °F
255 psia
-$
66 °F
605 psia
Figure 7. Natural gasoline expansion process flow diagram showing overhead to TEG dehydration, and
recycle from LPG recovery process.
Approach
Separation of the water, liquid hydrocarbons, and natural gas in wellhead natural gas
streams is often accomplished via mechanical three phase separation units (7). This is the
approach utilized in the both of the proposed processes. Consultation with Mr. Arendell
confirmed this method of inlet separation as being well-suited to the processes being modeled.
To assist in the modeling of C5+ recovery the GPSA section on fractionation as well as
specifications provided by Mr. Arendell were utilized (21). In addition, the GPSA section on
separation equipment was used to determine a residence time for vessel sizing of the inlet
separator (22). The specifications used to converge this phase of the process are as follows:
 Hypothetical C5+ components in dry well stream of equal composition, adding to the total
mole fraction of C5+ in the stream as given by the problem statement
 Dry Well and Water Well streams at 50 °F and 150 bar g as per the problem statement
 Pressure drop across inlet heater and valve to 103 bar g as given in problem statement
 Temperature reached after heating by inlet heater and expansion by inlet valve 105 °F in
stream 3 to avoid hydrate formation
Yotta Designs CHEN 4530 Senior Design Project May 5, 2010
35
 Pressure drop of 62.05 psi across inlet separator as specified by Mr. Arendell
 Pressure of 175 psia at the reboiler of the C5+ column, with a 10 psi pressure drop up
the column
 Reid Vapor Pressure (RVP) column specification of 10 psia at reboiler stage of C5+
column as per the problem statement
 Temperature column specification at condenser stage of 50 °F of C5+ column to avoid
hydrate formation
 Feed stage 1 for natural gasoline process and stages 1 and 10 for the hydrocarbons and
C5+ Recycled streams, respectively, for the natural gasoline expansion process
 Compression of C5+ overhead to 41.71 bar to match the pressure of the overhead from
the inlet separator before their combination
 Gas pressure after Re-injection compressors 1, 2, and 3 of 77.35 bar, 129.4 bar, and
181 bar respectively, meeting the re-injection pressure specification of 180 bar g given in
the problem statement
For the inlet separation and C5+ recovery stage of both processes the flow rates of the
Dry Well and Well Water streams were determined by given downstream parameters. Adjust
operator 1 was implemented to set the flow rate of the Dry Well stream such that the flow rate of
the C5+ stream was 10,000 standard BPD, the design specification given in the problem
statement. Similarly, Adjust operator 2 and the Water Spreadsheet were introduced to set the
flow rate of the Water Well stream such that 1.5 bbl of water was produced from the inlet
separator for every MMSCF of gas flow from the inlet separator, another given specification.
Converging distillation columns in Aspen HYSYS requires the specification of two
process variables to account for the two degrees of freedom in the column. As the C5+ product
stream purity specification was a RVP of 10 psia, one of the column specifications for the C5+
column was that the reboiler stage has an RVP of 10 psia. Originally, the other specification to
account for the final degree of freedom in the column was a reflux ratio of 0.5 suggested by Mr.
Arendell. However, using this configuration hydrates were found in Overhead 2 of this column.
The second column specification was therefore changed to a 50 °F temperature at the
condenser stage of the column. This was found to eliminate hydrate formation in the overhead.
Yotta Designs CHEN 4530 Senior Design Project May 5, 2010
36
A storage tank was also modeled to hold one day’s worth of natural gasoline product, or 10,000
bbl.
The only difference in the inlet separation phase of the processes is that in the natural
gasoline process the combined overhead gasses are compressed for re-injection into the well,
whereas in the natural gasoline expansion process the combined overhead streams are simply
routed to the dehydration system. For the re-injection process three compressors were
modeled to bring the gas up to re-injection pressure so that the cost of these could be
determined using an available costing equation. Therefore, to size the compressors within the
maximum horsepower constraint of the costing equation Adjust functions 3 and 4 were used to
adjust the pressures of the respective outlet gas streams such that the a horsepower of 5990
was achieved in the first two re-injection compressors. The final re-injection compressor works
to bring the natural gas pressure up to re-injection specification. In reality, only one large
compressor would be used for re-injection; however, Mr. Arendell agreed that this alternate
configuration employed for economic convenience was adequate to model this portion of the
process.
Triethylene GlycolDehydration
To produce sales-quality natural gas, excess water must be removed from the gas to
meet the common standards for sales gas as well as to protect the pipeline from damage.
Triethylene Glycol Dehydration PFD
In an effort to mitigate deleterious hydrate formation, dehydration is a crucial step to
remove water from the process. Here, triethylene glycol was used to absorb water in the TEG
contactor as shown in Figure 8.
Yotta Designs CHEN 4530 Senior Design Project May 5, 2010
37
Overhead 3 from
Inlet Separation
Dry Gas
Rich TEG
Lean TEG
TEG Flash Drum
5
Flare Gas
TEG Air Cooler
TEG
TEG Pump
3
TEG HX
69 °F
605 psia
95 °F
690 psia
75 °F
100 psia
Regenerated TEG
6
178 °F
15 psia
7
300 °F
90 psia
400 °F
16 psia
Qc2
Qr2
TEG
Regeneration
Column
300 °F
30 psia
Water 2
Propane HX
Propane Out to
Refrigeration
Cycle
Propane In from
Refrigeration
Cycle
69 °F
593 psia
253 °F
15 psia
12 to Sales/LPG Recovery
-36 °F
18 psia
-38 °F
17 psia
-33 °F
590 psia
11
-40 °F
510 psia
Qpump
-$
-$
TEG Contactor
Figure 8. TEG dehydration to remove water from the overhead gas stream prior to sales gas and LPG
recovery.
Approach
Liquid desiccant dehydration equipment, more specifically triethylene dehydration, can
be easily automated for use in remote areas. The primary source for glycol dehydration was the
corresponding GPSA section (8). It was recommended by Mr. Arendell to model the dehydration
cycle with triethylene glycol (TEG) and to generate a flow diagram with the assistance of the
outlined GPSA unit operations.
TEG is the most common liquid desiccant used for natural gas dehydration. It was
recommended within the GPSA document that the design employ a 3 gal. TEG/lb water
absorbed ratio (8). The dehydration cycle was converged with the following specifications:
 Circulation rate of TEG: 3 gal. TEG/ lb water absorbed
 The TEG contactor was specified to have a 5 psia pressure drop.
 The TEG regeneration column is run at atmospheric pressure with a 10 kPa pressure
drop up the column.
 The reboiler on the TEG regeneration column is specified at a temperature of 400 °F.
Yotta Designs CHEN 4530 Senior Design Project May 5, 2010
38
 Reflux ratio of the TEG regeneration column is specified as 0.50
 Process stream pressure drop of 10 psi, air intake temperature of 85°F, and air intake
pressure of 14.7 psia for the air cooler
 The pressure drop for the pump was specified to 684.5 psia
Commonly, an inlet scrubber is installed to prevent accidental dumping of large
quantities of water, hydrocarbons, or corrosion inhibitors into the TEG absorber (8). However, it
was decided to exclude the scrubber in the proposed process because the feed stream was
completely vapor. The first unit operation in the dehydration system is the TEG contactor in
which glycol enters on the top stage and absorbs the water from the counter-current vapor
stream. The water-rich TEG is then subjected to a flash drum which flashes off most of the
soluble gas and flares it. The water is then removed from the water-rich TEG stream within the
TEG regeneration column. The column removes the water from the TEG at atmospheric
pressure with heat (400 °F). The lean-TEG stream is then cooled with the bottoms of the flash
drum, which brings the TEG closer to the feed conditions for the TEG absorber. The lean-TEG
is then pumped and further cooled with an air cooler to return the stream to the absorber feed
conditions. The glycol dehydration is a crucial step in ensuring pipeline quality LPG and sales
gas.
Propane RefrigerationCycle
The purpose of the propane refrigeration cycle is to cool the dehydrated gas stream prior
to entering the sales gas recovery column.
Propane Refrigeration Cycle PFD
Figure 9 illustrates the two-stage refrigeration cycle that was used to cool the dehydrated
gas stream prior to sales gas and LPG recovery:
Yotta Designs CHEN 4530 Senior Design Project May 5, 2010
39
Dry Gas from
TEG
Dehydration
69 °F
593 psia
Propane HX
Propane Out
Propane In
12 to Sales/LPG Recovery
-33 °F
590 psia
11
-40 °F
510 psia
-36 °F
18 psia
Liquid
-38 °F
17 psia
Liquid
Propane
Recycled Liquid
Propane
Flash Drum 1
Suction Drum
Propane Vapor
Qcomp3
Propane
Compressor 1
15
Propane Recycled Vapor
16
Qcomp4
17
Propane
Compressor 2
Propane Air Cooler
67 °F
60 psia
24 °F
58 psia
Propane
Flash Drum 3
Economizer
24 °F
60 psia
55 °F
58 psia
155 °F
187 psia
18
Propane
Flash Drum 2
Accumulator
Propane
Liquid
19
95 °F
177 psia
26 °F
62 psia
Liquid Vent
Vapor Vent
Figure 9. Two-stage propane refrigeration cycle to reduce the temperature of the gas stream prior to sales
gas recovery in the reboiled absorber.
Approach
The cooling of the dehydrated gas stream to -33 °F partially condenses the stream to
enhance separation in the reboiled absorber (21). The primary guiding document for the
refrigeration cycle was the corresponding GPSA section (23). In concordance with this
document, it was recommended by Mr. Arendell to model a two-stage refrigeration cycle with an
economizer. This system saves on refrigeration costs by reducing compressor duty while not
investing in the additional equipment required for a three-stage system.
The cycle was simulated with pure propane; however, refrigeration-grade propane
contains 98% propane and 2% w/w ethane (15). Therefore, the refrigeration cycle is idealized
and adaptable once the exact composition of the on-site refrigerant is determined. The cycle
was built with minimal stream specifications. The specifications were as follow:
 Vapor/Phase Fraction of 1.0 and temperature of -38 °F in Propane Out to allow for a 5 °F
approach temperature with process Stream 11
 Inlet pressure drop of 1.5 psi in Suction Drum
Yotta Designs CHEN 4530 Senior Design Project May 5, 2010
40
 Pressure of 60 psia in Stream 15
 Process stream pressure drop of 10 psi, air intake temperature of 85°F, and air intake
pressure of 14.7 psia for the air cooler
 Vapor/Phase Fraction of 0 and temperature of 95°F in Stream 18
 Pressure of 62 psia in Stream 19
 Inlet and vapor outlet pressure drops of 2 psi in the Economizer
In brief, the propane refrigerant undergoes four steps with the intent to evaporate in the
process heat exchanger, thereby cooling the process stream from 70 °F to -33 °F.
Coincidentally, the propane stream reduces from -35.6 °F to -38 °F during vaporization, allowing
for a five degree Fahrenheit approach. This represents the first of the four steps. The stream
then passes through a suction drum to knock out any liquids prior to compression. This was
initially modeled as a flash drum but was corrected to a tank to avoid background equilibrium
calculations. Secondly, the vapor is compressed in two different compressors. The second
compressor combines the vapor product from the economizer with the one-time compressed
vapor that is once-removed from the process heat exchanger. This is the energy saving step
that characterizes this system as a two-stage cycle. The propane stream is still in the
superheated vapor form following compression, thus giving way to the third step of
condensation in the air cooler. The stream completely condenses via heat exchange with air.
This step necessarily cools the stream to prepare for a two-step expansion via passing through
the economizer. There is a vapor vent potential in the accumulator to isolate liquid refrigerant
prior to expansion. Thus, the fourth and final step is expansion to reduce the pressure and
temperature of the refrigerant prior to heat exchange with the process stream.
Sales Gas and LPG Recovery
The sales gas and LPG portion of the natural gasoline expansion process purifies and
recovers natural sales gas and LPG, as well as removing excess C5+ from the natural gas and
recycling it back to the C5+ recovery column.
PFD
Figure 10 illustrates the configuration of the unit operations required to perform the
functions described above:
Yotta Designs CHEN 4530 Senior Design Project May 5, 2010
41
Dry Gas from
TEG Dehydration
Propane HX
Propane Out to
Refrigeration
Cycle
Propane In from
Refrigeration
Cycle
69 °F
593 psia
12
-36 °F
18 psia
-38 °F
17 psia
-33 °F
590 psia
11
-40 °F
510 psia
Sales Gas Column
Sales Gas
Qcomp4
Propane
Compressor 2
-40 °F
500 psia
LPG Column
Qc4
Qr4
Heavy LPG 13
Qr3
C5+ Recycle to Inlet Separation
237 °F
510 psia
184 °F
255 psia
LPG to Pipeline
115 °F
245 psia
300 °F
255 psia
Sales Gas Compressed to Pipeline
27.69 °F
812.4 psia
$
$
Figure 10. Sales gas recovery in the reboiled absorbed and LPG recovery in the distillation column. The
bottoms product of the LPG column recycles to the C5+ recovery column to enhance yield.
Approach
Sales gas recovery is often accomplished by an absorption tower in industry (7). Upon
suggestion by Mr. Arendell, a reboiled absorber specifically was implemented for this purpose.
In order to model LPG recovery, the GPSA section on fractionation as well as a patent by
Mealey were utilized to determine various operating parameters including relevant temperatures
to the process (21) (24). Using these sources as well as input from Mr. Arendell, sales gas and
LPG of appropriate qualities were recovered from the natural gasoline expansion process.
Following are the specifications that were used to achieve convergence of this portion of the
process:
 Temperature and pressure of gas stream lowered to -40.01 °F and 510 psia,
respectively, with Propane Heat Exchanger and Sales Valve before entrance to Sales
Gas Column to meet ideal absorption conditions, as suggested by Mr. Arendell
 Pressure of 510 psia at the reboiler of the sales gas absorption column, with a 10 psi
pressure drop up the column
 Temperature column specification of 237 °F at the Sales Gas column reboiler
 Sales gas pipeline injection pressure of 55 psig as specified in the problem statement
 Pressure of 255 psia before entrance to LPG column
Yotta Designs CHEN 4530 Senior Design Project May 5, 2010
42
 Pressure of 255 psia at the reboiler of the LPG column, with a 10 psi pressure drop up
the column
 Temperature column specification in the LPG column of 300°F at the reboiler
 Composition column specification on the LPG product stream of the LPG column of
1.420 X 10⁻²
fraction by volume of the lowest molecular weight hypothetical C5+
component
The convergence of the absorption and distillation columns in the sales gas and LPG
recovery portion of the process in such a way that all of the purity specifications on the two
product streams were met was a difficult process. As the specifications for sales gas and LPG
purity were given in terms of a hydrocarbon (HC) dew point and maximum vapor pressure
specification, respectively, these were first used as column convergence parameters. The
refluxed absorber, which has only one degree of freedom, was converged based on an a HC
dew point specification such that the HC dew point of the sales gas was below the given
maximum value of 0 °F. The LPG distillation column was then converged using specifications
for True Vapor Pressure (TVP) at 100 °F and reflux ratio. However, with this set of parameters,
it was impossible to meet the other purity specification of the LPG product stream, that it should
contain less than 2 % of C5+ species by volume.
Eventually, upon the suggestion of a reboiler temperature of 300 °F for the LPG column
by Mr. Arendell, all of the product purity specifications were met. First of all, one of the column
convergence parameters of the LPG column was set to meet the given reboiler temperature.
Then, in order to meet the C5+ content specification for the LPG product, a column parameter
controlling the composition of the highest boiling hypothetical C5+ component in the LPG stream
was created. By adjusting this parameter downwards, the stream was purified of C5+ to
acceptable levels. However, at this point the TVP specification of the stream was not being
met. This was accomplished by changing the convergence parameter of the Sales Gas column
to reboiler temperature, then adjusting this value upwards. This resulted in more heavy
hydrocarbons being reboiled into the Sales Gas stream, which increased the HC dew point of
this stream (within acceptable allowances), while decreasing the TVP of the LPG product. By
this method, and the fact that the water content specification of the Sales Gas stream was easily
met by previous TEG dehydration, all of the product specifications for both the Sales Gas and
the LPG were met.
Yotta Designs CHEN 4530 Senior Design Project May 5, 2010
43
Material and Energy Balances
The performance of material and energybalanceswasnecessarytovalidate the accuracywith
whichAspenHYSYSwas able to model the natural gasprocesses.
Material and Energy Balances
Material and energy balances for both processes were valid, except the overall energy
balance on the expansion process. This imbalance may be attributed to relaxed recycle
sensitivities. A suggestion from Professor Clough and Mr. Arendell to tighten the sensitivities
from 10 to less than unity and increase the number of iterations from 10 to over 100 arose
during the final presentation. This approach was explored and proved to be constrained by time.
At this point in the design, single iterations of one sensitivity unit were allowed to run for several
hours without completing an iteration. Therefore, it is recommended to investigate this approach
upon first reaching convergence of the recycle function. Overall and unit operation balances
were performed in an effort to pinpoint the imbalances.
Balances were completed about the entire processes to validate conservation of mass
and energy. The imbalance of the process, given by Equation 1, demonstrated the validity of
PFD convergence.
Equation 1. Equation to calculate imbalance for material and energy streams.
𝐼𝑚𝑏𝑎𝑙𝑎𝑛𝑐𝑒 = ( 𝑇𝑜𝑡𝑎𝑙 𝐹𝑙𝑜𝑤 𝑜𝑓 𝑂𝑢𝑡𝑙𝑒𝑡 𝑆𝑡𝑟𝑒𝑎𝑚𝑠) − ( 𝑇𝑜𝑡𝑎𝑙 𝐹𝑙𝑜𝑤 𝑜𝑓 𝐼𝑛𝑙𝑒𝑡 𝑆𝑡𝑟𝑒𝑎𝑚𝑠)
Furthermore, the relative imbalance, illustrated in Equation 2, normalizes the imbalance to the
total flow of inlet streams. The expected value of this figure is zero; however, HYSYS is
accurate to 0.02 % (9).
Equation 2. Equation to calculate relative imbalance for material and energy streams.
𝑅𝑒𝑙𝑎𝑡𝑖𝑣𝑒 𝐼𝑚𝑏𝑎𝑙𝑎𝑛𝑐𝑒 (%) =
𝐼𝑚𝑏𝑎𝑙𝑎𝑛𝑐𝑒
𝑇𝑜𝑡𝑎𝑙 𝐹𝑙𝑜𝑤 𝑜𝑓 𝐼𝑛𝑙𝑒𝑡 𝑆𝑡𝑟𝑒𝑎𝑚𝑠
× 100
A relative mass imbalance of zero percent demonstrates that the PDF is fully converged.
Natural Gasoline Process Balances
The mass balance for the natural gasoline process is shown in Table 9:
Yotta Designs CHEN 4530 Senior Design Project May 5, 2010
44
Table 9. Natural gasoline material balance
C5+ Material Streams
Inlet lb/hr Outlet lb/hr
Dry Well 5.58E+05 Water 1 5.10E+03
Water Well 5.38E+03 LNG 1.01E+05
C5+ Vapor Product 0
Re-Injection Gas 4.57E+05
Total (lb/hr) 5.64E+05 5.64E+05
Imbalance (lb/hr) 0
Relative Imbalance 0%
The relative imbalance is acceptable.
The energy balance for the natural gasoline process is shown in Table 10.
Table 10. Natural gasoline energy balance
C5+ Energy Streams
Inlet Btu/hr Outlet Btu/hr
Dry Well -9.75E+08 Water 1 -3.49E+07
Water Well -3.69E+07 Qc1 1.00E+05
Qheat 3.32E+07 LNG -7.73E+07
Qr1 2.08E+07 C5+ Vapor Product 0.00E+00
Qcomp1 6.04E+05 Re-Injection Gas -7.89E+08
Qcomp2 2.04E+07
Qcomp3 2.04E+07
Qcomp4 1.55E+07
Total -9.01E+08 -9.01E+08
Imbalance (Btu/hr) 4000
Relative Imbalance 0%
The relative imbalance is acceptable.
Yotta Designs CHEN 4530 Senior Design Project May 5, 2010
45
The unit operation balance exposed an imbalance about the C5+ column, as seen in
Table 11.
Table 11. Unit operation balances with C5+ column detail for natural gasoline process. Remarkable (>1)
imbalances denoted in red.
C5+ Process Imbalance
Unit Op Name Mass Flow (lb/hr) Energy Flow (Btu/hr) Volume Flow (bpd)
3-Phase Inlet Separator 1.59E-06 4.84E-07 1.09E-04
C5+ Column 3.97E-06 4.00E+03 2.72E-04
Inlet Heater 3.17E-06 1.36E-06 2.17E-04
Inlet Valve 2.38E-06 1.22E-06 1.63E-04
LNG Storage Tank 7.94E-06 3.41E-06 5.43E-04
Overhead 2 Compressor 4.76E-06 2.05E-06 3.26E-04
Overhead Mixer 7.94E-07 -3.54E-07 5.43E-05
Re-Injection Compressor 1 5.56E-06 2.39E-06 3.80E-04
Re-Injection Compressor 2 6.35E-06 2.73E-06 4.35E-04
Re-Injection Compressor 3 7.14E-06 3.07E-06 4.89E-04
Wellhead Mixer -1.13E-10 1.99E-07 -3.02E-11
Total 0 4000 0
C5+ Process C5+ Column Imbalance
Unit Op Name Mass Flow (lb/hr) Energy Flow (Btu/hr) Volume Flow (bpd)
Condenser -4.41E-12 -3.39E-01 7.07E-13
Main TS 1.59E-06 3.92E+03 1.09E-04
Reboiler 7.94E-07 9.43E00 5.43E-05
Total 0 4000 0
The energy imbalance observed in the C5+ column existed but was negated when normalized,
as seen in the overall energy balance.
Expansion Process Balances
Similarly, a material balance about the expansion process is shown in Table 12.
Yotta Designs CHEN 4530 Senior Design Project May 5, 2010
46
Table 12. Expansion process material balance
Expansion Process Material Streams
Inlet lb/hr Outlet lb/hr
Dry Well 5.58E+05 Water 1 5.10E+03
Water Well 5.38E+03 Flare Gas 1.45E+01
Water 2 3.02E+02
Sales Gas Compressed 4.39E+05
LPG 1.14E+04
Propane Liquid 0 0.00E+00
Propane Vapor 0 0.00E+00
LNG 1.08E+05
C5+ Vapor Product 6.54E+00
Total (lb/hr) 5.64E+05 5.64E+05
Imbalance (lb/hr) 23
Relative Imbalance 0%
The relative imbalance is acceptable.
The problematic energy balance for the natural gasoline process is shown in Table 13:
Yotta Designs CHEN 4530 Senior Design Project May 5, 2010
47
Table 13. Expansion energy balance
Expansion Process Energy Streams
Inlet Btu/hr Outlet Btu/hr
Dry Well -9.75E+08 Water 1 -3.49E+07
Water Well -3.69E+07 Qc1 1.35E+05
Qheat 3.32E+07 Flare Gas -2.48E+04
Qr1 2.08E+07 Qc2 1.35E+05
Qcomp1 5.88E+05 Water 2 -1.59E+06
Qr2 8.42E+05 Sales Gas Compressed -8.42E+08
Qpump 1.75E+04 Qc4 4.27E+07
Qcomp2 1.12E+07 LPG -1.30E+07
Qr4 4.19E+07 Propane Liquid 0 0
Qr3 4.62E+06 Propane Vapor 0 0
Qcomp3 7.65E+06 LNG -8.28E+07
Qcomp4 1.02E+07 C5+ Vapor Product -4.56E+03
Total (Btu/hr) -8.81E+08 -9.31E+08
Imbalance (Btu/hr) -4.97E+07
Relative Imbalance 5.6%
The relative imbalance of 5.6% is the point of discrepancy for the expansion process.
The unit operation balance exposed significant and numerous energy imbalances, as
seen in Table 14:
Yotta Designs CHEN 4530 Senior Design Project May 5, 2010
48
Table 14. Unit operation balances for the expansion process. Remarkable (>1) imbalances denoted in red.
Expansion Process Imbalance
Unit Op Name Mass Flow (lb/hr) Energy Flow (Btu/hr) Volume Flow (bpd)
3-Phase Inlet Separator 2.38E-06 8.25E-07 1.63E-04
C5+ Column 1.03E-05 -8.75E+03 7.06E-04
C5+ Recycle -4.68E+00 3.14E+03 -4.38E-01
C5+ Recycle Valve 7.14E-06 3.07E-06 4.89E-04
Inlet Heater 9.52E-06 4.09E-06 6.52E-04
Inlet Valve 3.17E-06 1.56E-06 2.17E-04
LNG Storage Tank 2.62E-05 1.12E-05 1.79E-03
LPG Column 1.19E-05 -2.40E+04 8.15E-04
LPG Valve 5.56E-06 2.39E-06 3.80E-04
Overhead 2 Compressor 1.27E-05 5.46E-06 8.70E-04
Overhead Mixer 7.94E-07 -3.54E-07 5.43E-05
Propane Air Cooler 2.54E-05 -4.93E+07 1.74E-03
Propane Compressor 1 1.43E-05 6.14E-06 9.78E-04
Propane Compressor 2 1.51E-05 6.48E-06 1.03E-03
Propane Flash Drum 1 1.75E-05 7.51E-06 1.20E-03
Propane Flash Drum 2 1.90E-05 8.19E-06 1.30E-03
Propane Flash Drum 3 1.83E-05 7.85E-06 1.25E-03
Propane HX 2.30E-05 -3.09E-01 1.58E-03
Propane Mixer 1.59E-06 6.82E-07 1.09E-04
Propane Valve 1 8.73E-06 3.75E-06 5.98E-04
Propane Valve 2 7.94E-06 3.41E-06 5.43E-04
Sales Compressor 1.35E-05 5.80E-06 9.24E-04
Sales Gas Column 2.38E-05 -1.14E+02 1.63E-03
Sales Valve 4.76E-06 2.05E-06 3.26E-04
TEG Air Cooler 2.46E-05 -3.05E+05 1.68E-03
TEG Contactor 1.59E-05 6.21E+01 1.09E-03
TEG Flash Drum 1.67E-05 7.17E-06 1.14E-03
TEG HX 2.22E-05 9.55E-06 1.52E-03
TEG Pump 1.98E-05 8.53E-06 1.36E-03
TEG Recycle 2.77E+01 -6.44E+04 1.69E+00
TEG Regeneration Column 1.11E-05 1.01E+00 7.61E-04
TEG Valve 1 3.97E-06 1.71E-06 2.72E-04
TEG Valve 2 6.35E-06 2.73E-06 4.35E-04
Wellhead Mixer -1.13E-10 1.99E-07 -3.02E-11
Total 0 -4.97E+07 0
Yotta Designs CHEN 4530 Senior Design Project May 5, 2010
49
The significant negative energy imbalance was caused by a combination of columns, recycle
functions, and an air cooler imbalance. The final value with a seventh-order magnitude exposes
the source of error.
Detailed column imbalances are shown in Table15.
Table 15. Column balance details for expansion process. Remarkable (>1) imbalances denoted in red.
C5+ Column Imbalance
Unit Op Name Mass Flow (lb/hr) Energy Flow (Btu/hr) Volume Flow (bpd)
Condenser -1.76E-12 7.48E-01 0
Main TS 1.59E-06 -8.68E+03 1.09E-04
Reboiler 7.94E-07 -6.89E+01 5.43E-05
Total 0 -9.00E+03 0
TEG Contactor
Unit Op Name Mass Flow (lb/hr) Energy Flow (Btu/hr) Volume Flow (bpd)
TS-1 -2.26E-10 62 0
TEG Regeneration Column
Unit Op Name Mass Flow (lb/hr) Energy Flow (Btu/hr) Volume Flow (bpd)
Condenser 1.59E-06 5.81E-07 1.09E-04
Main TS 7.94E-07 1.01E+00 5.43E-05
Reboiler 4.41E-12 1.71E-07 5.89E-14
Total 0 0 0
LPG Column
Unit Op Name Mass Flow (lb/hr) Energy Flow (Btu/hr) Volume Flow (bpd)
Condenser 1.59E-06 3.33E-01 1.09E-04
Main TS 7.94E-07 -2.40E+04 5.43E-05
Reboiler -1.13E-10 4.00E-01 -7.54E-12
Total 0 -24000 0
Sales Gas Column
Unit Op Name Mass Flow (lb/hr) Energy Flow (Btu/hr) Volume Flow (bpd)
Main TS -1.13E-10 -1.13E+02 -3.02E-11
Reboiler 7.94E-07 -1.51E+00 5.43E-05
Total 0 0 0
Yotta Designs CHEN 4530 Senior Design Project May 5, 2010
50
The additive effect of these imbalances was corroborated by the overall energy imbalance. This
analysis expands the imbalance beyond the recycle functions. However, both recycle balances
are shown in Table 16 to provide additional clarity to the imbalance:
Table 16. Recycle balances for the expansion process. Remarkable (>1) imbalances denoted in red.
C5+ Recycled
Stream 14 C5+ Recycled Imbalance Relative Imbalance
Vapour 1.58E-01 1.58E-01 -2.62E-05 -0.02%
Temperature (°F) 2.78E+02 2.78E+02 -2.61E-02 -0.01%
Pressure (psia) 2.00E+02 2.00E+02 0.00E+00 0.00%
Molar Flow (lbmole/hr) 1.13E+02 1.13E+02 -8.42E-02 -0.07%
Mass Flow (lb/hr) 7.37E+03 7.36E+03 -4.68E+00 -0.06%
Std Ideal Liq Vol Flow (bpd) 7.69E+02 7.69E+02 -4.40E-01 -0.06%
Molar Enthalpy (Btu/lbmole) -5.48E+04 -5.48E+04 -1.30E+01 0.02%
Molar Entropy (Btu/lbmole-F) 2.94E+01 2.94E+01 1.02E-02 0.03%
Heat Flow (Btu/hr) -6.22E+06 -6.22E+06 3.14E+03 -0.05%
Total -0.21%
TEG Recycle
Stream 10 Lean TEG Imbalance Relative Imbalance
Vapour 0.00E+00 0.00E+00 0.00E+00 0.00%
Temperature (°F) 9.50E+01 9.50E+01 0.00E+00 0.00%
Pressure (psia) 6.90E+02 6.90E+02 0.00E+00 0.00%
Molar Flow (lbmole/hr) 4.96E+01 4.98E+01 1.99E-01 0.40%
Mass Flow (lb/hr) 6.92E+03 6.95E+03 2.77E+01 0.40%
Std Ideal Liq Vol Flow (bpd) 4.21E+02 4.22E+02 1.68E+00 0.40%
Molar Enthalpy (Btu/lbmole) -3.24E+05 -3.24E+05 1.31E-01 0.00%
Molar Entropy (Btu/lbmole-F) 3.52E+01 3.52E+01 -1.18E-05 0.00%
Heat Flow (Btu/hr) -1.61E+07 -1.62E+07 -6.44E+04 0.40%
Total 1.60%
The imbalances observed in the recycle functions were primarily energy parameters, except for
the mass flow in the TEG Recycle function. This value was apparently negligible; an imbalance
was not observed in the overall mass balance.
Process Description & Equipment Specifications
Equipment was designed to accommodate the greater demand of 10,000 bpd, for both
the natural gasoline and re-injection and expansion project.
Yotta Designs CHEN 4530 Senior Design Project May 5, 2010
51
Distillation Columns
In the re-injection process there is only one column, which is responsible for the
recovery of natural gasoline at a standard flow rate of 9182 bpd. In the expansion process,
which is capable of recovering natural gasoline, LPG, and sales gas there are a total of five
columns. The purpose of the first distillation column in the separation train (the C5+ Column) is
to separate the heavier hydrocarbons (C5 and above) from the lighter hydrocarbons. An
absorption column and a distillation column are pertinent unit operations within the glycol
dehydration step of the process. The first column in the dehydration step is an absorption
column which acts to remove the remaining water from the process stream by contacting the
stream with a TEG stream. The vapor outlet of the TEG contactor goes on to undergo further
separation to produce LPG and sales gas. The bottoms product from the TEG contactor is the
feed for the TEG regeneration distillation column. The purpose of the TEG regeneration column
is to remove the water from the glycol restoring it to a purity of 99.0 wt%. A refluxed absorber
column is used to separate the heavier hydrocarbons from the sales gas product. The bottoms
stream from the refluxed absorber column is the feed to the LPG recovery distillation column.
The LPG distillation column separates the LPG product from the heavier hydrocarbons (C5+).
The heavier hydrocarbons are then recycled back to the C5+Column.
Estimating Column Pressure and Condenser Type
The column operating conditions are important for obtaining the desired product
specifications. In conjunction with recommendations from Mr. Arendell and Professor Clough,
the diagram in Figure 11 was followed to determine an appropriate column pressure and
condenser type.
Yotta Designs CHEN 4530 Senior Design Project May 5, 2010
52
Calculate bubble-
point pressure (PD)
of distillate at
120°F
Start
Distillate and bottoms
are known or estimated
Calculate bubble-
point pressure (PD)
of distillate at
120°F
PD > 215 psia
Choose a
refrigerant so as to
operate partial
condenser at
415 psia
PD > 365 psia
Estimate bottoms
Pressure
(PB)
PD < 365 psia
Use partial condenser
PD < 215 psia
Use total condenser
(reset PD to 30 psia
If PD <30 psia)
Calculate bubble-
point temperature
(TB) of bottoms at
PB
Lower pressure
PD appropriately
TB > bottoms
decomposition or critical temperature
TB < bottoms
decomposition or
critical temperature
Figure 11. Decision tree to determine column pressures and condenser types.
The final column operating parameters are shown in Table 17 where the number of trays and
feed tray locations were iterated and optimized to reduce the reboiler duty.
Yotta Designs CHEN 4530 Senior Design Project May 5, 2010
53
Table 17. Final column operating temperatures and pressures.
Column
Inlet
Temperature
(o
C)
Inlet
Pressure
(kPa)
Distillate
Temperature
(o
C)
Distillate
Pressure
(kPa)
Bottoms
Temperature
(o
C)
Bottoms
Pressure
(kPa)
C5+
Recovery
19.09 136.6 4171 1379 10.09 1138 213 1207
TEG
Contactor
Absorber
35 20.55 4757 4171 20.90 4089 20.77 4123
TEG
Regeneration
148.6 206.8 122.9 101.3 204 110.0
Sales Gas
Refluxed
Absorber
-40 3516 -39.77 3447 113.9 3516
LPG
Recovery
84.46 1758 45.90 1689 148.9 1758
Calculating Number of Trays
In order to determine the number of trays that each distillation column needs, the
distillation columns were first attempted as shortcut distillation columns in Aspen HYSYS.
However, after being unable to make the columns converge another method was utilized. A
trial-and-error method which included changing the number of trays until the duty of the
condensers and reboilers were minimized was utilized instead. The number of trays that yielded
the minimum duty was chosen as the actual number of trays. The resulting number of trays and
reflux ratios, if applicable, can be seen below in Table 18.
CHEN4530URS2Report
CHEN4530URS2Report
CHEN4530URS2Report
CHEN4530URS2Report
CHEN4530URS2Report
CHEN4530URS2Report
CHEN4530URS2Report
CHEN4530URS2Report
CHEN4530URS2Report
CHEN4530URS2Report
CHEN4530URS2Report
CHEN4530URS2Report
CHEN4530URS2Report
CHEN4530URS2Report
CHEN4530URS2Report
CHEN4530URS2Report
CHEN4530URS2Report
CHEN4530URS2Report
CHEN4530URS2Report
CHEN4530URS2Report
CHEN4530URS2Report
CHEN4530URS2Report
CHEN4530URS2Report
CHEN4530URS2Report
CHEN4530URS2Report
CHEN4530URS2Report
CHEN4530URS2Report
CHEN4530URS2Report
CHEN4530URS2Report
CHEN4530URS2Report
CHEN4530URS2Report
CHEN4530URS2Report
CHEN4530URS2Report
CHEN4530URS2Report
CHEN4530URS2Report
CHEN4530URS2Report
CHEN4530URS2Report
CHEN4530URS2Report
CHEN4530URS2Report
CHEN4530URS2Report
CHEN4530URS2Report
CHEN4530URS2Report
CHEN4530URS2Report
CHEN4530URS2Report
CHEN4530URS2Report
CHEN4530URS2Report
CHEN4530URS2Report
CHEN4530URS2Report
CHEN4530URS2Report
CHEN4530URS2Report
CHEN4530URS2Report
CHEN4530URS2Report
CHEN4530URS2Report
CHEN4530URS2Report
CHEN4530URS2Report
CHEN4530URS2Report
CHEN4530URS2Report
CHEN4530URS2Report
CHEN4530URS2Report
CHEN4530URS2Report
CHEN4530URS2Report
CHEN4530URS2Report
CHEN4530URS2Report
CHEN4530URS2Report
CHEN4530URS2Report
CHEN4530URS2Report
CHEN4530URS2Report
CHEN4530URS2Report
CHEN4530URS2Report
CHEN4530URS2Report
CHEN4530URS2Report
CHEN4530URS2Report
CHEN4530URS2Report
CHEN4530URS2Report
CHEN4530URS2Report
CHEN4530URS2Report
CHEN4530URS2Report
CHEN4530URS2Report
CHEN4530URS2Report
CHEN4530URS2Report
CHEN4530URS2Report
CHEN4530URS2Report
CHEN4530URS2Report
CHEN4530URS2Report
CHEN4530URS2Report
CHEN4530URS2Report
CHEN4530URS2Report
CHEN4530URS2Report
CHEN4530URS2Report
CHEN4530URS2Report
CHEN4530URS2Report
CHEN4530URS2Report
CHEN4530URS2Report
CHEN4530URS2Report
CHEN4530URS2Report
CHEN4530URS2Report
CHEN4530URS2Report
CHEN4530URS2Report
CHEN4530URS2Report
CHEN4530URS2Report
CHEN4530URS2Report
CHEN4530URS2Report
CHEN4530URS2Report
CHEN4530URS2Report
CHEN4530URS2Report
CHEN4530URS2Report
CHEN4530URS2Report
CHEN4530URS2Report
CHEN4530URS2Report
CHEN4530URS2Report
CHEN4530URS2Report
CHEN4530URS2Report
CHEN4530URS2Report
CHEN4530URS2Report
CHEN4530URS2Report
CHEN4530URS2Report
CHEN4530URS2Report
CHEN4530URS2Report
CHEN4530URS2Report
CHEN4530URS2Report
CHEN4530URS2Report
CHEN4530URS2Report
CHEN4530URS2Report
CHEN4530URS2Report
CHEN4530URS2Report
CHEN4530URS2Report
CHEN4530URS2Report
CHEN4530URS2Report
CHEN4530URS2Report
CHEN4530URS2Report
CHEN4530URS2Report

More Related Content

Similar to CHEN4530URS2Report

Wet and dry_scrubbers_section_5_chapter_1_control_cost_manual_7th_edition
Wet and dry_scrubbers_section_5_chapter_1_control_cost_manual_7th_editionWet and dry_scrubbers_section_5_chapter_1_control_cost_manual_7th_edition
Wet and dry_scrubbers_section_5_chapter_1_control_cost_manual_7th_editionTikamChauhan
 
Manufacturing of liquid insulators
Manufacturing of liquid insulatorsManufacturing of liquid insulators
Manufacturing of liquid insulatorsAnkit Agrawal
 
Oil and gas production handbook ed2x3web
Oil and gas production handbook ed2x3webOil and gas production handbook ed2x3web
Oil and gas production handbook ed2x3webAndy Varoshiotis
 
Pressure Vessel Selection Sizing and Troubleshooting
Pressure Vessel Selection Sizing and Troubleshooting Pressure Vessel Selection Sizing and Troubleshooting
Pressure Vessel Selection Sizing and Troubleshooting Karl Kolmetz
 
Water Treatment Unit Selection, Sizing and Troubleshooting
Water Treatment Unit Selection, Sizing and Troubleshooting Water Treatment Unit Selection, Sizing and Troubleshooting
Water Treatment Unit Selection, Sizing and Troubleshooting Karl Kolmetz
 
#VirtualDesignMaster 3 Challenge 3 - Steven Viljoen
#VirtualDesignMaster 3 Challenge 3 - Steven Viljoen#VirtualDesignMaster 3 Challenge 3 - Steven Viljoen
#VirtualDesignMaster 3 Challenge 3 - Steven Viljoenvdmchallenge
 
Tensioned Building Construction - Testing and Validation
Tensioned Building Construction - Testing and ValidationTensioned Building Construction - Testing and Validation
Tensioned Building Construction - Testing and ValidationRobert Lewis
 
James gale internationalbusinessdissertation
James gale internationalbusinessdissertationJames gale internationalbusinessdissertation
James gale internationalbusinessdissertationWahab Babatunde Adesanya
 
Data Center Designs White Paper JKCS (1).pdf
Data Center Designs White Paper JKCS (1).pdfData Center Designs White Paper JKCS (1).pdf
Data Center Designs White Paper JKCS (1).pdfgurkanarifyalcinkaya
 
PIOTR BLAUT Student Placement Report
PIOTR BLAUT Student Placement ReportPIOTR BLAUT Student Placement Report
PIOTR BLAUT Student Placement ReportPiotr Blaut
 
Oil and gas production handbook 2009
Oil and gas production handbook 2009Oil and gas production handbook 2009
Oil and gas production handbook 2009luuguxd
 
Ip aiim anuj rawat
Ip aiim anuj rawatIp aiim anuj rawat
Ip aiim anuj rawatAnuj Rawat
 
Ip aiim anuj rawat
Ip aiim anuj rawatIp aiim anuj rawat
Ip aiim anuj rawatAnuj Rawat
 
RMI Golf Cart Report
RMI Golf Cart ReportRMI Golf Cart Report
RMI Golf Cart ReportMike Penso
 

Similar to CHEN4530URS2Report (20)

Wet and dry_scrubbers_section_5_chapter_1_control_cost_manual_7th_edition
Wet and dry_scrubbers_section_5_chapter_1_control_cost_manual_7th_editionWet and dry_scrubbers_section_5_chapter_1_control_cost_manual_7th_edition
Wet and dry_scrubbers_section_5_chapter_1_control_cost_manual_7th_edition
 
CHEN4520MinorDesign
CHEN4520MinorDesignCHEN4520MinorDesign
CHEN4520MinorDesign
 
Manufacturing of liquid insulators
Manufacturing of liquid insulatorsManufacturing of liquid insulators
Manufacturing of liquid insulators
 
Oil and gas production handbook ed2x3web
Oil and gas production handbook ed2x3webOil and gas production handbook ed2x3web
Oil and gas production handbook ed2x3web
 
Oil and-gas-production-handbook
Oil and-gas-production-handbookOil and-gas-production-handbook
Oil and-gas-production-handbook
 
Pressure Vessel Selection Sizing and Troubleshooting
Pressure Vessel Selection Sizing and Troubleshooting Pressure Vessel Selection Sizing and Troubleshooting
Pressure Vessel Selection Sizing and Troubleshooting
 
Water Treatment Unit Selection, Sizing and Troubleshooting
Water Treatment Unit Selection, Sizing and Troubleshooting Water Treatment Unit Selection, Sizing and Troubleshooting
Water Treatment Unit Selection, Sizing and Troubleshooting
 
#VirtualDesignMaster 3 Challenge 3 - Steven Viljoen
#VirtualDesignMaster 3 Challenge 3 - Steven Viljoen#VirtualDesignMaster 3 Challenge 3 - Steven Viljoen
#VirtualDesignMaster 3 Challenge 3 - Steven Viljoen
 
Final Memo
Final MemoFinal Memo
Final Memo
 
Tensioned Building Construction - Testing and Validation
Tensioned Building Construction - Testing and ValidationTensioned Building Construction - Testing and Validation
Tensioned Building Construction - Testing and Validation
 
CDP FINAL REPORT
CDP FINAL REPORTCDP FINAL REPORT
CDP FINAL REPORT
 
James gale internationalbusinessdissertation
James gale internationalbusinessdissertationJames gale internationalbusinessdissertation
James gale internationalbusinessdissertation
 
thesis
thesisthesis
thesis
 
Flujo multifasico
Flujo multifasicoFlujo multifasico
Flujo multifasico
 
Data Center Designs White Paper JKCS (1).pdf
Data Center Designs White Paper JKCS (1).pdfData Center Designs White Paper JKCS (1).pdf
Data Center Designs White Paper JKCS (1).pdf
 
PIOTR BLAUT Student Placement Report
PIOTR BLAUT Student Placement ReportPIOTR BLAUT Student Placement Report
PIOTR BLAUT Student Placement Report
 
Oil and gas production handbook 2009
Oil and gas production handbook 2009Oil and gas production handbook 2009
Oil and gas production handbook 2009
 
Ip aiim anuj rawat
Ip aiim anuj rawatIp aiim anuj rawat
Ip aiim anuj rawat
 
Ip aiim anuj rawat
Ip aiim anuj rawatIp aiim anuj rawat
Ip aiim anuj rawat
 
RMI Golf Cart Report
RMI Golf Cart ReportRMI Golf Cart Report
RMI Golf Cart Report
 

CHEN4530URS2Report

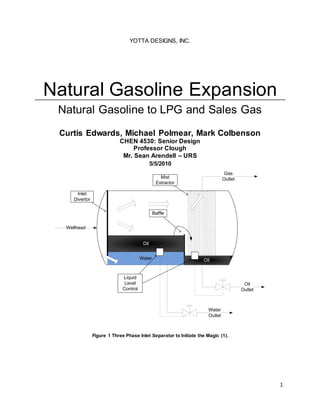
  • 1. 1 YOTTA DESIGNS, INC. Natural Gasoline Expansion Natural Gasoline to LPG and Sales Gas Curtis Edwards, Michael Polmear, Mark Colbenson CHEN 4530: Senior Design Professor Clough Mr. Sean Arendell – URS 5/5/2010 Wellhead Gas Outlet Water Outlet Water Oil Oil Inlet Divertor Mist Extractor Oil Outlet Baffle Liquid Level Control Figure 1 Three Phase Inlet Separator to Initiate the Magic (1).
  • 2. Yotta Designs CHEN 4530 Senior Design Project May 5, 2010 2 Table of Contents Executive Summary.........................................................................................................................6 Project Description and Scope ........................................................................................................7 Problem Statement ......................................................................................................................7 Scope ...........................................................................................................................................8 Design Criteria..............................................................................................................................9 Wellhead Conditions.................................................................................................................9 Wellhead Flow Rate to Facility ...............................................................................................11 Gas Re-Injection .....................................................................................................................11 Pipeline Gas Production Specifications .................................................................................12 Minimum Air Temperature Constraints ..................................................................................12 Product Specifications............................................................................................................12 Economic Considerations.......................................................................................................13 Background Information.................................................................................................................13 The Yamal Megaproject.............................................................................................................13 Definitions...................................................................................................................................15 Natural Gas Processing.............................................................................................................16 Alternatives to the Proposed Process........................................................................................18 Dehydration.............................................................................................................................19 Heat Integration ......................................................................................................................21 Column Optimization ..............................................................................................................22 Refrigeration Cycle .................................................................................................................22 Recycle Operators..................................................................................................................23 Safety, Environmental, and Health Considerations ......................................................................23 Plant Safety (16).........................................................................................................................23 Environmental Concerns (16) ....................................................................................................24 MSDS Summaries......................................................................................................................25 Natural Gasoline (17)..............................................................................................................25 Liquefied Petroleum Gas (18) ................................................................................................26 Natural Gas (19) .....................................................................................................................26 Triethylene Glycol (20) ...........................................................................................................27
  • 3. Yotta Designs CHEN 4530 Senior Design Project May 5, 2010 3 Project Premises and Corresponding Simulation Parameters......................................................27 Design Assumptions ..................................................................................................................28 Economic Assumptions..............................................................................................................29 Overall Process Flow Diagrams ....................................................................................................29 Natural Gasoline Process Flow Diagrams.................................................................................29 Natural Gasoline Expansion Process Flow Diagram ................................................................31 Process Descriptions .....................................................................................................................33 Inlet Separation and Natural Gasoline Recovery ......................................................................33 Natural Gasoline PFD.............................................................................................................33 Natural Gasoline Expansion PFD...........................................................................................33 Approach.................................................................................................................................34 Triethylene Glycol Dehydration..................................................................................................36 Triethylene Glycol Dehydration PFD......................................................................................36 Approach.................................................................................................................................37 Propane Refrigeration Cycle......................................................................................................38 Propane Refrigeration Cycle PFD..........................................................................................38 Approach.................................................................................................................................39 Sales Gas and LPG Recovery...................................................................................................40 PFD.........................................................................................................................................40 Approach.................................................................................................................................41 Material and Energy Balances.......................................................................................................43 Material and Energy Balances...................................................................................................43 Natural Gasoline Process Balances.......................................................................................43 Expansion Process Balances.................................................................................................45 Process Description & Equipment Specifications .........................................................................50 Distillation Columns....................................................................................................................51 Estimating Column Pressure and Condenser Type...............................................................51 Calculating Number of Trays..................................................................................................53 Determining the Dimensions of the Distillation Columns.......................................................54 Distillation Column Costing.....................................................................................................58 Flash Drums...............................................................................................................................59 Three-Phase Separator..........................................................................................................59
  • 4. Yotta Designs CHEN 4530 Senior Design Project May 5, 2010 4 Flash Drums............................................................................................................................61 Heat Exchangers........................................................................................................................62 Design of the Heat Exchangers..............................................................................................63 Pumps ........................................................................................................................................67 Compressors..............................................................................................................................67 Valves.........................................................................................................................................70 Storage Tank..............................................................................................................................71 Utility Summary..............................................................................................................................72 Estimation of Capital Investment and Total Product Cost ............................................................77 Economic Premises ...................................................................................................................77 Venture Guidance Appraisal ..................................................................................................77 Variable Costs.........................................................................................................................78 Fixed Costs.............................................................................................................................79 Cash Flow...............................................................................................................................79 Capital Investment .....................................................................................................................80 Cost Indices ............................................................................................................................80 Commodity Chemicals............................................................................................................81 Total Permanent Investment (TPI) .........................................................................................81 Working Capital (WC).............................................................................................................91 Operating Cost...........................................................................................................................91 Variable Cost ..........................................................................................................................92 Fixed Cost...............................................................................................................................95 Profitability Analysis.......................................................................................................................99 Profitability................................................................................................................................ 100 Cost of Capital ...................................................................................................................... 100 Net Present Value................................................................................................................. 100 Internal Rate of Return ......................................................................................................... 100 Return on Investment ........................................................................................................... 100 Break-Even Point.................................................................................................................. 101 Benefit-Cost Ratio................................................................................................................. 101 Depreciation.......................................................................................................................... 101 Salvage Percent ................................................................................................................... 102
  • 5. Yotta Designs CHEN 4530 Senior Design Project May 5, 2010 5 Accounts Receivable............................................................................................................ 102 Corporate Income Tax.......................................................................................................... 102 Cash Flow Analyses ............................................................................................................. 102 Sensitivity Analysis................................................................................................................... 112 Present ROI and IRR for a +/- 100% Variation in TPI ......................................................... 112 Present ROI and IRR for a +/- 100% Variation in Fixed Operating Cost ............................ 113 Conclusion ...................................................................................................................................113 Bibliography .................................................................................................................................115 Appendix A: Acronyms................................................................................................................. 118 Appendix B: Chemical Information .............................................................................................. 120 LPG MSDS (18)............................................................................................................................ 120 Natural Gas MSDS (19)................................................................................................................ 124 Natural Gasoline MSDS ............................................................................................................... 130 Propane MSDS............................................................................................................................ 130 TEG MSDS (20)............................................................................................................................ 130 Appendix C: Engineering Calculations ........................................................................................ 137 Design ......................................................................................................................................137 Costing .....................................................................................................................................160 Natural Gasoline Process.....................................................................................................160 Natural Gasoline Expansion Plant Process ......................................................................... 164 Appendix D: Computer Process Modeling .................................................................................. 173 Aspen HYSYS.......................................................................................................................... 173 Appendix E: Economic Spreadsheets......................................................................................... 174 Total Capital Investment .......................................................................................................... 174 Natural Gasoline Process ........................................................................................................ 175 Natural Gasoline Expansion Plant ........................................................................................... 181
  • 6. Yotta Designs CHEN 4530 Senior Design Project May 5, 2010 6 Executive Summary Natural gas processing represents an opportunity to exploit natural resources to provide energy sources for a profit. The Yamal Peninsula contains a significant and valuable reserve for the Russian economy. The objective of this project was to design two processes that separate natural gasoline from a natural gas wellhead. Whereas the first process re-injects the overhead streams back into the well, the second process expands the initial process to negate re-injection and instead separate the overhead products into sales gas and liquefied petroleum gas (LPG) product streams. These products are nearly equal in value to natural gasoline, with selling prices of $50/bbl and $55/bbl, respectively, as compared with natural gasoline at $80/bbl. Both processes yield approximately 10,000 bpd of natural gasoline, a scaled-up value from the 2,500 bpd that were initially being produced. Product specifications are stringent for safety and energetic quality purposes. Design specifications ensure that machinery functions in the extreme climate encountered above the Arctic Circle. All design and product specifications were met, including the mitigation of hydrate formation. Plant safety and environmental considerations were characterized and deemed achievable through diligent planning and adherence to local and federal laws. The economics of the two processes were estimated for a 15-year plant lifetime with one design year and two years of construction. In the following summaries, economic parameters of the natural gasoline and re-injection process will precede those of the expansion process to produce the additional product streams. The total permanent investments were $170,600k and $36,600k, respectively. The expansion process equipment was designed to use the reinjection process equipment, thus realizing significant savings in investment. The internal rates of return with the aforementioned selling prices were 52% and 164%, respectively. The break-even points were during the first year of operation, the startup year for both processes. The benefits- cost ratios were 14 and 67, respectively. For these reasons, the expansion process presents favorable profitability, assuming that the well capacity remains fruitful and the selling prices remain competitive. Several improvements to the process merit further consideration. Dehydration technology exists to minimize the product water content if the specifications change upon integration with the approaching pipeline. Each of the distillation columns contains a reboiler and condenser that could be integrated into a heat exchange network that contains process
  • 7. Yotta Designs CHEN 4530 Senior Design Project May 5, 2010 7 streams in an effort to reduce utility costs. The execution of the current design may be improved by tightening convergence tolerances on columns and recycle functions. Project Description and Scope A plethora of natural gas reserves exist on and offshore of the Yamal Peninsula in Northern Siberia, Russia. One of the clients of URS was initially recovering natural gasoline from three wells on this peninsula, though due to the absence of a natural gas pipeline in the area, they were flaring the excess natural gas. This client planned to expand their facility to quadruple their production of natural gasoline, and initiate the recovery of liquefied petroleum gas (LPG) and natural gas upon the imminent arrival of a natural gas pipeline. However, due to the volatile nature of the Russian economy and the high cost of energy the client desired to accomplish this expansion with minimal capital investment (2). Problem Statement Prior to the facility expansion project the client was producing natural gasoline from the three remote wells. These wells are located far above the Arctic Circle on the Yamal Peninsula in Northwestern Russia. There is little infrastructure in place in the area, and the natives sustain themselves by hunting and fishing. The facility was producing approximately 2,500 BPD of natural gasoline and burning all of the excess gas. The expansions made to the facility were to consist of two phases. In the first, the production of natural gasoline was to be increased to 10,000 BPD and the excess gas was to be re-injected back into the reservoir instead of flared. As a natural gas pipeline was being routed to the area and was to be in place within five years after the initiation of the expansion, the second phase was to consist of the modification of the existing facility to include extra processing equipment to separate and produce LPG and pipeline-quality natural “sales” gas from the previously re-injected gas. The remote location of the facility necessitated the consideration of several additional factors that affected the design of the gas processing plant modifications. The most notable of these was the extremely cold winter temperatures experienced at the location of the plant. The wellheads are located in a region where permafrost exists, so the wellhead pipelines were routed aboveground on piers to avoid degradation of the permafrost, and the equipment had to be designed to a -60 °F design temperature. Also, due to the fact that electric power was
  • 8. Yotta Designs CHEN 4530 Senior Design Project May 5, 2010 8 unavailable at the site, natural gas engine-driven compressors were to be utilized for gas re- injection. These were provided by Caterpillar, who has a presence in Siberia (2). Scope The first phase of the project was to involve the design of equipment to separate the hydrocarbon liquids, water, and natural gas in the feed stream, to stabilize the hydrocarbon liquids to shipping specifications, and to re-inject the residue gas back into the reservoir as illustrated by the block flow diagram shown in Figure 2. Inlet Separation C5+ Recovery Hydrocarbons Water Overheads Wellhead Compression Re-Injection C5+ $ -$ -$ Figure 2. Block flow diagram for natural gasoline production facility This process is hereafter to be referred to as the natural gasoline process. Subsequent to the arrival of the natural gas pipeline, the plant modifications were to include equipment to dehydrate the gas, reduce its hydrocarbon dew point, and compress it for delivery to the pipeline. From the initial plant configuration the design was to be made easily convertible to production of pipeline-quality gas. The block flow diagram for the facility following the second plant modification, hereafter to be referred to as the natural gasoline expansion process or simply the expansion process is shown in Figure 3.
  • 9. Yotta Designs CHEN 4530 Senior Design Project May 5, 2010 9 Inlet Separation C5+ Recovery Hydrocarbons Water Overheads Wellhead Dehydration C5+ Dry Gas Water LPG Recovery Sales Gas LPG C5+ Recycle $ $ $ TEG Compression -$ -$ Refrigeration HX Cooled Dry Gas Propane Figure 3. Block flow diagram for natural gasoline, sales gas, and LPG production (natural gasoline expansion process) The reduction in hydrocarbon dew point was to take place within the LPG recovery separation train. Additional requirements of the project included identifying and evaluating process alternatives, identifying all the assumptions necessary for the design, and delineating the requirements for the storage, shipping, and utility systems (2). Taken together, these factors yielded a profitability analysis that favors expanding the process to produce sales gas and LPG. DesignCriteria The following criteria and specifications were provided for the gas processing facility expansion (2). Wellhead Conditions The conditions at the wellhead and inlet of the process are given in Table 1.
  • 10. Yotta Designs CHEN 4530 Senior Design Project May 5, 2010 10 Table 1. Process inlet conditions Inlet Conditions Wellhead Pressure (bar g) 150 Wellhead Temperature Range (°F) 20 - 50 Process Inlet Pressure (bar g) 103 The wellhead compositions are listed in Table 2. Table 2. Composition of the wellhead stream (excluding water) Composition Component Mole % N2 0.405 CO2 0.305 CH4 86.121 C2H6 6.637 C3H8 2.484 iC4H10 0.359 nC4H10 0.415 C5+ 3.274 COS/CS2 0.0 H2S 0.0 For the 3.274 mol % of the wellhead stream that is composed of C5+, ASTM D86 data were given, which is shown in Table 3. ASTM D86 is a standard distillation-based assay used to characterize petroleum, in which the temperature is recorded at which successive fractions of the oil mixture have evaporated.
  • 11. Yotta Designs CHEN 4530 Senior Design Project May 5, 2010 11 Table 3. ASTM D86 oil characterization assay data of C5+ at wellhead ASTM D86 Assay Percent Evaporated (% Liquid Volume) Temperature (°C) Bubble Point 38.7 10 64.3 20 83.7 30 99.7 40 112 50 129 60 148.7 70 171.3 80 214.7 90 281 End Point 295 The data in Table 4 were also given for the C5+ content at the wellhead. Table 4. Physical data for the C5+ at the wellhead Natural Gasoline (C5+) Density (g/cm3 ) 0.731 Average MW (Da) 101 Wellhead Flow Rate to Facility The gas flow rate from the wellhead was to be determined based on a natural gasoline (C5+) standard production rate of approximately 10,000 BPD. The flow rate of water in the wellhead was to be found based on 1.5 bbl of water produced for every MMSCF of gas flow from the inlet separator. Gas Re-Injection Before the plant modifications for LPG and natural gas recovery were implemented, in the first phase of the facility expansions, gas was to be re-injected into the well at a pressure of 180 bar g.
  • 12. Yotta Designs CHEN 4530 Senior Design Project May 5, 2010 12 Pipeline Gas Production Specifications After the facility expansion for the production of LPG and sales gas, in the second phase of the project, the sales gas was specified to have a hydrocarbon dew point of not more than 0 °F at a pressure of 55 bar g. Minimum Air Temperature Constraints Owing to the frigid climate of the Siberian Yamal Peninsula the process and mechanical design was to allow for a minimum air temperature of -60 °F. Furthermore, all equipment was to be designed from low-temperature carbon steel impact tested to -65 °F. And finally, any air coolers were to be designed for the use of air at 85 °F to account for the hottest ambient air temperature that would likely be reached during the summer months. Product Specifications The criteria for the purity and production rate of natural gasoline were based on Reid Vapor Pressure (RVP), a common measure of purity in the natural gas processing industry, and standard flow rates, as illustrated in Table 5. Table 5. Natural gasoline purity and flow rate product specifications Natural Gasoline (C5+) Max Reid Vapor Pressure (RVP in psia) 10 Min Standard Flow rate (BPD) 8,000 Design Standard Flow rate (BPD) 10,000 Max Standard Flow rate (BPD) 11,000 The LPG product was to be characterized as having a True Vapor Pressure (TVP) of 210 psia at 100 °F, and a C5+ content of no more than 2.0% by volume. Finally, the sales gas product specifications were to be based on Hydrocarbon (HC) dew point, the temperature at which hydrocarbons begin condensing out of the gas, as well as the CO2 and H2O content of the gas as shown in Table 6.
  • 13. Yotta Designs CHEN 4530 Senior Design Project May 5, 2010 13 Table 6. Sales gas purity product specifications Sales Gas (Natural Gas) Max Hydrocarbon Dew Point (°F) 0 Max CO2 Content (Mole %) 2.0 Max H2O Content (lbs/MMSCF) 4 Economic Considerations The sales prices of each of the three products were given and tabulated in Table 7. Table 7. Sales prices of products Product Sales Prices Sales Gas $50/bbl $1.19/US gal LPG $55/bbl $1.31/US gal Natural Gasoline $80/bbl $1.90/US gal Also, the operating cost of gas re-injection was given as $1.50/1000 SCF, and the future gas sales price was given as $4/MMBTU. Background Information In order to better understand the expansions that were to be made to the operating natural gas processing facility it was useful to situate this expansion within the Russian economic and political climate in the area, to research natural gas processing and the unit operations that are utilized in the industry and the proposed process, and several processing alternatives. The Yamal Megaproject Owing to the fact that the gas reservoir to be modified is located on the Yamal Peninsula in Northern Siberia, Russian Federation, information on the nature of Russian gas reserves and the economic and political climate in which the project will take place are relevant concerns.
  • 14. Yotta Designs CHEN 4530 Senior Design Project May 5, 2010 14 Russia currently supplies one quarter of Europe’s natural gas, and plans to expand in this market (3). However, over the last several years Russia has lost credibility with many of the former Soviet Union countries and Europe as a reliable supplier of natural gas. In January of 2006 Russia cut off the gas supply to Ukraine and Moldova, and in late 2006 threatened to cut supplies to Belarus and Georgia over pricing disputes (4). Then, again, in January of 2009, fueled by ongoing political tensions between the two countries, Russia curtailed the flow of gas through Ukraine during a particularly cold period of the winter, affecting in particular the Balkans and Eastern Europe (3). These and other similar instances have encouraged some countries to seek other sources of natural gas, and have incited criticism of Russia as using energy as a political tool (4). However, petroleum and natural gas are vital to the Russian economy, and Russia plans to further develop and expand the industry largely through the utilization of the Yamal Peninsula. There are plans to increase production of natural gas from the peninsula by a factor of almost 42 from 2011 to 2030, a reflection of the vast gas reserves present in the area (5). Russia owns approximately one third of the world’s gas reserves, which according to the International Energy Agency consisted of 46.9 trillion cubic meters (tcm) of proven and probable reserves at the beginning of 2001 (6). In the North Siberian Yamal Peninsula and adjacent areas 11 gas and 15 oil, gas, and condensate fields have been discovered which contain approximately 16 tcm of gas according to exploration and preliminary estimates. These fields have even been projected to contain as much as 22 tcm of gas reserves (5). The majority of these fields are owned and licensed to the corporation Gazprom, which is pursuing their development under the ‘Yamal Megaproject.’ Gazprom is “one of the world’s largest energy companies,” and holds a monopoly in the Russian gas market (5) (3). It is owned largely by the Russian government, though is a privatized company which specializes in geological exploration, the production, transportation, storage, processing, and marketing of hydrocarbons, and the marketing of heat and electric power (5). In a 2007 initiative, Gazprom, in collaboration with the Yamal-Nenets Autonomous Okrug (YaNAO) Administration, amended a 2002 draft program for the development of the peninsula’s gas reserves with the aim of the expansion of the reserve fields and the construction of gas pipelines on the Yamal Peninsula. The initiative plans for the launch of drilling at several of the fields, the further development of the production capacities of the existing operational fields, and the construction of a 2,500 km gas pipeline system. The company purports to be taking into consideration the myriad environmental and social responsibility issues that the
  • 15. Yotta Designs CHEN 4530 Senior Design Project May 5, 2010 15 project warrants including pollution concerns and the welfare of the indigenous people and wildlife. Due to the fact that the Yamal Peninsula is the most explored region for gas production, is located near existing gas pipelines, and has significant reserves, Gazprom regards the Yamal Megaproject as central to the development of the Russian economy (5). Definitions There are three product streams from the proposed process, these being natural gasoline, liquefied petroleum gas, and natural gas. Each of these distinct products requires definition.  Natural Gasoline (C5+) – Natural gasoline is a liquid product consisting of pentane, and all of the hydrocarbons heavier than pentane. For the purposes of this project the purity of this product stream is defined by a Reid Vapor Pressure of 10 psia at 100 °F, and its temperature was to be as close to an upper limit of 400 °F as possible to meet common shipping requirements (2).  Liquefied Petroleum Gas (LPG) – LPG is a liquid product consisting primarily of propane, n-butane, and isobutane. The purity specifications for this product are a maximum True Vapor Pressure of 210 psia at 100 °F and a C5+ content of no more than 2.0 % by volume (2).  Natural Gas (Sales Gas) – Natural gas must meet certain quality specifications before injection into a pipeline to ensure that the pipeline operates properly. Gas that does not meet specification can lead to deleterious hydrate formation, operational problems in the pipeline, pipeline deterioration, or even pipeline rupture (7). These quality measures often include specifications on the energy content of the gas per volume, its hydrocarbon dew point temperature, maximum levels of contaminants such as hydrogen sulfide, carbon dioxide, nitrogen, water vapor, and oxygen, and maximum amounts of particulate solids and liquid water, as these can damage the pipeline (7). For the expansion of the relevant natural gas processing plant the quality measures required to be met included a hydrocarbon dew point of no more than 0 °F, a CO2 content of no more than 2.0 mol %, and a maximum water content of 4 lbs/MMSCF of gas (2).
  • 16. Yotta Designs CHEN 4530 Senior Design Project May 5, 2010 16 Natural Gas Processing Natural gas exists in a variety of forms, its composition depending on the type, depth, and location of the deposit as well as the geology of the area in which it is tapped. Oil and natural gas are often found in the same reservoir, and natural gas is classified as associated- dissolved when dissolved in crude oil, or non-associated when it occurs in the absence of oil. The relevant raw gas being gathered for the proposed process is non-associated. The raw gas most often consists of two to eight carbon hydrocarbons that are gaseous at underground pressures, though condense to liquid at atmospheric pressure. These liquids are called condensates or natural gas liquids (NGLs). The recovery of NGLs can involve any of several initial processing steps depending on the particular composition of the well (7). Due to the myriad possible compositions of the raw gas, these initial processing steps can be quite complex. Producing areas can contain hundreds of wells, from which gas and NGL is “gathered” via small-diameter pipes that connect the well to processing facilities. At the wellhead the gas is often put through scrubbers to remove sand and any particulate matter and/or heaters to ensure that the temperature does not drop low enough for hydrates to form in the stream. Hydrates are crystalline, ice-like solids that form with the water vapor in the stream, and can pose serious risks to the process, as they have the potential to clog the valves and pipes that the gas passes through during processing, thus leading to dead-heads. They form within a certain temperature/pressure envelope, oftentimes above the freezing point of water, the limits of which are dependent on the composition of the stream. Therefore, the avoidance of hydrate formation was a concern in the design of the proposed process. The various streams gathered at a given site can require differing initial processing steps including heating, compression, scrubbing, carbon dioxide removal, and sulfur removal, contributing to the complexity of the gathering process. After these steps are taken, the further processing steps that are commonly performed include, but are not limited to the following (7). Gas-Oil Separation When natural gas is associated with crude oil it is first necessary to separate the gas from the oil. Oftentimes pressure relief at the wellhead alone accomplishes this separation, and just a simple closed tank is required. However, sometimes a multi-stage separation train is required, in which a series of cylindrical shell, horizontal tanks are commonly utilized. These
  • 17. Yotta Designs CHEN 4530 Senior Design Project May 5, 2010 17 include an inlet at one end, and top and bottom outlets for gas and oil respectively. Separation is effected by compressing and expanding the feed between tanks, causing heating and cooling of the stream (7). As mentioned previously, the wellhead stream for the proposed process consists of non-associated gas, eliminating the need for this step. Condensate Separation Condensate separation is most often accomplished through the use of mechanical separators. It is at times preceded by a slug catcher to remove any free water from the wellhead stream, and is usually employed when gas-oil separation is not required (7). In the proposed process this step is carried out by the three phase separator unit. Dehydration It is necessary to remove any free water from the natural gas stream to avoid the formation of hydrates in the process. The most common method of dehydration, and the one employed in the proposed process, is absorption of water by glycol, though a variety of other processes have been used, several of which will be discussed in the Alternatives to the Proposed Process section. Triethylene glycol is the most common type of glycol used for this purpose (7). Contaminant Removal Contaminants that must be removed during processing include hydrogen sulfide and other sulfur-containing compounds, carbon dioxide, water vapor, helium, and oxygen. To remove sulfurous compounds flow is often directed through a tower containing a solution of amines. The amines absorb sulfur compounds from the gas stream, and have the advantage of being able to be used repeatedly. Desulfurization can then be followed by a series of filter tubes where gravity, centrifugal force, and flocculation of particulates elicit the removal of other stream contaminants (7). As the wellhead feed stream in the proposed process does not contain sulfurous compounds, helium, or oxygen, and carbon dioxide is present at acceptable levels, this step was not required. Nitrogen Extraction Nitrogen, the excessive presence of which can lower the energy content of the gas, is most often removed from natural gas streams via a nitrogen rejection unit (NRU), which also works to further dehydrate the gas using molecular sieve beds. Separation can occur through
  • 18. Yotta Designs CHEN 4530 Senior Design Project May 5, 2010 18 the use of cryogenic methods, a column, and a brazed aluminum plate fin heat exchanger, or by an absorbing solvent (7). Once again, since nitrogen was present at acceptable levels in the wellhead inlet stream to the proposed process, this step was not needed. Methane Separation Methane is the primary component of sales gas, and can be separated from natural gas streams either as part of the NRU unit or in a separate unit operation. If done separately, there are two primary methods that are utilized for this purpose, these being cryogenic methods and absorption. The cryogenic approach, which is better at extracting the lighter liquids in the stream, such as ethane, is accomplished by lowering the temperature of the gas stream to around -120 °F. This is often done through the use of a turbo expander in combination with external refrigerants, and results in the condensation of all stream components besides methane. The absorption method can be carried out by using absorption oil to absorb the majority of the NGLs, which are subsequently distilled from the absorbing liquid oil (7). In the proposed process the use of absorption oils was unnecessary, and methane separation was achieved by the Sales Gas refluxed absorption column. Fractionation Fractionation is the process of separating the various NGLs by virtue of the differing boiling points of the hydrocarbons in the stream. This is generally done through successive distillation of the NGL stream, though to produce LPG in the proposed process just a single distillation column was required (7). Which of these steps are performed depends on the composition of the raw gas, and multiple steps can be performed in a single unit operation, or at different locations (7). Alternativesto the ProposedProcess In modeling the natural gasoline with re-injection and natural gasoline expansion processes, a number of process alternatives were identified and considered. These included both alternative processes to those utilized to simulate these two natural gas processing plant configurations, as well as methods for eliminating various assumptions and simplifications that were utilized. A description of each process alternative is outlined below.
  • 19. Yotta Designs CHEN 4530 Senior Design Project May 5, 2010 19 Dehydration Glycol Fluids Package The Peng-Robinson fluids package was utilized to model both the natural gasoline with re-injection and natural gasoline expansion processes. This fluids package is ideal for the modeling of non-polar hydrocarbons, of which the vast majority of the process streams consist; however, as triethylene glycol (TEG) is hydrophilic, it is not always modeled well by this package (8). It was therefore considered to use the glycol fluids package in Aspen HYSYS for the TEG dehydration cycle (9). This matter was discussed with Mr. Arendell, though for the conditions and purposes of this simulation it was determined that the modeling of this cycle by the Peng-Robinson fluids package would be sufficient. Mr. Arendell noted that the simplifying assumption that the Peng-Robinson package accurately modeled TEG dehydration could result in an underestimate of the amount of water absorbed by the TEG. Nevertheless, the amount of water in the final sales gas stream came out to be about half of the maximum given specification of 4 lbs/MMSCF, which was deemed an appropriate tolerance for any extra water that may have been present in the stream due to an underestimate in its removal during dehydration. Drizo® The effectiveness with which a TEG dehydration cycle removes water from a natural gas stream is dependent on the purity of the glycol upon regeneration. The GPSA section 20 on dehydration quotes an achievable TEG purity of 98.6 wt% by reboiling TEG at 400°F at atmospheric pressure (8). However, the proposed process achieves a purity of 99.0 wt% TEG by reboiling at just below 400°F and just above atmospheric pressure. This very small discrepancy may be due to the fact that TEG is modeled by the Peng-Robinson fluids package rather than the glycol package, as discussed in the Glycol Fluids Package section; though as the quoted value is nearly reproduced, the use of the Peng-Robinson package is further justified. Various enhanced glycol recovery processes exist, each of which is based on the principle of reducing the effective partial pressure of water in the vapor space of the lean (water- deficient) glycol stream, allowing for higher glycol concentrations to be obtained at the same temperature (8). This results in a greater water dew point depression than can generally be achieved. The Drizo® process is among these enhanced dehydration processes. The process regenerates glycol by solvent stripping as opposed to the conventional gas stripping that is ordinarily employed (10). The solvent is obtained from the natural gas itself, and is composed of paraffinic and aromatic hydrocarbons (BTEX) that exhibit a C5+ boiling point
  • 20. Yotta Designs CHEN 4530 Senior Design Project May 5, 2010 20 range (10) (8). In the regeneration column for the process, heavy hydrocarbons and water are condensed from the overhead while non-condensable species are vented to the atmosphere nearly free of BTEX. The condensed hydrocarbons are separated from the water, vaporized, and superheated before being routed to the lean-glycol stripping column where they serve as the stripping gas (8). This results in glycol purities of up to 99.998 wt% according to the manufacturer, yielding water dew point depressions of upwards of 100 °C (10). The process can even be supplemented with drying of the solvent by a solid desiccant, which can yield glycol purities of as high as 99.999 wt% and water dew point depressions of 121 °C (8). Aside from the fact that this process is exceedingly complicated to model, the extent of glycol regeneration achieved and the water dew point depressions reached are unnecessary to meet the sales gas purity specifications of 4 lbs/MMSCF of water and a hydrocarbon dew point of 0 °F for the proposed process (11). While the Drizo® dehydration system seems well-suited to applications with very stringent water removal criteria, its implementation in the proposed process was deemed superfluous. Coldfinger® Another proprietary process for achieving enhanced glycol purities upon regeneration is the Coldfinger® process. In this process, a bundle of condensing tubes (the cold finger), in which rich TEG is commonly utilized as the coolant, is inserted into the vapor space of a surge tank half full of lean TEG. The cold finger continuously condenses equilibrium water vapor, which is discharged from the unit via a collecting trough placed beneath the finger. This continuous condensation maintains the partial pressure of water in the vapor below its equilibrium vapor pressure, which works to further draw water out of the lean TEG liquid phase. The process results in glycol regeneration of upwards of 99.7 wt% TEG in the lean glycol stream (8). Due to the fact that this process is not in equilibrium, while Apsen HYSYS models all unit operations as if they were in equilibrium, the Coldfinger® process could not be easily modeled using this software (11). And further, the extent of glycol regeneration achieved was again deemed unnecessary to reach the water removal specifications required by the natural gasoline expansion process. Advanced Prism® Membranes A fairly novel process for natural gas dehydration is membrane separation technology. Advanced Prism® Membranes utilize the principle of selective gas permeation, in which the
  • 21. Yotta Designs CHEN 4530 Senior Design Project May 5, 2010 21 driving force for separation is differing gas partial pressures on either side of a membrane, to separate water from a natural gas stream (12). These units consist of bundles of hundreds of thousands of hollow-fiber membranes enclosed in a pressure-rated casing. The gas to be dehydrated is passed through this casing on the outside of the hollow fibers. Due to the faster permeation rate of water through these membranes as compared with the hydrocarbons in the stream, water diffuses through to the inside of the fibers, in which a lower pressure is maintained. The many fibers provide a large area for membrane separation, resulting in significant water removal from the stream. These separators can be arranged in parallel, in series, or in a cascade fashion, and can yield gas streams of up to 98% purity (13). These units have the potential to incur lower maintenance costs and operate with less downtime than comparable dehydration units as there are no moving parts involved in the separation. In addition, raw material costs can be lowered through the use of membrane separation as no chemical inventory is required for their operation (12). While membrane-based dehydration systems show much potential for the economic dehydration of natural gas, this avenue was not pursued due to the impossibility of modeling these units in Aspen HYSYS. However, this technology could provide a very viable option for dehydration in similar natural gas recovery processes to the proposed processes. Heat Integration The implementation of a heat exchange network to minimize the utilization of process utilities was investigated in designing the proposed processes. However, heat integration among utility streams was determined to be infeasible given the thermal properties of these streams. For instance, the chilled water that is used in the condensers of each column, after being heated to 90 °F, no longer possesses enough of a cooling capacity to be used for any other heat exchange processes. Similarly, the low and high pressure steam utilized in the reboilers of each of the columns, after being condensed, no longer possesses enough of a heating capacity to be used for any other heat exchange processes. Any feasible heat integration that could be performed on the proposed processes would have to involve process streams as opposed to solely utility streams. Though, due to inexperience in the natural gas processing industry, this option was not considered. A possible route for heat exchange would be to use the overhead from the sales gas column to cool the inlet to this column as mentioned by Mr. Arendell. Another option brought up by Mr. Arendell would be to use the hot C5+ product stream to run the reboiler of one of the other distillation
  • 22. Yotta Designs CHEN 4530 Senior Design Project May 5, 2010 22 columns. While configurations like these have the potential to reduce the utility costs of the plant, process stream heat integration greatly complicates the startup and control of the given processes (14). For this reason a cost/benefit analysis would need to be performed in order to determine if this type of heat integration would be economical without overcomplicating the control systems for the processes. A final process alternative relating to heat exchange that was considered was the expansion of the propane refrigeration cycle to include cooling streams to each of the column condensers. As the propane, which is recycled, would replace non-recycled cooling water utilities in each of these condensers, this option may have provided an economic advantage to the proposed natural gasoline expansion process, however, without a full economic analysis on this expanded refrigeration cycle, its economic feasibility cannot be determined. Unfortunately, time constraints did not permit proper investigation of this alternative. Column Optimization Due to the numerous variables involved in distillation and absorber column design there are a plethora of alternate configurations that each of these could assume. For example, columns could have different numbers of trays, pressures, inlet temperatures, etc. Nonetheless, by adjusting column parameters such that the design specifications were met, the column designs were optimized towards the designs that would actually be implemented in industry. Further optimization was performed by changing the number of trays and the feed tray location such that reboiler duties were minimized, thus minimizing the amount of heating utility required to run the column. Finally, the feed tray was chosen based on matching the temperature of the inlet stream to the inlet tray temperature as closely as possible. This provides for a smoother temperature profile up the length of the column and allows for better control of column dynamics upon disturbances (14). The design of each of the distillation and absorption columns was honed throughout the project by conversations and parameters suggested by Mr. Arendell and Professor Clough. Refrigeration Cycle The propane in the propane refrigeration cycle was modeled as pure propane; however, this is not entirely accurate. In actuality, refrigeration-grade propane consists of 98% propane and 2% ethane by weight (15). While this simplifying assumption may have resulted in the modeling of the processes in this cycle slightly differently due to the different composition of this exchange fluid, it was determined upon the discovery of the actual composition of refrigeration
  • 23. Yotta Designs CHEN 4530 Senior Design Project May 5, 2010 23 propane that modeling it as pure propane would be sufficient for the proposed process. However, to model the heat exchange more accurately in this aspect of the simulation, the correct composition of refrigeration-grade propane would need to be used. Recycle Operators Two recycle operators were used in the design of the natural gasoline expansion process, one in the TEG dehydration cycle and one that recycles C5+ back from the LPG recovery column to the C5+ column. During the implementation of these operators into the design, the performance of intermittent mass and energy balances was overlooked, and these were performed only when the natural gas expansion process was complete. It was then discovered that the sensitivities for mass and energy flows aligning with one another on either side of the recycle operators were not tight enough, resulting in a 5.6 % discrepancy in the energy balance on the process. However, in attempting to tighten the tolerances of the recycle operators it was found that this was impossible with a complete process including two of these operators, and Aspen HYSYS was unable to converge with tightened tolerances. While unfortunate, this discrepancy does not invalidate the proposed process as the mass balance was very nearly closed. Though in modeling similar processes, it is advisable to tighten the tolerances for mass and energy flows on any recycle operators while the process is being modeled, rather than at the end, when it is already complete. Safety, Environmental, and Health Considerations Natural gas processing presents a wide variety of safety, environmental, and health considerations. These are reviewed herein. PlantSafety (16) In order to safely operate a natural gas processing plant it is of the utmost concern that all industry safety standards and protocols are strictly adhered to. Basic safety measures such as extensive personnel training for the operation of equipment containing flammable and explosive hydrocarbons under high pressures and at high temperatures must be implemented. All equipment should be preventatively maintained on a regular schedule. The control systems of the plant should be optimized for safety, and backup and emergency shutdown systems should be included for all major unit operations. Systems should be in place to monitor all equipment for leaks, fluid levels, pressure and temperature, such that any irregularities will quickly become evident before any situations become critically dangerous. Risk assessment
  • 24. Yotta Designs CHEN 4530 Senior Design Project May 5, 2010 24 protocols should be in place to identify and evaluate any and all potential risks associated with new or modified process equipment. Also, emergency response procedures should be in place for any emergency that might occur. Furthermore, the operation of a natural gas processing plant in particular requires that concern be paid to various extra safety matters relating to flammability, fire, and explosions. Again, all industry standard protocols regarding these risks should be followed with care. Processes should be appropriately segregated from flammable product storage areas, or if this cannot be achieved, blast walls should be implemented where they are necessary. The plant should be designed such that potential ignition sources are avoided, such as the elimination of fixtures that could leak flammable material onto or near heated piping or equipment. Finally the specific dangers associated with each flammable material in the process should be known and accounted for. For instance, pressurized flammable gasses can result in jet fires, while flammable liquid spills can lead to pool fires. The specific dangers of the hydrocarbons and chemicals employed in the proposed processes will further be outlined in the MSDS summary section below. EnvironmentalConcerns (16) There are several environmental concerns associated with natural gas processing including fugitive emissions, gas flaring, and wastewater treatment, each of which will be implemented in the proposed processes. Gas release to the environment is common in natural gas processing. Fugitive gas emissions to the environment can occur from leaks in piping, valves, flanges, or other process connections. In addition, emissions can occur during the loading and unloading of any hydrocarbon streams or products. These emissions, which can include greenhouse gasses, can be minimized through the installation of monitoring systems as well as by the maintenance of stable tank pressures and vapor spaces. Oftentimes flammable gasses are flared from natural gas processes either for byproduct disposal or as a safety measure for emergencies. The proposed natural gasoline expansion process includes a Flare Gas stream in the TEG regeneration cycle. For the sake of safety as well as the prevention of the release of greenhouse gasses to the atmosphere, this process should be carried out in the most controlled manner possible.
  • 25. Yotta Designs CHEN 4530 Senior Design Project May 5, 2010 25 Wastewater treatment is also a concern for streams that are contaminated with hydrocarbons or other chemicals. In the proposed processes the water separated from the inlet separator, Water 1, as well as the overhead to the TEG Regeneration column, Water 2, are wastewater streams. These would be treated with an onsite wastewater treatment unit, such that no contaminated liquids were released into the environment. In addition, all plants that deal with wastewater treatment should include secondary containment basins with impervious surfaces to further prevent the release of deleterious compounds into groundwater or soil. MSDSSummaries The pertinent points of the MSDS for each of the products and chemicals in the process are given below. While this information provides many of the key relevant safety issues involved with working with these chemicals, it DOES NOT substitute for the actual MSDSs. These should be reviewed and kept in an accessible location at the plant. It is to be noted that the hazards of propane will not be summarized, as propane is present in significant quantity in LPG, and the hazards can therefore be assumed to be the same as for LPG. Natural Gasoline (17)  May contain benzene, cyclohexane, xylene, and/or toluene o Can be carcinogenic due to presence of benzene  Clear, colorless liquid with a distinct hydrocarbon odor  Flash point: -45 °F  Extinguishing media: dry chemical, foam, carbon dioxide  Unusual fire and explosion hazards: o Flames impinging on a product storage vessel above the liquid level can cause vessel failure within nine minutes, resulting in a boiling liquid expanding vapor explosion. o Liquid product will change to vapor quickly at temperatures well below ambient and form flammable mixtures with air.
  • 26. Yotta Designs CHEN 4530 Senior Design Project May 5, 2010 26 o Vapors are heavier than air, and can travel long distances to an ignition source.  Inhalation risk to respiratory and central nervous systems potentially resulting in death  Frostbite can occur Liquefied Petroleum Gas (18)  May contain propane, propylene, and/or butane  Clear, colorless gas  Flash point: -156 °F; Autoignition temperature: 842 °F  Extinguishing media: dry chemical, foam, carbon dioxide, water spray  Unusual fire and explosion hazards: o Containers of product may rupture upon exposure to heat or flame. o Approach a flame-enveloped container only from the sides, and never from the head ends. o Vapors are heavier than air, and can travel long distances to an ignition source.  Inhalation risk to respiratory and central nervous systems potentially resulting in death  Freeze burns can occur Natural Gas (19)  May contain natural gas, benzene, and/or n-hexane o Can be carcinogenic due to presence of benzene  Clear, colorless gas  Flash point: <100 °F  Extinguishing media: dry chemical, foam, carbon dioxide, water fog o Do not use a direct stream of water to extinguish, as natural gas will float, and can reignite on the surface of water.
  • 27. Yotta Designs CHEN 4530 Senior Design Project May 5, 2010 27  Unusual fire and explosion hazards: o Do not weld, heat, or drill on or near containers of the product. o Do not enter confined-space fire without full bunker gear including a face shield, bunker coat, gloves, rubber boots, and a positive-pressure breathing apparatus. o Vapors are heavier than air, and can travel long distances to an ignition source.  Inhalation risk to respiratory and central nervous systems potentially resulting in death Triethylene Glycol (20)  Clear, colorless liquid with no odor  Slightly flammable  Skin irritant  Flash point: 351 °F; Autoignition temperature: 700 °F  Can form explosive mixture with air above flash point  Extinguishing media: dry chemical, alcohol foam, carbon dioxide o Water or foam may cause frothing Project Premises and Corresponding Simulation Parameters The design specifications were given by Mr. Arendell and URS Corporation. Table 8 outlines these specifications and the corresponding simulation parameters.
  • 28. Yotta Designs CHEN 4530 Senior Design Project May 5, 2010 28 Table 8. Project specifications and corresponding simulation and design parameters. Design Specification Design Value Current Design Value Wellhead Flow Rates to Facility Adjusted by design group to produce approximately 10,000 BPD of natural gasoline. Adjust 1 Natural gasoline and re-injection process dry wellhead flow rate (bpd): 1.068E5 Natural gasoline expansion dry wellhead flow rate (bpd): 1.068E5 Produced Water Rate 1.5 bbl water per MMSCF of gas flow out of the inlet separator. Adjust 2 Natural gasoline and re-injection process wet wellhead and water production flow rate from inlet separator (bpd): 360.4 344.7 Natural gasoline expansion wet wellhead and water production flow rates from inlet separator (bpd): 360.4 344.7 Gas Re-Injection Normal gas injection pressure (bar g): 180 180 Future Pipeline Gas Product Specification Maximum hydrocarbon dew point (°F) at 55 barg: 0 -41.2 Future pipeline gas delivery pressure (bar g): 55 55 Product Specifications Natural Gasoline (C5+ product) Maximum Reid Vapor Pressure (RVP) (psia): 10 10 Design standard flow rate (bpd): 8,000-11,000 Re-Injection standard flow rate (bpd): 9,202 Expansion standard flow rate (bpd): 9,869 Liquefied Petroleum Gas Maximum true vapor pressure (TVP) (psia) at 100°F: 210 208.2 C5+ content (% volume maximum): 2.0 0.98 Future Residue (Sales) Gas Maximum CO2 content (mole %): 2.0 0.0032 H2O content (lbs/MMSCF): 4 2.0 Maximum hydrocarbon dew point (°F): 0 -41.2 These results demonstrate that every design and product specification was met. The process was developed using the following assumptions and specifications with regard to design and economics. DesignAssumptions  Peng-Robinson equation of state is valid for the entire process  Ignore light ends in Oil Manager
  • 29. Yotta Designs CHEN 4530 Senior Design Project May 5, 2010 29  Mole fractions of C5+ hypothetical components are distributed equally in the Dry Well inlet material stream  The dehydration step effectively removes enough water to negate hydrate formation EconomicAssumptions  The plant is an expansion on an existing process that has produced 2,500 bpd of natural gasoline for an unknown duration of time  Conservatively, the salvage value of the current process is unknown and assumed to be negligible  The purchase of land is not required  The plant is to be constructed in the Yamal Peninsula, Siberia, Russia  Plant is operated 90% of the year for 7,884 operating hours  No royalties Overall Process Flow Diagrams Process flow diagrams are linear representations of the process. Both processes were modeled in Aspen HYSYS V7.0 (9). Natural Gasoline ProcessFlowDiagrams The current plant in the Yamal Peninsula produces 2,500 bpd of natural gasoline. The overhead products from inlet separation and C5+recovery are reinjected into the well, representing a significant cost for compression power and significant profit loss for the contained sales gas and LPG products. Figure 4 is the final Aspen HSYSYS process flow diagram (PFD) diagram.
  • 30. 30 Figure 4. Final simulation of “current” natural gasoline production. Material streams are blue, energy streams are red, and special controls are illustrated in neon green. Large blue arrows represent products.
  • 31. 31 Natural Gasoline ExpansionProcessFlowDiagram The proposed design curtails the necessity for re-injection by expanding the separation train to include sales gas and LPG recovery processes. The process builds off of the overhead streams that were re-injected. The additional sales gas and LPG recovery streams required dehydration, refrigeration, and heat exchange prior to the final separation steps.
  • 32. 32 Figure 5. Final simulation of “expanded” natural gasoline production. Material streams are blue, energy streams are red, and special controls are illustrated in neon green. Large blue arrows represent products.
  • 33. 33 Process Descriptions Inlet Separationand NaturalGasolineRecovery In the inlet separation and natural gasoline recovery portion of the process water in the wellhead stream is separated from the liquid hydrocarbons and natural gas prior to natural gasoline recovery in the C5+ distillation column. Natural Gasoline PFD Figure 6 depicts the process of inlet separation of the wellhead stream, natural gasoline recovery, and natural gas compression for re-injection into the well: 1Wellhead 50 °F 2190 psia 2 3 Water 1 Hydrocarbons C5+ Column Overhead 1 Qheat 3-Phase Inlet Separator Overhead 2 4 Qcomp1 Overhead 3 Qc1 Qr1 C5+ $ C5+ Storage C5+ Qcomp2 Overhead 2 Compressor Re-Injection Compressor 1 Qcomp3 Re-Injection Compressor 2 5 Qcomp4 Re-Injection Compressor 3 6 Re-Injection 105 °F 1505 psia 50 °F 155 psia 400 °F 160 psia 322 °F 2625 psia 69 °F 605 psia 66 °F 605 psia -$ -$ Figure 6. “Current” natural gasoline production process flow diagram with select stream conditions. Natural Gasoline Expansion PFD In the natural gasoline expansion process, inlet separation proceeds in a similar fashion to the natural gasoline process; however, the natural gasoline recovery column includes a recycled feed from the LPG recovery process. In this process the natural gas was not compressed for re-injection, but rather simply piped to the TEG dehydration cycle as illustrated in Figure 7.
  • 34. Yotta Designs CHEN 4530 Senior Design Project May 5, 2010 34 1Wellhead 50 °F 2190 psia 2 3 Water 1 Hydrocarbons C5+ Column Overhead 1 Qheat 3-Phase Inlet Separator Overhead 2 4 Qcomp1 Overhead 3 to TEG Dehydration Qc1 Qr1 C5+ $ C5+ Storage C5+ Overhead 2 Compressor 105 °F 1505 psia 50 °F 165 psia 393 °F 175 psia 69 °F 605 psia C5+ Recycled 278 °F 200 psia C5+ from Sales/LPG Recovery 300 °F 255 psia -$ 66 °F 605 psia Figure 7. Natural gasoline expansion process flow diagram showing overhead to TEG dehydration, and recycle from LPG recovery process. Approach Separation of the water, liquid hydrocarbons, and natural gas in wellhead natural gas streams is often accomplished via mechanical three phase separation units (7). This is the approach utilized in the both of the proposed processes. Consultation with Mr. Arendell confirmed this method of inlet separation as being well-suited to the processes being modeled. To assist in the modeling of C5+ recovery the GPSA section on fractionation as well as specifications provided by Mr. Arendell were utilized (21). In addition, the GPSA section on separation equipment was used to determine a residence time for vessel sizing of the inlet separator (22). The specifications used to converge this phase of the process are as follows:  Hypothetical C5+ components in dry well stream of equal composition, adding to the total mole fraction of C5+ in the stream as given by the problem statement  Dry Well and Water Well streams at 50 °F and 150 bar g as per the problem statement  Pressure drop across inlet heater and valve to 103 bar g as given in problem statement  Temperature reached after heating by inlet heater and expansion by inlet valve 105 °F in stream 3 to avoid hydrate formation
  • 35. Yotta Designs CHEN 4530 Senior Design Project May 5, 2010 35  Pressure drop of 62.05 psi across inlet separator as specified by Mr. Arendell  Pressure of 175 psia at the reboiler of the C5+ column, with a 10 psi pressure drop up the column  Reid Vapor Pressure (RVP) column specification of 10 psia at reboiler stage of C5+ column as per the problem statement  Temperature column specification at condenser stage of 50 °F of C5+ column to avoid hydrate formation  Feed stage 1 for natural gasoline process and stages 1 and 10 for the hydrocarbons and C5+ Recycled streams, respectively, for the natural gasoline expansion process  Compression of C5+ overhead to 41.71 bar to match the pressure of the overhead from the inlet separator before their combination  Gas pressure after Re-injection compressors 1, 2, and 3 of 77.35 bar, 129.4 bar, and 181 bar respectively, meeting the re-injection pressure specification of 180 bar g given in the problem statement For the inlet separation and C5+ recovery stage of both processes the flow rates of the Dry Well and Well Water streams were determined by given downstream parameters. Adjust operator 1 was implemented to set the flow rate of the Dry Well stream such that the flow rate of the C5+ stream was 10,000 standard BPD, the design specification given in the problem statement. Similarly, Adjust operator 2 and the Water Spreadsheet were introduced to set the flow rate of the Water Well stream such that 1.5 bbl of water was produced from the inlet separator for every MMSCF of gas flow from the inlet separator, another given specification. Converging distillation columns in Aspen HYSYS requires the specification of two process variables to account for the two degrees of freedom in the column. As the C5+ product stream purity specification was a RVP of 10 psia, one of the column specifications for the C5+ column was that the reboiler stage has an RVP of 10 psia. Originally, the other specification to account for the final degree of freedom in the column was a reflux ratio of 0.5 suggested by Mr. Arendell. However, using this configuration hydrates were found in Overhead 2 of this column. The second column specification was therefore changed to a 50 °F temperature at the condenser stage of the column. This was found to eliminate hydrate formation in the overhead.
  • 36. Yotta Designs CHEN 4530 Senior Design Project May 5, 2010 36 A storage tank was also modeled to hold one day’s worth of natural gasoline product, or 10,000 bbl. The only difference in the inlet separation phase of the processes is that in the natural gasoline process the combined overhead gasses are compressed for re-injection into the well, whereas in the natural gasoline expansion process the combined overhead streams are simply routed to the dehydration system. For the re-injection process three compressors were modeled to bring the gas up to re-injection pressure so that the cost of these could be determined using an available costing equation. Therefore, to size the compressors within the maximum horsepower constraint of the costing equation Adjust functions 3 and 4 were used to adjust the pressures of the respective outlet gas streams such that the a horsepower of 5990 was achieved in the first two re-injection compressors. The final re-injection compressor works to bring the natural gas pressure up to re-injection specification. In reality, only one large compressor would be used for re-injection; however, Mr. Arendell agreed that this alternate configuration employed for economic convenience was adequate to model this portion of the process. Triethylene GlycolDehydration To produce sales-quality natural gas, excess water must be removed from the gas to meet the common standards for sales gas as well as to protect the pipeline from damage. Triethylene Glycol Dehydration PFD In an effort to mitigate deleterious hydrate formation, dehydration is a crucial step to remove water from the process. Here, triethylene glycol was used to absorb water in the TEG contactor as shown in Figure 8.
  • 37. Yotta Designs CHEN 4530 Senior Design Project May 5, 2010 37 Overhead 3 from Inlet Separation Dry Gas Rich TEG Lean TEG TEG Flash Drum 5 Flare Gas TEG Air Cooler TEG TEG Pump 3 TEG HX 69 °F 605 psia 95 °F 690 psia 75 °F 100 psia Regenerated TEG 6 178 °F 15 psia 7 300 °F 90 psia 400 °F 16 psia Qc2 Qr2 TEG Regeneration Column 300 °F 30 psia Water 2 Propane HX Propane Out to Refrigeration Cycle Propane In from Refrigeration Cycle 69 °F 593 psia 253 °F 15 psia 12 to Sales/LPG Recovery -36 °F 18 psia -38 °F 17 psia -33 °F 590 psia 11 -40 °F 510 psia Qpump -$ -$ TEG Contactor Figure 8. TEG dehydration to remove water from the overhead gas stream prior to sales gas and LPG recovery. Approach Liquid desiccant dehydration equipment, more specifically triethylene dehydration, can be easily automated for use in remote areas. The primary source for glycol dehydration was the corresponding GPSA section (8). It was recommended by Mr. Arendell to model the dehydration cycle with triethylene glycol (TEG) and to generate a flow diagram with the assistance of the outlined GPSA unit operations. TEG is the most common liquid desiccant used for natural gas dehydration. It was recommended within the GPSA document that the design employ a 3 gal. TEG/lb water absorbed ratio (8). The dehydration cycle was converged with the following specifications:  Circulation rate of TEG: 3 gal. TEG/ lb water absorbed  The TEG contactor was specified to have a 5 psia pressure drop.  The TEG regeneration column is run at atmospheric pressure with a 10 kPa pressure drop up the column.  The reboiler on the TEG regeneration column is specified at a temperature of 400 °F.
  • 38. Yotta Designs CHEN 4530 Senior Design Project May 5, 2010 38  Reflux ratio of the TEG regeneration column is specified as 0.50  Process stream pressure drop of 10 psi, air intake temperature of 85°F, and air intake pressure of 14.7 psia for the air cooler  The pressure drop for the pump was specified to 684.5 psia Commonly, an inlet scrubber is installed to prevent accidental dumping of large quantities of water, hydrocarbons, or corrosion inhibitors into the TEG absorber (8). However, it was decided to exclude the scrubber in the proposed process because the feed stream was completely vapor. The first unit operation in the dehydration system is the TEG contactor in which glycol enters on the top stage and absorbs the water from the counter-current vapor stream. The water-rich TEG is then subjected to a flash drum which flashes off most of the soluble gas and flares it. The water is then removed from the water-rich TEG stream within the TEG regeneration column. The column removes the water from the TEG at atmospheric pressure with heat (400 °F). The lean-TEG stream is then cooled with the bottoms of the flash drum, which brings the TEG closer to the feed conditions for the TEG absorber. The lean-TEG is then pumped and further cooled with an air cooler to return the stream to the absorber feed conditions. The glycol dehydration is a crucial step in ensuring pipeline quality LPG and sales gas. Propane RefrigerationCycle The purpose of the propane refrigeration cycle is to cool the dehydrated gas stream prior to entering the sales gas recovery column. Propane Refrigeration Cycle PFD Figure 9 illustrates the two-stage refrigeration cycle that was used to cool the dehydrated gas stream prior to sales gas and LPG recovery:
  • 39. Yotta Designs CHEN 4530 Senior Design Project May 5, 2010 39 Dry Gas from TEG Dehydration 69 °F 593 psia Propane HX Propane Out Propane In 12 to Sales/LPG Recovery -33 °F 590 psia 11 -40 °F 510 psia -36 °F 18 psia Liquid -38 °F 17 psia Liquid Propane Recycled Liquid Propane Flash Drum 1 Suction Drum Propane Vapor Qcomp3 Propane Compressor 1 15 Propane Recycled Vapor 16 Qcomp4 17 Propane Compressor 2 Propane Air Cooler 67 °F 60 psia 24 °F 58 psia Propane Flash Drum 3 Economizer 24 °F 60 psia 55 °F 58 psia 155 °F 187 psia 18 Propane Flash Drum 2 Accumulator Propane Liquid 19 95 °F 177 psia 26 °F 62 psia Liquid Vent Vapor Vent Figure 9. Two-stage propane refrigeration cycle to reduce the temperature of the gas stream prior to sales gas recovery in the reboiled absorber. Approach The cooling of the dehydrated gas stream to -33 °F partially condenses the stream to enhance separation in the reboiled absorber (21). The primary guiding document for the refrigeration cycle was the corresponding GPSA section (23). In concordance with this document, it was recommended by Mr. Arendell to model a two-stage refrigeration cycle with an economizer. This system saves on refrigeration costs by reducing compressor duty while not investing in the additional equipment required for a three-stage system. The cycle was simulated with pure propane; however, refrigeration-grade propane contains 98% propane and 2% w/w ethane (15). Therefore, the refrigeration cycle is idealized and adaptable once the exact composition of the on-site refrigerant is determined. The cycle was built with minimal stream specifications. The specifications were as follow:  Vapor/Phase Fraction of 1.0 and temperature of -38 °F in Propane Out to allow for a 5 °F approach temperature with process Stream 11  Inlet pressure drop of 1.5 psi in Suction Drum
  • 40. Yotta Designs CHEN 4530 Senior Design Project May 5, 2010 40  Pressure of 60 psia in Stream 15  Process stream pressure drop of 10 psi, air intake temperature of 85°F, and air intake pressure of 14.7 psia for the air cooler  Vapor/Phase Fraction of 0 and temperature of 95°F in Stream 18  Pressure of 62 psia in Stream 19  Inlet and vapor outlet pressure drops of 2 psi in the Economizer In brief, the propane refrigerant undergoes four steps with the intent to evaporate in the process heat exchanger, thereby cooling the process stream from 70 °F to -33 °F. Coincidentally, the propane stream reduces from -35.6 °F to -38 °F during vaporization, allowing for a five degree Fahrenheit approach. This represents the first of the four steps. The stream then passes through a suction drum to knock out any liquids prior to compression. This was initially modeled as a flash drum but was corrected to a tank to avoid background equilibrium calculations. Secondly, the vapor is compressed in two different compressors. The second compressor combines the vapor product from the economizer with the one-time compressed vapor that is once-removed from the process heat exchanger. This is the energy saving step that characterizes this system as a two-stage cycle. The propane stream is still in the superheated vapor form following compression, thus giving way to the third step of condensation in the air cooler. The stream completely condenses via heat exchange with air. This step necessarily cools the stream to prepare for a two-step expansion via passing through the economizer. There is a vapor vent potential in the accumulator to isolate liquid refrigerant prior to expansion. Thus, the fourth and final step is expansion to reduce the pressure and temperature of the refrigerant prior to heat exchange with the process stream. Sales Gas and LPG Recovery The sales gas and LPG portion of the natural gasoline expansion process purifies and recovers natural sales gas and LPG, as well as removing excess C5+ from the natural gas and recycling it back to the C5+ recovery column. PFD Figure 10 illustrates the configuration of the unit operations required to perform the functions described above:
  • 41. Yotta Designs CHEN 4530 Senior Design Project May 5, 2010 41 Dry Gas from TEG Dehydration Propane HX Propane Out to Refrigeration Cycle Propane In from Refrigeration Cycle 69 °F 593 psia 12 -36 °F 18 psia -38 °F 17 psia -33 °F 590 psia 11 -40 °F 510 psia Sales Gas Column Sales Gas Qcomp4 Propane Compressor 2 -40 °F 500 psia LPG Column Qc4 Qr4 Heavy LPG 13 Qr3 C5+ Recycle to Inlet Separation 237 °F 510 psia 184 °F 255 psia LPG to Pipeline 115 °F 245 psia 300 °F 255 psia Sales Gas Compressed to Pipeline 27.69 °F 812.4 psia $ $ Figure 10. Sales gas recovery in the reboiled absorbed and LPG recovery in the distillation column. The bottoms product of the LPG column recycles to the C5+ recovery column to enhance yield. Approach Sales gas recovery is often accomplished by an absorption tower in industry (7). Upon suggestion by Mr. Arendell, a reboiled absorber specifically was implemented for this purpose. In order to model LPG recovery, the GPSA section on fractionation as well as a patent by Mealey were utilized to determine various operating parameters including relevant temperatures to the process (21) (24). Using these sources as well as input from Mr. Arendell, sales gas and LPG of appropriate qualities were recovered from the natural gasoline expansion process. Following are the specifications that were used to achieve convergence of this portion of the process:  Temperature and pressure of gas stream lowered to -40.01 °F and 510 psia, respectively, with Propane Heat Exchanger and Sales Valve before entrance to Sales Gas Column to meet ideal absorption conditions, as suggested by Mr. Arendell  Pressure of 510 psia at the reboiler of the sales gas absorption column, with a 10 psi pressure drop up the column  Temperature column specification of 237 °F at the Sales Gas column reboiler  Sales gas pipeline injection pressure of 55 psig as specified in the problem statement  Pressure of 255 psia before entrance to LPG column
  • 42. Yotta Designs CHEN 4530 Senior Design Project May 5, 2010 42  Pressure of 255 psia at the reboiler of the LPG column, with a 10 psi pressure drop up the column  Temperature column specification in the LPG column of 300°F at the reboiler  Composition column specification on the LPG product stream of the LPG column of 1.420 X 10⁻² fraction by volume of the lowest molecular weight hypothetical C5+ component The convergence of the absorption and distillation columns in the sales gas and LPG recovery portion of the process in such a way that all of the purity specifications on the two product streams were met was a difficult process. As the specifications for sales gas and LPG purity were given in terms of a hydrocarbon (HC) dew point and maximum vapor pressure specification, respectively, these were first used as column convergence parameters. The refluxed absorber, which has only one degree of freedom, was converged based on an a HC dew point specification such that the HC dew point of the sales gas was below the given maximum value of 0 °F. The LPG distillation column was then converged using specifications for True Vapor Pressure (TVP) at 100 °F and reflux ratio. However, with this set of parameters, it was impossible to meet the other purity specification of the LPG product stream, that it should contain less than 2 % of C5+ species by volume. Eventually, upon the suggestion of a reboiler temperature of 300 °F for the LPG column by Mr. Arendell, all of the product purity specifications were met. First of all, one of the column convergence parameters of the LPG column was set to meet the given reboiler temperature. Then, in order to meet the C5+ content specification for the LPG product, a column parameter controlling the composition of the highest boiling hypothetical C5+ component in the LPG stream was created. By adjusting this parameter downwards, the stream was purified of C5+ to acceptable levels. However, at this point the TVP specification of the stream was not being met. This was accomplished by changing the convergence parameter of the Sales Gas column to reboiler temperature, then adjusting this value upwards. This resulted in more heavy hydrocarbons being reboiled into the Sales Gas stream, which increased the HC dew point of this stream (within acceptable allowances), while decreasing the TVP of the LPG product. By this method, and the fact that the water content specification of the Sales Gas stream was easily met by previous TEG dehydration, all of the product specifications for both the Sales Gas and the LPG were met.
  • 43. Yotta Designs CHEN 4530 Senior Design Project May 5, 2010 43 Material and Energy Balances The performance of material and energybalanceswasnecessarytovalidate the accuracywith whichAspenHYSYSwas able to model the natural gasprocesses. Material and Energy Balances Material and energy balances for both processes were valid, except the overall energy balance on the expansion process. This imbalance may be attributed to relaxed recycle sensitivities. A suggestion from Professor Clough and Mr. Arendell to tighten the sensitivities from 10 to less than unity and increase the number of iterations from 10 to over 100 arose during the final presentation. This approach was explored and proved to be constrained by time. At this point in the design, single iterations of one sensitivity unit were allowed to run for several hours without completing an iteration. Therefore, it is recommended to investigate this approach upon first reaching convergence of the recycle function. Overall and unit operation balances were performed in an effort to pinpoint the imbalances. Balances were completed about the entire processes to validate conservation of mass and energy. The imbalance of the process, given by Equation 1, demonstrated the validity of PFD convergence. Equation 1. Equation to calculate imbalance for material and energy streams. 𝐼𝑚𝑏𝑎𝑙𝑎𝑛𝑐𝑒 = ( 𝑇𝑜𝑡𝑎𝑙 𝐹𝑙𝑜𝑤 𝑜𝑓 𝑂𝑢𝑡𝑙𝑒𝑡 𝑆𝑡𝑟𝑒𝑎𝑚𝑠) − ( 𝑇𝑜𝑡𝑎𝑙 𝐹𝑙𝑜𝑤 𝑜𝑓 𝐼𝑛𝑙𝑒𝑡 𝑆𝑡𝑟𝑒𝑎𝑚𝑠) Furthermore, the relative imbalance, illustrated in Equation 2, normalizes the imbalance to the total flow of inlet streams. The expected value of this figure is zero; however, HYSYS is accurate to 0.02 % (9). Equation 2. Equation to calculate relative imbalance for material and energy streams. 𝑅𝑒𝑙𝑎𝑡𝑖𝑣𝑒 𝐼𝑚𝑏𝑎𝑙𝑎𝑛𝑐𝑒 (%) = 𝐼𝑚𝑏𝑎𝑙𝑎𝑛𝑐𝑒 𝑇𝑜𝑡𝑎𝑙 𝐹𝑙𝑜𝑤 𝑜𝑓 𝐼𝑛𝑙𝑒𝑡 𝑆𝑡𝑟𝑒𝑎𝑚𝑠 × 100 A relative mass imbalance of zero percent demonstrates that the PDF is fully converged. Natural Gasoline Process Balances The mass balance for the natural gasoline process is shown in Table 9:
  • 44. Yotta Designs CHEN 4530 Senior Design Project May 5, 2010 44 Table 9. Natural gasoline material balance C5+ Material Streams Inlet lb/hr Outlet lb/hr Dry Well 5.58E+05 Water 1 5.10E+03 Water Well 5.38E+03 LNG 1.01E+05 C5+ Vapor Product 0 Re-Injection Gas 4.57E+05 Total (lb/hr) 5.64E+05 5.64E+05 Imbalance (lb/hr) 0 Relative Imbalance 0% The relative imbalance is acceptable. The energy balance for the natural gasoline process is shown in Table 10. Table 10. Natural gasoline energy balance C5+ Energy Streams Inlet Btu/hr Outlet Btu/hr Dry Well -9.75E+08 Water 1 -3.49E+07 Water Well -3.69E+07 Qc1 1.00E+05 Qheat 3.32E+07 LNG -7.73E+07 Qr1 2.08E+07 C5+ Vapor Product 0.00E+00 Qcomp1 6.04E+05 Re-Injection Gas -7.89E+08 Qcomp2 2.04E+07 Qcomp3 2.04E+07 Qcomp4 1.55E+07 Total -9.01E+08 -9.01E+08 Imbalance (Btu/hr) 4000 Relative Imbalance 0% The relative imbalance is acceptable.
  • 45. Yotta Designs CHEN 4530 Senior Design Project May 5, 2010 45 The unit operation balance exposed an imbalance about the C5+ column, as seen in Table 11. Table 11. Unit operation balances with C5+ column detail for natural gasoline process. Remarkable (>1) imbalances denoted in red. C5+ Process Imbalance Unit Op Name Mass Flow (lb/hr) Energy Flow (Btu/hr) Volume Flow (bpd) 3-Phase Inlet Separator 1.59E-06 4.84E-07 1.09E-04 C5+ Column 3.97E-06 4.00E+03 2.72E-04 Inlet Heater 3.17E-06 1.36E-06 2.17E-04 Inlet Valve 2.38E-06 1.22E-06 1.63E-04 LNG Storage Tank 7.94E-06 3.41E-06 5.43E-04 Overhead 2 Compressor 4.76E-06 2.05E-06 3.26E-04 Overhead Mixer 7.94E-07 -3.54E-07 5.43E-05 Re-Injection Compressor 1 5.56E-06 2.39E-06 3.80E-04 Re-Injection Compressor 2 6.35E-06 2.73E-06 4.35E-04 Re-Injection Compressor 3 7.14E-06 3.07E-06 4.89E-04 Wellhead Mixer -1.13E-10 1.99E-07 -3.02E-11 Total 0 4000 0 C5+ Process C5+ Column Imbalance Unit Op Name Mass Flow (lb/hr) Energy Flow (Btu/hr) Volume Flow (bpd) Condenser -4.41E-12 -3.39E-01 7.07E-13 Main TS 1.59E-06 3.92E+03 1.09E-04 Reboiler 7.94E-07 9.43E00 5.43E-05 Total 0 4000 0 The energy imbalance observed in the C5+ column existed but was negated when normalized, as seen in the overall energy balance. Expansion Process Balances Similarly, a material balance about the expansion process is shown in Table 12.
  • 46. Yotta Designs CHEN 4530 Senior Design Project May 5, 2010 46 Table 12. Expansion process material balance Expansion Process Material Streams Inlet lb/hr Outlet lb/hr Dry Well 5.58E+05 Water 1 5.10E+03 Water Well 5.38E+03 Flare Gas 1.45E+01 Water 2 3.02E+02 Sales Gas Compressed 4.39E+05 LPG 1.14E+04 Propane Liquid 0 0.00E+00 Propane Vapor 0 0.00E+00 LNG 1.08E+05 C5+ Vapor Product 6.54E+00 Total (lb/hr) 5.64E+05 5.64E+05 Imbalance (lb/hr) 23 Relative Imbalance 0% The relative imbalance is acceptable. The problematic energy balance for the natural gasoline process is shown in Table 13:
  • 47. Yotta Designs CHEN 4530 Senior Design Project May 5, 2010 47 Table 13. Expansion energy balance Expansion Process Energy Streams Inlet Btu/hr Outlet Btu/hr Dry Well -9.75E+08 Water 1 -3.49E+07 Water Well -3.69E+07 Qc1 1.35E+05 Qheat 3.32E+07 Flare Gas -2.48E+04 Qr1 2.08E+07 Qc2 1.35E+05 Qcomp1 5.88E+05 Water 2 -1.59E+06 Qr2 8.42E+05 Sales Gas Compressed -8.42E+08 Qpump 1.75E+04 Qc4 4.27E+07 Qcomp2 1.12E+07 LPG -1.30E+07 Qr4 4.19E+07 Propane Liquid 0 0 Qr3 4.62E+06 Propane Vapor 0 0 Qcomp3 7.65E+06 LNG -8.28E+07 Qcomp4 1.02E+07 C5+ Vapor Product -4.56E+03 Total (Btu/hr) -8.81E+08 -9.31E+08 Imbalance (Btu/hr) -4.97E+07 Relative Imbalance 5.6% The relative imbalance of 5.6% is the point of discrepancy for the expansion process. The unit operation balance exposed significant and numerous energy imbalances, as seen in Table 14:
  • 48. Yotta Designs CHEN 4530 Senior Design Project May 5, 2010 48 Table 14. Unit operation balances for the expansion process. Remarkable (>1) imbalances denoted in red. Expansion Process Imbalance Unit Op Name Mass Flow (lb/hr) Energy Flow (Btu/hr) Volume Flow (bpd) 3-Phase Inlet Separator 2.38E-06 8.25E-07 1.63E-04 C5+ Column 1.03E-05 -8.75E+03 7.06E-04 C5+ Recycle -4.68E+00 3.14E+03 -4.38E-01 C5+ Recycle Valve 7.14E-06 3.07E-06 4.89E-04 Inlet Heater 9.52E-06 4.09E-06 6.52E-04 Inlet Valve 3.17E-06 1.56E-06 2.17E-04 LNG Storage Tank 2.62E-05 1.12E-05 1.79E-03 LPG Column 1.19E-05 -2.40E+04 8.15E-04 LPG Valve 5.56E-06 2.39E-06 3.80E-04 Overhead 2 Compressor 1.27E-05 5.46E-06 8.70E-04 Overhead Mixer 7.94E-07 -3.54E-07 5.43E-05 Propane Air Cooler 2.54E-05 -4.93E+07 1.74E-03 Propane Compressor 1 1.43E-05 6.14E-06 9.78E-04 Propane Compressor 2 1.51E-05 6.48E-06 1.03E-03 Propane Flash Drum 1 1.75E-05 7.51E-06 1.20E-03 Propane Flash Drum 2 1.90E-05 8.19E-06 1.30E-03 Propane Flash Drum 3 1.83E-05 7.85E-06 1.25E-03 Propane HX 2.30E-05 -3.09E-01 1.58E-03 Propane Mixer 1.59E-06 6.82E-07 1.09E-04 Propane Valve 1 8.73E-06 3.75E-06 5.98E-04 Propane Valve 2 7.94E-06 3.41E-06 5.43E-04 Sales Compressor 1.35E-05 5.80E-06 9.24E-04 Sales Gas Column 2.38E-05 -1.14E+02 1.63E-03 Sales Valve 4.76E-06 2.05E-06 3.26E-04 TEG Air Cooler 2.46E-05 -3.05E+05 1.68E-03 TEG Contactor 1.59E-05 6.21E+01 1.09E-03 TEG Flash Drum 1.67E-05 7.17E-06 1.14E-03 TEG HX 2.22E-05 9.55E-06 1.52E-03 TEG Pump 1.98E-05 8.53E-06 1.36E-03 TEG Recycle 2.77E+01 -6.44E+04 1.69E+00 TEG Regeneration Column 1.11E-05 1.01E+00 7.61E-04 TEG Valve 1 3.97E-06 1.71E-06 2.72E-04 TEG Valve 2 6.35E-06 2.73E-06 4.35E-04 Wellhead Mixer -1.13E-10 1.99E-07 -3.02E-11 Total 0 -4.97E+07 0
  • 49. Yotta Designs CHEN 4530 Senior Design Project May 5, 2010 49 The significant negative energy imbalance was caused by a combination of columns, recycle functions, and an air cooler imbalance. The final value with a seventh-order magnitude exposes the source of error. Detailed column imbalances are shown in Table15. Table 15. Column balance details for expansion process. Remarkable (>1) imbalances denoted in red. C5+ Column Imbalance Unit Op Name Mass Flow (lb/hr) Energy Flow (Btu/hr) Volume Flow (bpd) Condenser -1.76E-12 7.48E-01 0 Main TS 1.59E-06 -8.68E+03 1.09E-04 Reboiler 7.94E-07 -6.89E+01 5.43E-05 Total 0 -9.00E+03 0 TEG Contactor Unit Op Name Mass Flow (lb/hr) Energy Flow (Btu/hr) Volume Flow (bpd) TS-1 -2.26E-10 62 0 TEG Regeneration Column Unit Op Name Mass Flow (lb/hr) Energy Flow (Btu/hr) Volume Flow (bpd) Condenser 1.59E-06 5.81E-07 1.09E-04 Main TS 7.94E-07 1.01E+00 5.43E-05 Reboiler 4.41E-12 1.71E-07 5.89E-14 Total 0 0 0 LPG Column Unit Op Name Mass Flow (lb/hr) Energy Flow (Btu/hr) Volume Flow (bpd) Condenser 1.59E-06 3.33E-01 1.09E-04 Main TS 7.94E-07 -2.40E+04 5.43E-05 Reboiler -1.13E-10 4.00E-01 -7.54E-12 Total 0 -24000 0 Sales Gas Column Unit Op Name Mass Flow (lb/hr) Energy Flow (Btu/hr) Volume Flow (bpd) Main TS -1.13E-10 -1.13E+02 -3.02E-11 Reboiler 7.94E-07 -1.51E+00 5.43E-05 Total 0 0 0
  • 50. Yotta Designs CHEN 4530 Senior Design Project May 5, 2010 50 The additive effect of these imbalances was corroborated by the overall energy imbalance. This analysis expands the imbalance beyond the recycle functions. However, both recycle balances are shown in Table 16 to provide additional clarity to the imbalance: Table 16. Recycle balances for the expansion process. Remarkable (>1) imbalances denoted in red. C5+ Recycled Stream 14 C5+ Recycled Imbalance Relative Imbalance Vapour 1.58E-01 1.58E-01 -2.62E-05 -0.02% Temperature (°F) 2.78E+02 2.78E+02 -2.61E-02 -0.01% Pressure (psia) 2.00E+02 2.00E+02 0.00E+00 0.00% Molar Flow (lbmole/hr) 1.13E+02 1.13E+02 -8.42E-02 -0.07% Mass Flow (lb/hr) 7.37E+03 7.36E+03 -4.68E+00 -0.06% Std Ideal Liq Vol Flow (bpd) 7.69E+02 7.69E+02 -4.40E-01 -0.06% Molar Enthalpy (Btu/lbmole) -5.48E+04 -5.48E+04 -1.30E+01 0.02% Molar Entropy (Btu/lbmole-F) 2.94E+01 2.94E+01 1.02E-02 0.03% Heat Flow (Btu/hr) -6.22E+06 -6.22E+06 3.14E+03 -0.05% Total -0.21% TEG Recycle Stream 10 Lean TEG Imbalance Relative Imbalance Vapour 0.00E+00 0.00E+00 0.00E+00 0.00% Temperature (°F) 9.50E+01 9.50E+01 0.00E+00 0.00% Pressure (psia) 6.90E+02 6.90E+02 0.00E+00 0.00% Molar Flow (lbmole/hr) 4.96E+01 4.98E+01 1.99E-01 0.40% Mass Flow (lb/hr) 6.92E+03 6.95E+03 2.77E+01 0.40% Std Ideal Liq Vol Flow (bpd) 4.21E+02 4.22E+02 1.68E+00 0.40% Molar Enthalpy (Btu/lbmole) -3.24E+05 -3.24E+05 1.31E-01 0.00% Molar Entropy (Btu/lbmole-F) 3.52E+01 3.52E+01 -1.18E-05 0.00% Heat Flow (Btu/hr) -1.61E+07 -1.62E+07 -6.44E+04 0.40% Total 1.60% The imbalances observed in the recycle functions were primarily energy parameters, except for the mass flow in the TEG Recycle function. This value was apparently negligible; an imbalance was not observed in the overall mass balance. Process Description & Equipment Specifications Equipment was designed to accommodate the greater demand of 10,000 bpd, for both the natural gasoline and re-injection and expansion project.
  • 51. Yotta Designs CHEN 4530 Senior Design Project May 5, 2010 51 Distillation Columns In the re-injection process there is only one column, which is responsible for the recovery of natural gasoline at a standard flow rate of 9182 bpd. In the expansion process, which is capable of recovering natural gasoline, LPG, and sales gas there are a total of five columns. The purpose of the first distillation column in the separation train (the C5+ Column) is to separate the heavier hydrocarbons (C5 and above) from the lighter hydrocarbons. An absorption column and a distillation column are pertinent unit operations within the glycol dehydration step of the process. The first column in the dehydration step is an absorption column which acts to remove the remaining water from the process stream by contacting the stream with a TEG stream. The vapor outlet of the TEG contactor goes on to undergo further separation to produce LPG and sales gas. The bottoms product from the TEG contactor is the feed for the TEG regeneration distillation column. The purpose of the TEG regeneration column is to remove the water from the glycol restoring it to a purity of 99.0 wt%. A refluxed absorber column is used to separate the heavier hydrocarbons from the sales gas product. The bottoms stream from the refluxed absorber column is the feed to the LPG recovery distillation column. The LPG distillation column separates the LPG product from the heavier hydrocarbons (C5+). The heavier hydrocarbons are then recycled back to the C5+Column. Estimating Column Pressure and Condenser Type The column operating conditions are important for obtaining the desired product specifications. In conjunction with recommendations from Mr. Arendell and Professor Clough, the diagram in Figure 11 was followed to determine an appropriate column pressure and condenser type.
  • 52. Yotta Designs CHEN 4530 Senior Design Project May 5, 2010 52 Calculate bubble- point pressure (PD) of distillate at 120°F Start Distillate and bottoms are known or estimated Calculate bubble- point pressure (PD) of distillate at 120°F PD > 215 psia Choose a refrigerant so as to operate partial condenser at 415 psia PD > 365 psia Estimate bottoms Pressure (PB) PD < 365 psia Use partial condenser PD < 215 psia Use total condenser (reset PD to 30 psia If PD <30 psia) Calculate bubble- point temperature (TB) of bottoms at PB Lower pressure PD appropriately TB > bottoms decomposition or critical temperature TB < bottoms decomposition or critical temperature Figure 11. Decision tree to determine column pressures and condenser types. The final column operating parameters are shown in Table 17 where the number of trays and feed tray locations were iterated and optimized to reduce the reboiler duty.
  • 53. Yotta Designs CHEN 4530 Senior Design Project May 5, 2010 53 Table 17. Final column operating temperatures and pressures. Column Inlet Temperature (o C) Inlet Pressure (kPa) Distillate Temperature (o C) Distillate Pressure (kPa) Bottoms Temperature (o C) Bottoms Pressure (kPa) C5+ Recovery 19.09 136.6 4171 1379 10.09 1138 213 1207 TEG Contactor Absorber 35 20.55 4757 4171 20.90 4089 20.77 4123 TEG Regeneration 148.6 206.8 122.9 101.3 204 110.0 Sales Gas Refluxed Absorber -40 3516 -39.77 3447 113.9 3516 LPG Recovery 84.46 1758 45.90 1689 148.9 1758 Calculating Number of Trays In order to determine the number of trays that each distillation column needs, the distillation columns were first attempted as shortcut distillation columns in Aspen HYSYS. However, after being unable to make the columns converge another method was utilized. A trial-and-error method which included changing the number of trays until the duty of the condensers and reboilers were minimized was utilized instead. The number of trays that yielded the minimum duty was chosen as the actual number of trays. The resulting number of trays and reflux ratios, if applicable, can be seen below in Table 18.