1. Abstract
Background
Research Questions
Methods
Due to the magnitude of the soil carbon pool, understanding the
processes that regulate decomposition are crucial. This study
analyzed soil microbial community structure along a depth gradient
and compared the undisturbed microbes to those influenced by the
addition of 13C labeled roots. Six months after root addition, 18
samples (nine control and nine root addition) were collected from
three soil pits at three depths (15, 55 and 95 cm) in the Blodgett
Research Forest, Georgetown, CA. Phospholipid fatty acids (PLFA)
were extracted and analyzed in order to identify biomarkers
representing microbial guilds. The analysis revealed microbial
biomass decreased with depth, which could explain why carbon in
deeper soils has longer turnover times. Samples that contained
added roots had higher microbial biomass, indicating that microbial
growth was stimulated by the addition of organic matter.
Additionally, community structure was significantly different
between depths, with deeper soils having a higher proportion of
slow-growing K strategists and shallower soils being dominated by
fast-growing R strategists. The K versus R difference was also
visible when assessing microbial substrate preference. Fungi and
gram negative bacteria (possibly R strategists) preferred added root
carbon, where as actinomycetes preferred native carbon.
Results
Blodgett Research
Forest
• MAT: 12°C
• MAP: 1660 mm
• Elevation: 1400 m
• Soils: Ultic Alfisols,
granite bedrock
• C pool: 15-22 kg C m-2
• 37% below 30 cm
Field protocol:
• 13C labeled root
substrate was added at
3 depths in the soil
profile
• 15, 55, 95 cm
• Surrounding soil was
collected 6, 12 and 24
months later
• Compared against
control soil taken from
adjacent areas
Lab protocol:
• Phospholipid fatty acid (PLFA) analysis
• Lipids were extracted from the soil samples
• Phospholipids were isolated, methylated and
suspended in hexane
• Gas chromatography (GC) and isotope ratio
mass spectrometry (IRMS)
• Allowed for determination of both abundance
of specific PLFA biomarkers as well as δ13C
of each biomarker
Figure 1. Simplified diagram of carbon soil cycle.
Figure 2. Blodgett Forest
Research Station,
Georgetown, CA. Photograph
courtesy of Caitlin Hicks Pries.
Figure 3. Soil profile of Blodgett
soil pit. Photograph courtesy of
Caitlin Hicks Pries.
Figure 4. PLFA silica chromatography. Photography courtesy of Caitlin
Hicks Pries
Figure 5. Microbial abundance by experimental treatment. Microbial
abundance is represented by the average nmol PLFA-C/g in each
sample. Error bars represent standard error.
Figure 6. Average mol % abundance of each PLFA biomarker. Only
control samples shown because control and labeled root added did
not differ. Error bars represent standard error.
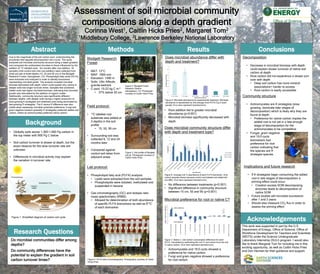
Figure 7. Native v. root carbon consumption difference for each
PLFA. Calculated by subtracting the mol % root carbon from the mol
% native carbon. Error bars represent standard error.
Does microbial abundance differ with
depth and treatment?
• Root addition led to greater microbial
abundance (p<0.001)
• Microbial biomass significantly decreased with
depth
Does microbial community structure differ
with depth and treatment type?
• No difference between treatments (p<0.001)
• Significant difference in community structure
between 15 cm, 55 and 95 (p<0.001)
Microbial preference for root or native C?
• Actinomycetes and 19:0 cyclo showed a
preference for native carbon
• Fungi and gram negative showed a preference
for root carbon
Do microbial communities differ among
depths?
Do community differences have the
potential to explain the gradient in soil
carbon turnover times?
0
0.5
1
1.5
2
2.5
3
3.5
4
4.5
5
15 cm Control 15 cm Label 55 cm Control 55 cm Label 95 cm Control 95 cm Label
AveragenmolPLFA-C/g
Experimental treatment
-8
-6
-4
-2
0
2
4
6
8
10
12
16:010MeActinomycetes
18:010MeActinomycetes
17:0cycloCyclopropyl
19:0cycloCyclopropyl
18:1w9cFungi
18:2w6,9cFungi
16:1w7cGramnegative
18:1w7cGramnegative
15:0aGrampositive
15:0iGrampositive
17:0aGrampositive
17:0iGrampositive
20:4w6,9,12,15cProtozoa
NativeC-RootCmol%difference
15
55
95
Native preference
Root preference
Organic
matter
Rapid
microbial
decomposition
Slow
microbial
decomposition
Respiration
Atmospheric CO2
Photosynthesis
Organic
matter
Assessment of soil microbial community
compositions along a depth gradient
Corinna West1, Caitlin Hicks Pries2, Margaret Torn2
1Middlebury College, 2Lawrence Berkeley National Laboratory
Acknowledgements
This work was supported in part by the U.S.
Department of Energy, Office of Science, Office of
Workforce Development for Teachers and Scientists
(WDTS) under the Science Undergraduate
Laboratory Internship (SULI) program. I would also
like to thank Margaret Torn for including me in this
exciting opportunity, as well as Caitlin Hicks Pries
and Don Herman for their guidance and support.
Conclusions
Decomposition
• Decrease in microbial biomass with depth
could explain slower turnover of native soil
carbon at depth
• Root carbon did not experience a slower turn
over with depth
• Deep soil carbon has more mineral
associations= harder to access
• Root carbon is easily accessible
Community structure
• Actinomycetes are K strategists (slow
growing, dominate later stages of
decomposition) which is likely why they are
found at depth
• Preference for native carbon implies the
added root is not yet in a late enough
stage of decomposition for the
actinomycetes to be competitive
Implications and future research
• If K strategists begin consuming the added
root in late stages of decomposition a
priming effect could occur
• Creation excess SOM decomposing
enzymes leads to decomposition of
native SOM
• Future studies will microbial succession
after 1 and 2 years
• Should also measure CO2 flux in order to
assess the priming effect
Stabilization
0
2
4
6
8
10
12
14
AverageMol%
PLFA Biomarker
15 cm Control
55 cm Control
95 cm Control
• Globally soils stores 1,300-1,600 Pg carbon in
the top meter with 900 Pg C below
• Soil carbon turnover is slower at depth, but the
exact reasons for the slow turnover rate are
unknown
• Differences in microbial activity may explain
the variation in turnover rate
• Fungal, gram negative
and 19:0 cyclo
biomarkers had
preference for root
carbon indicating that
the species are R
strategist species