Download as PDF, PPTX
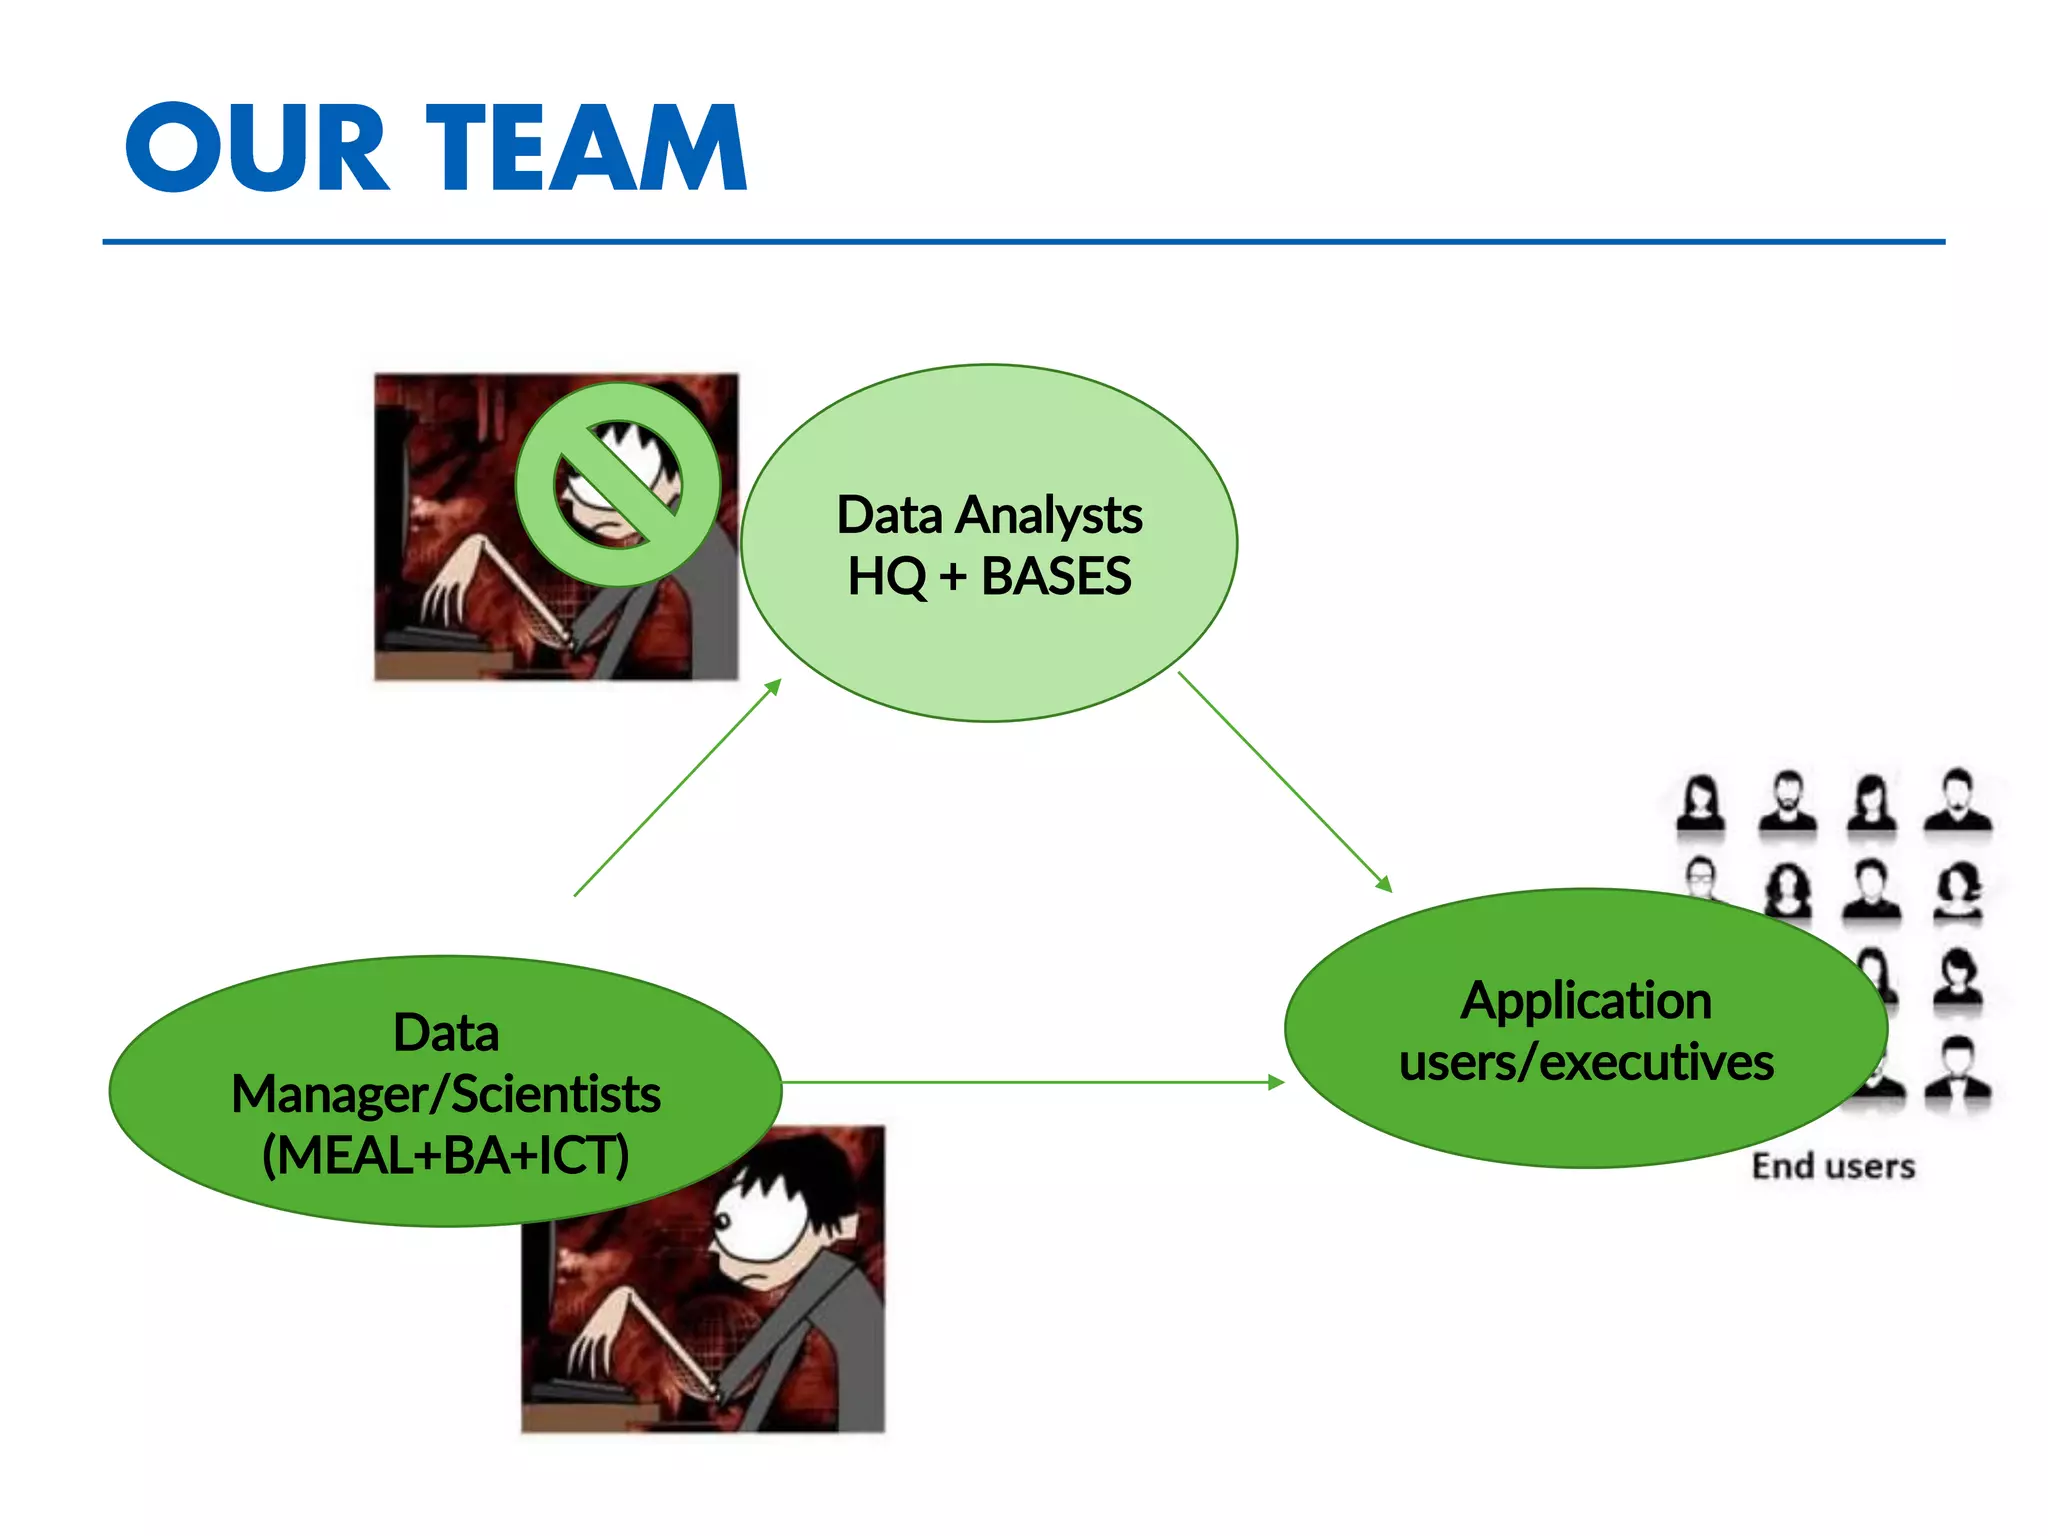
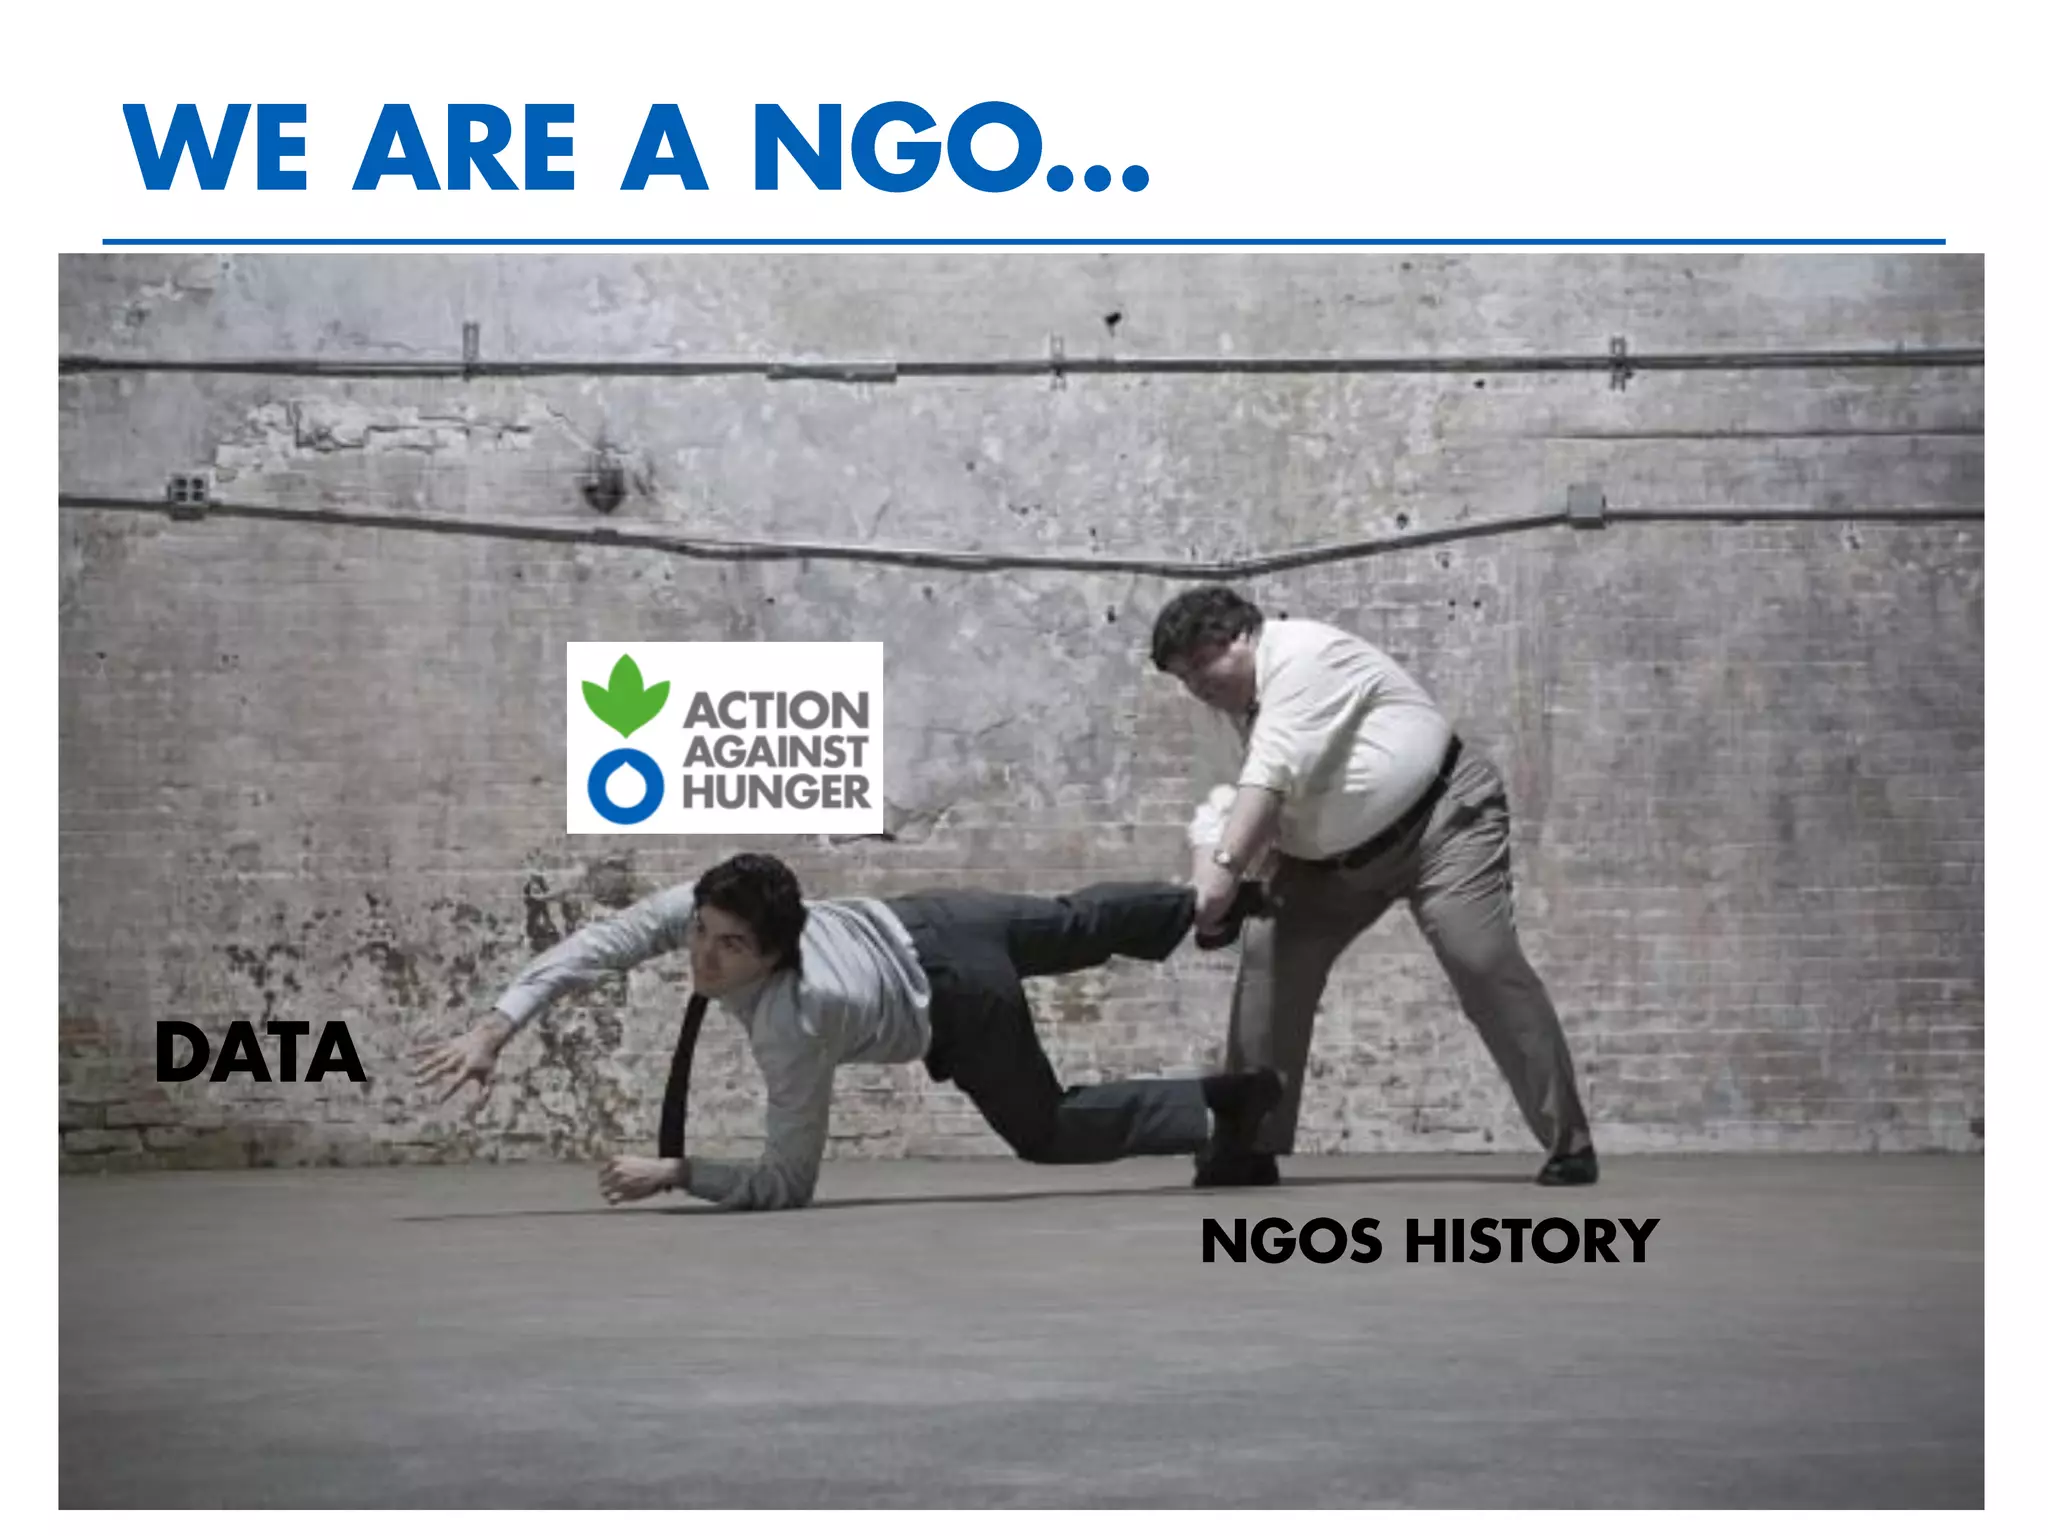
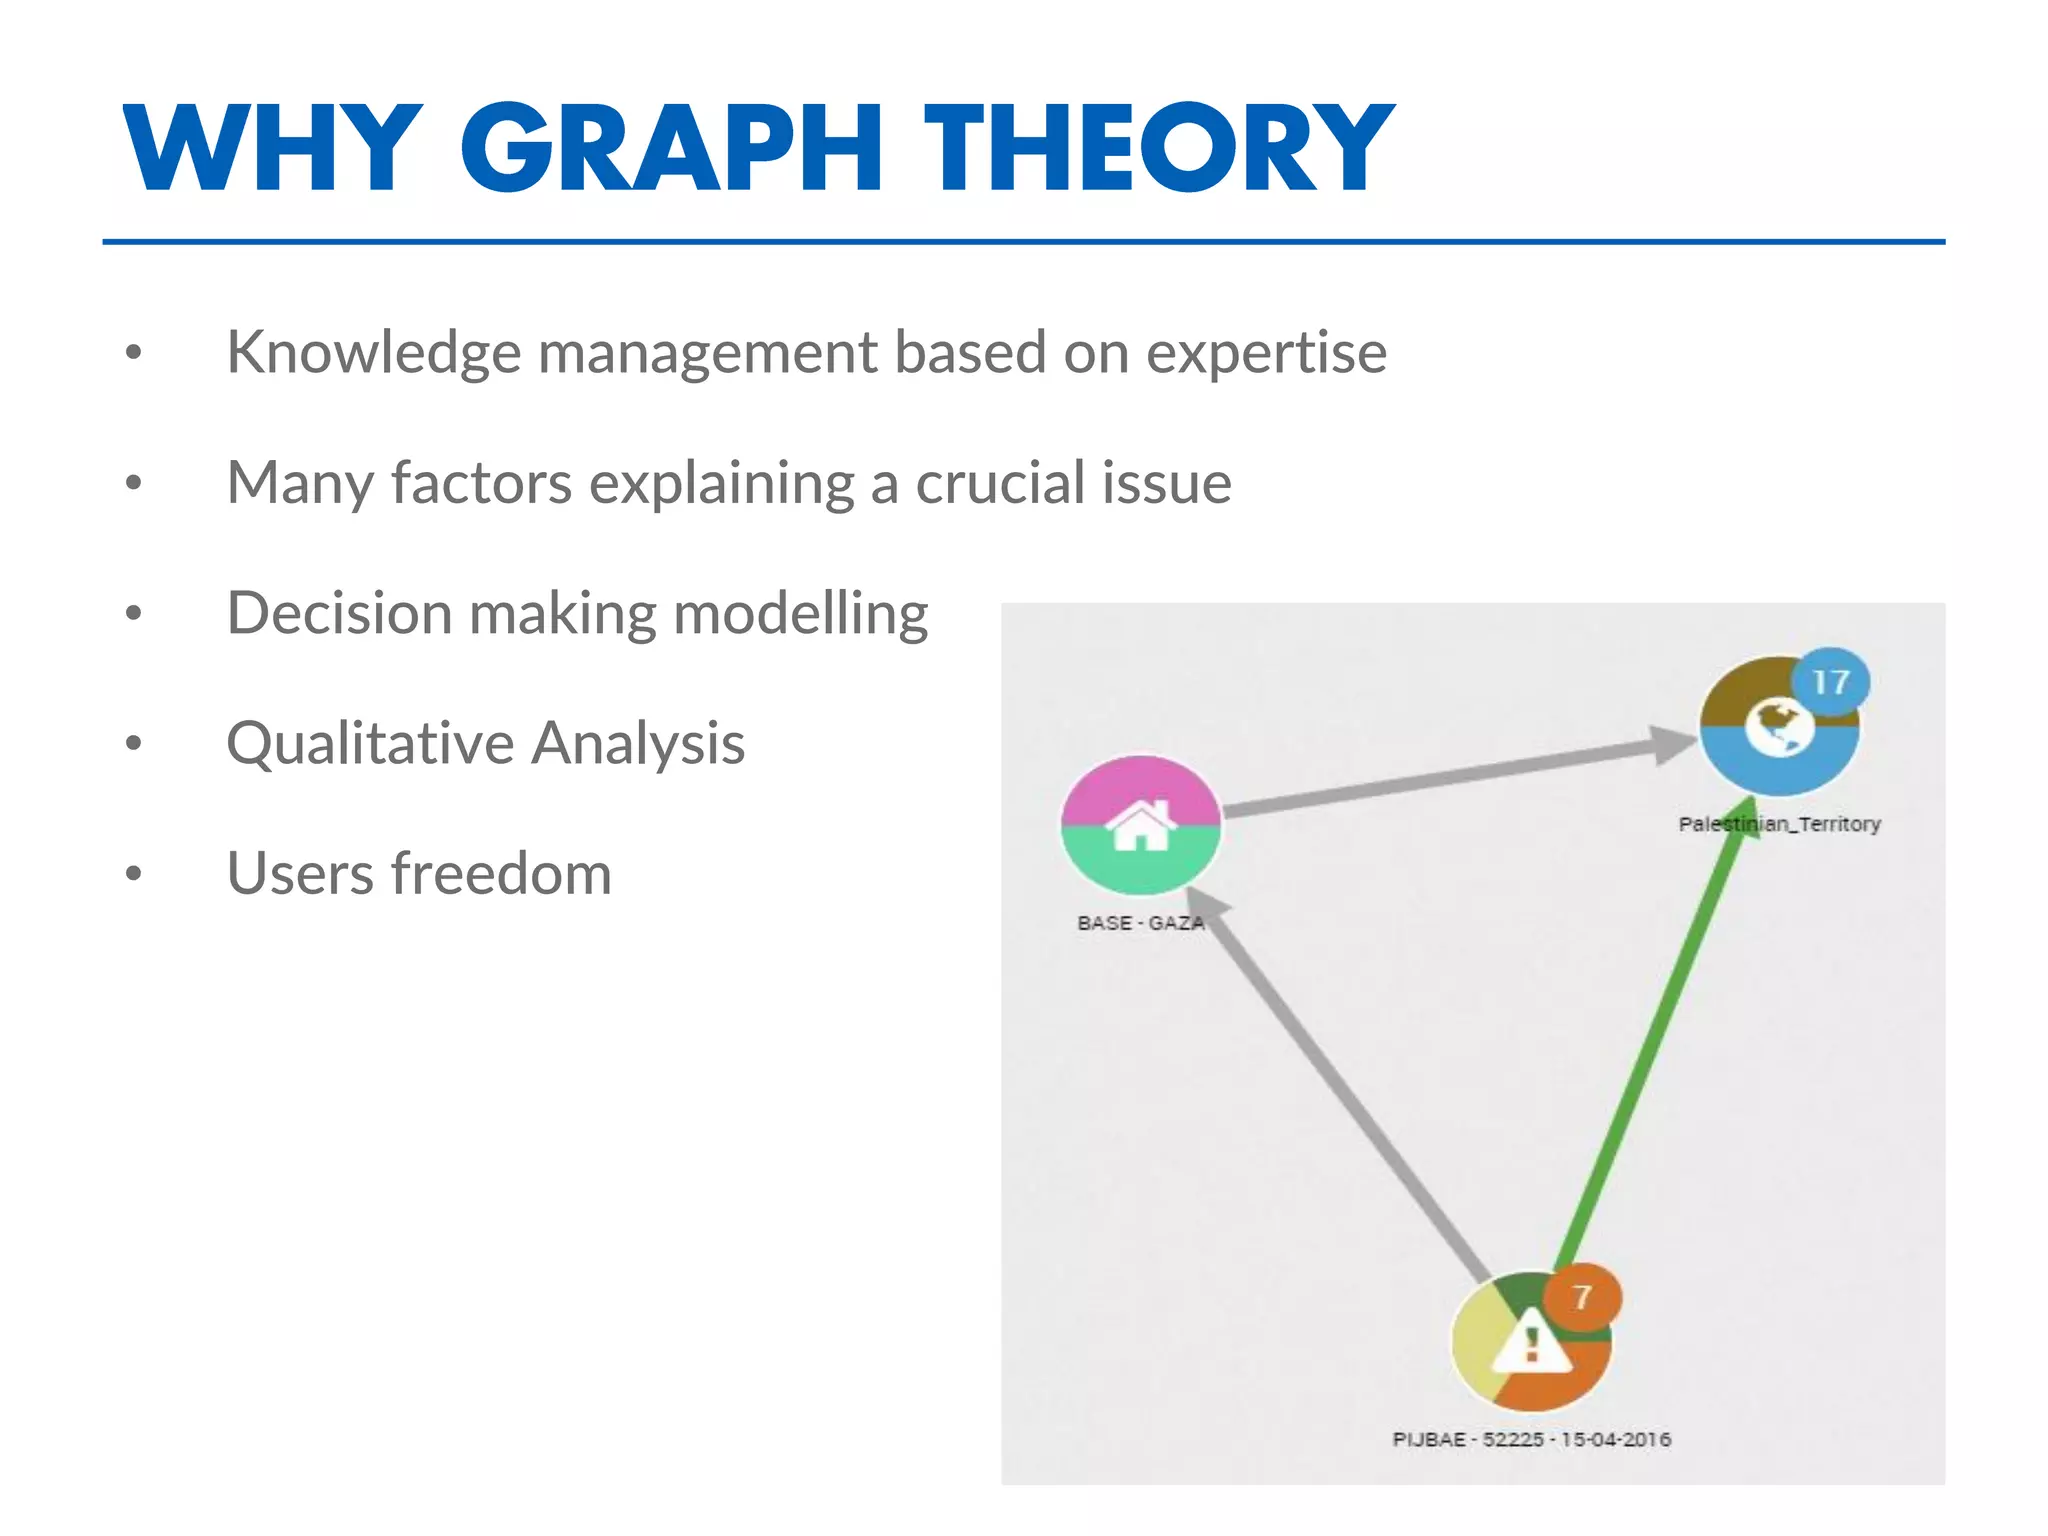
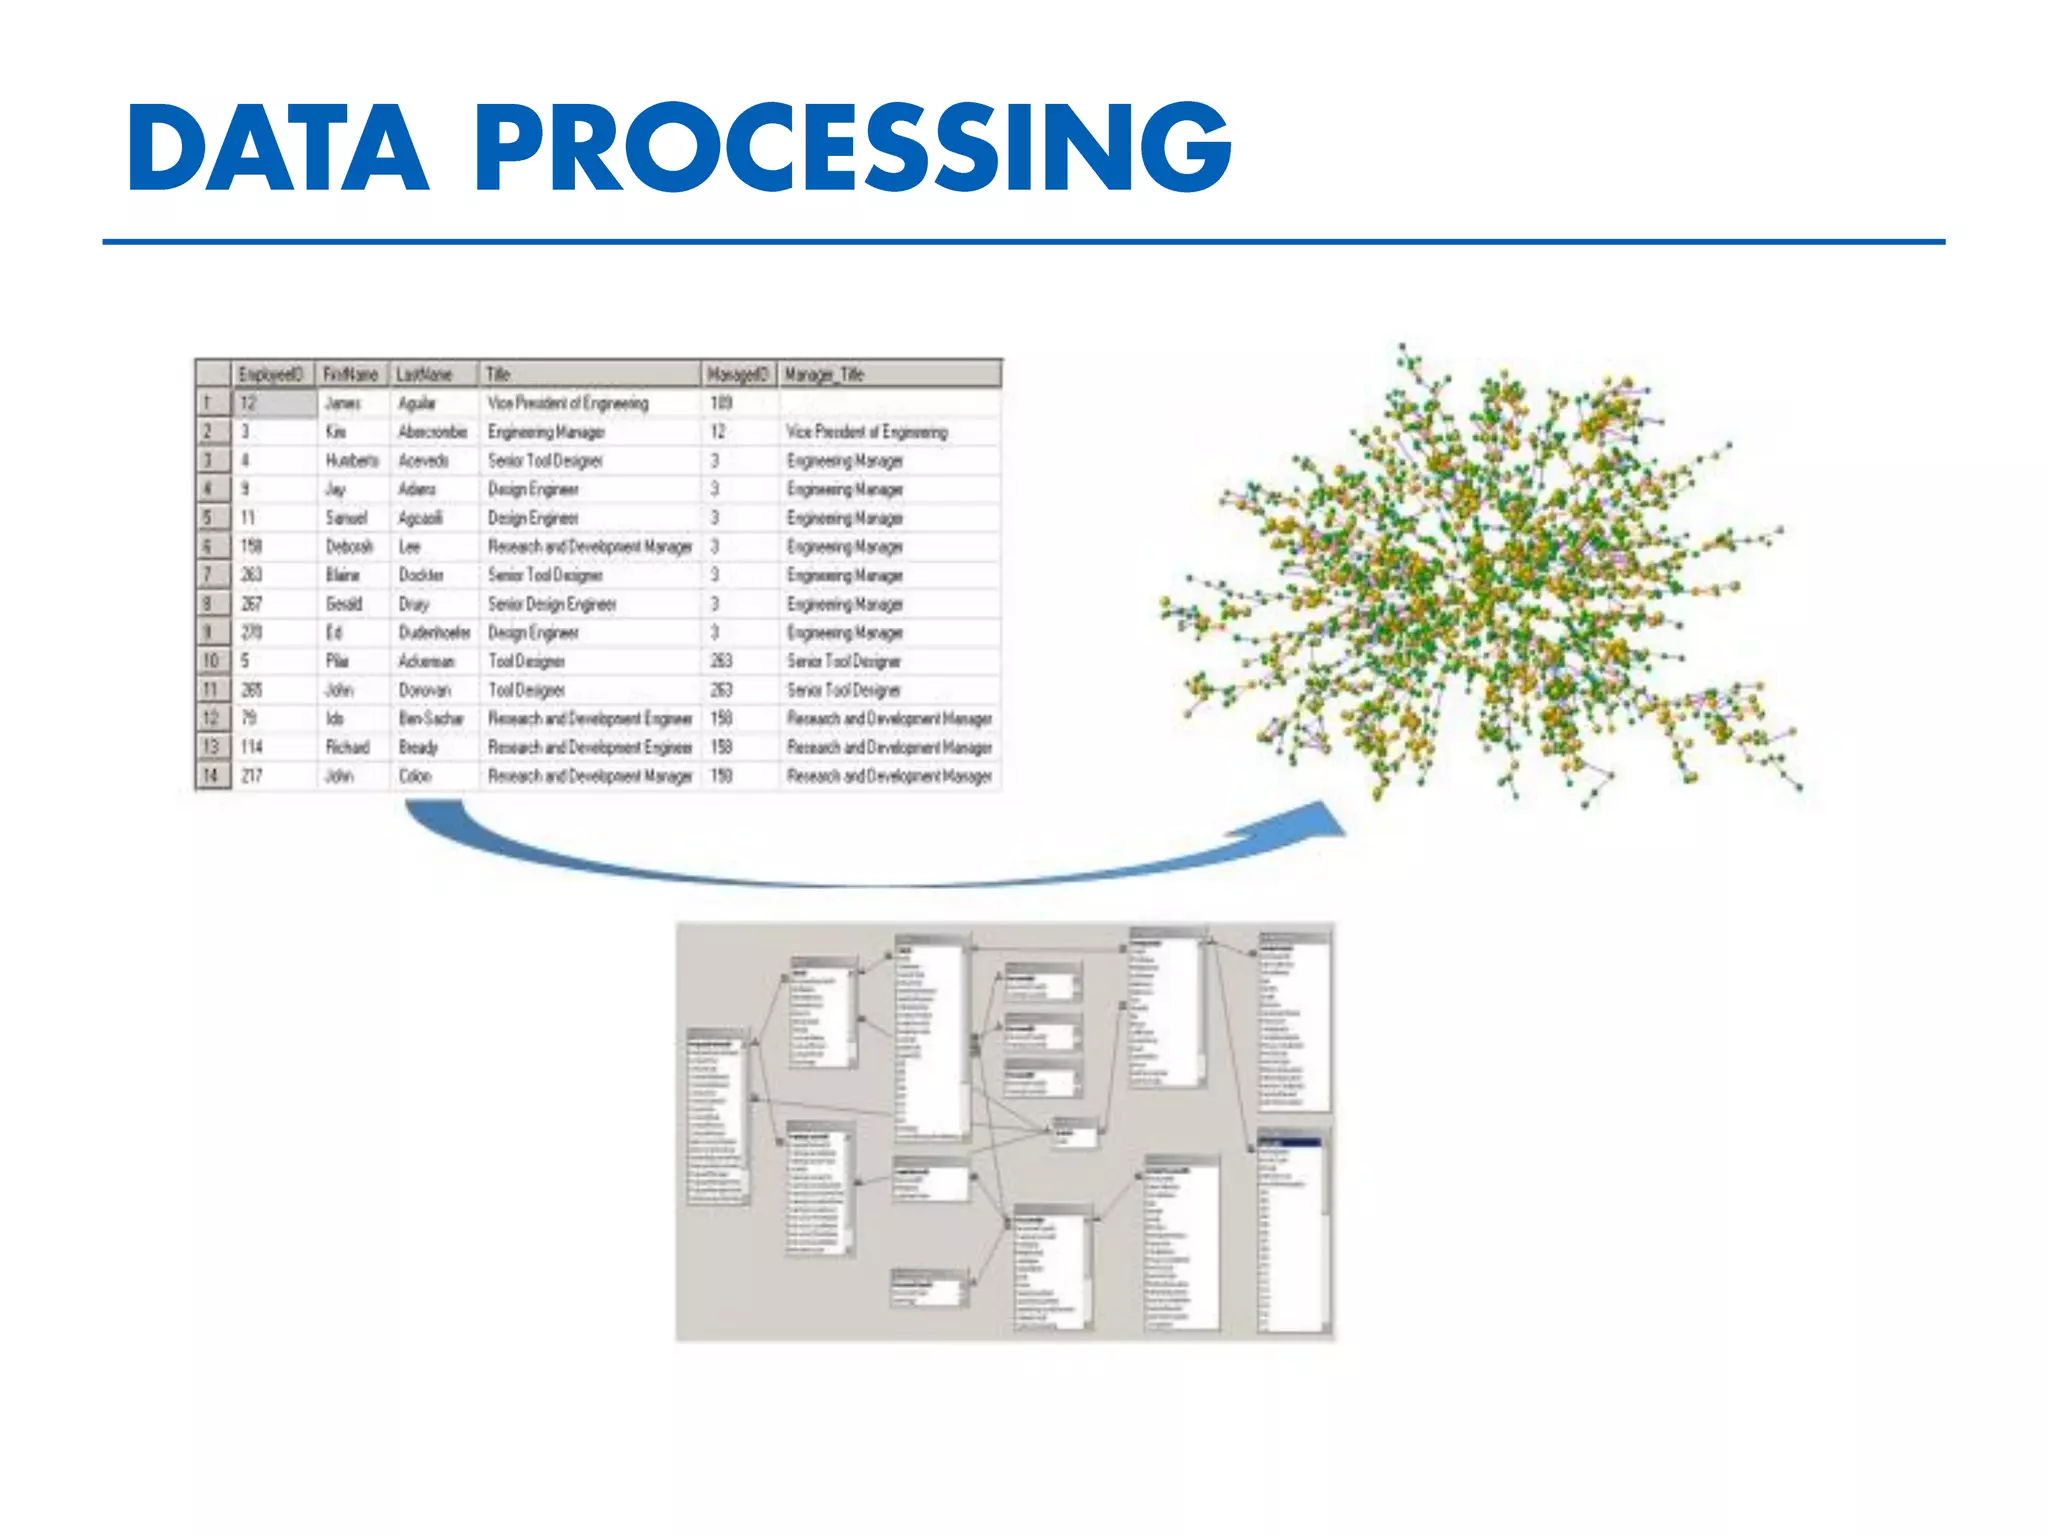
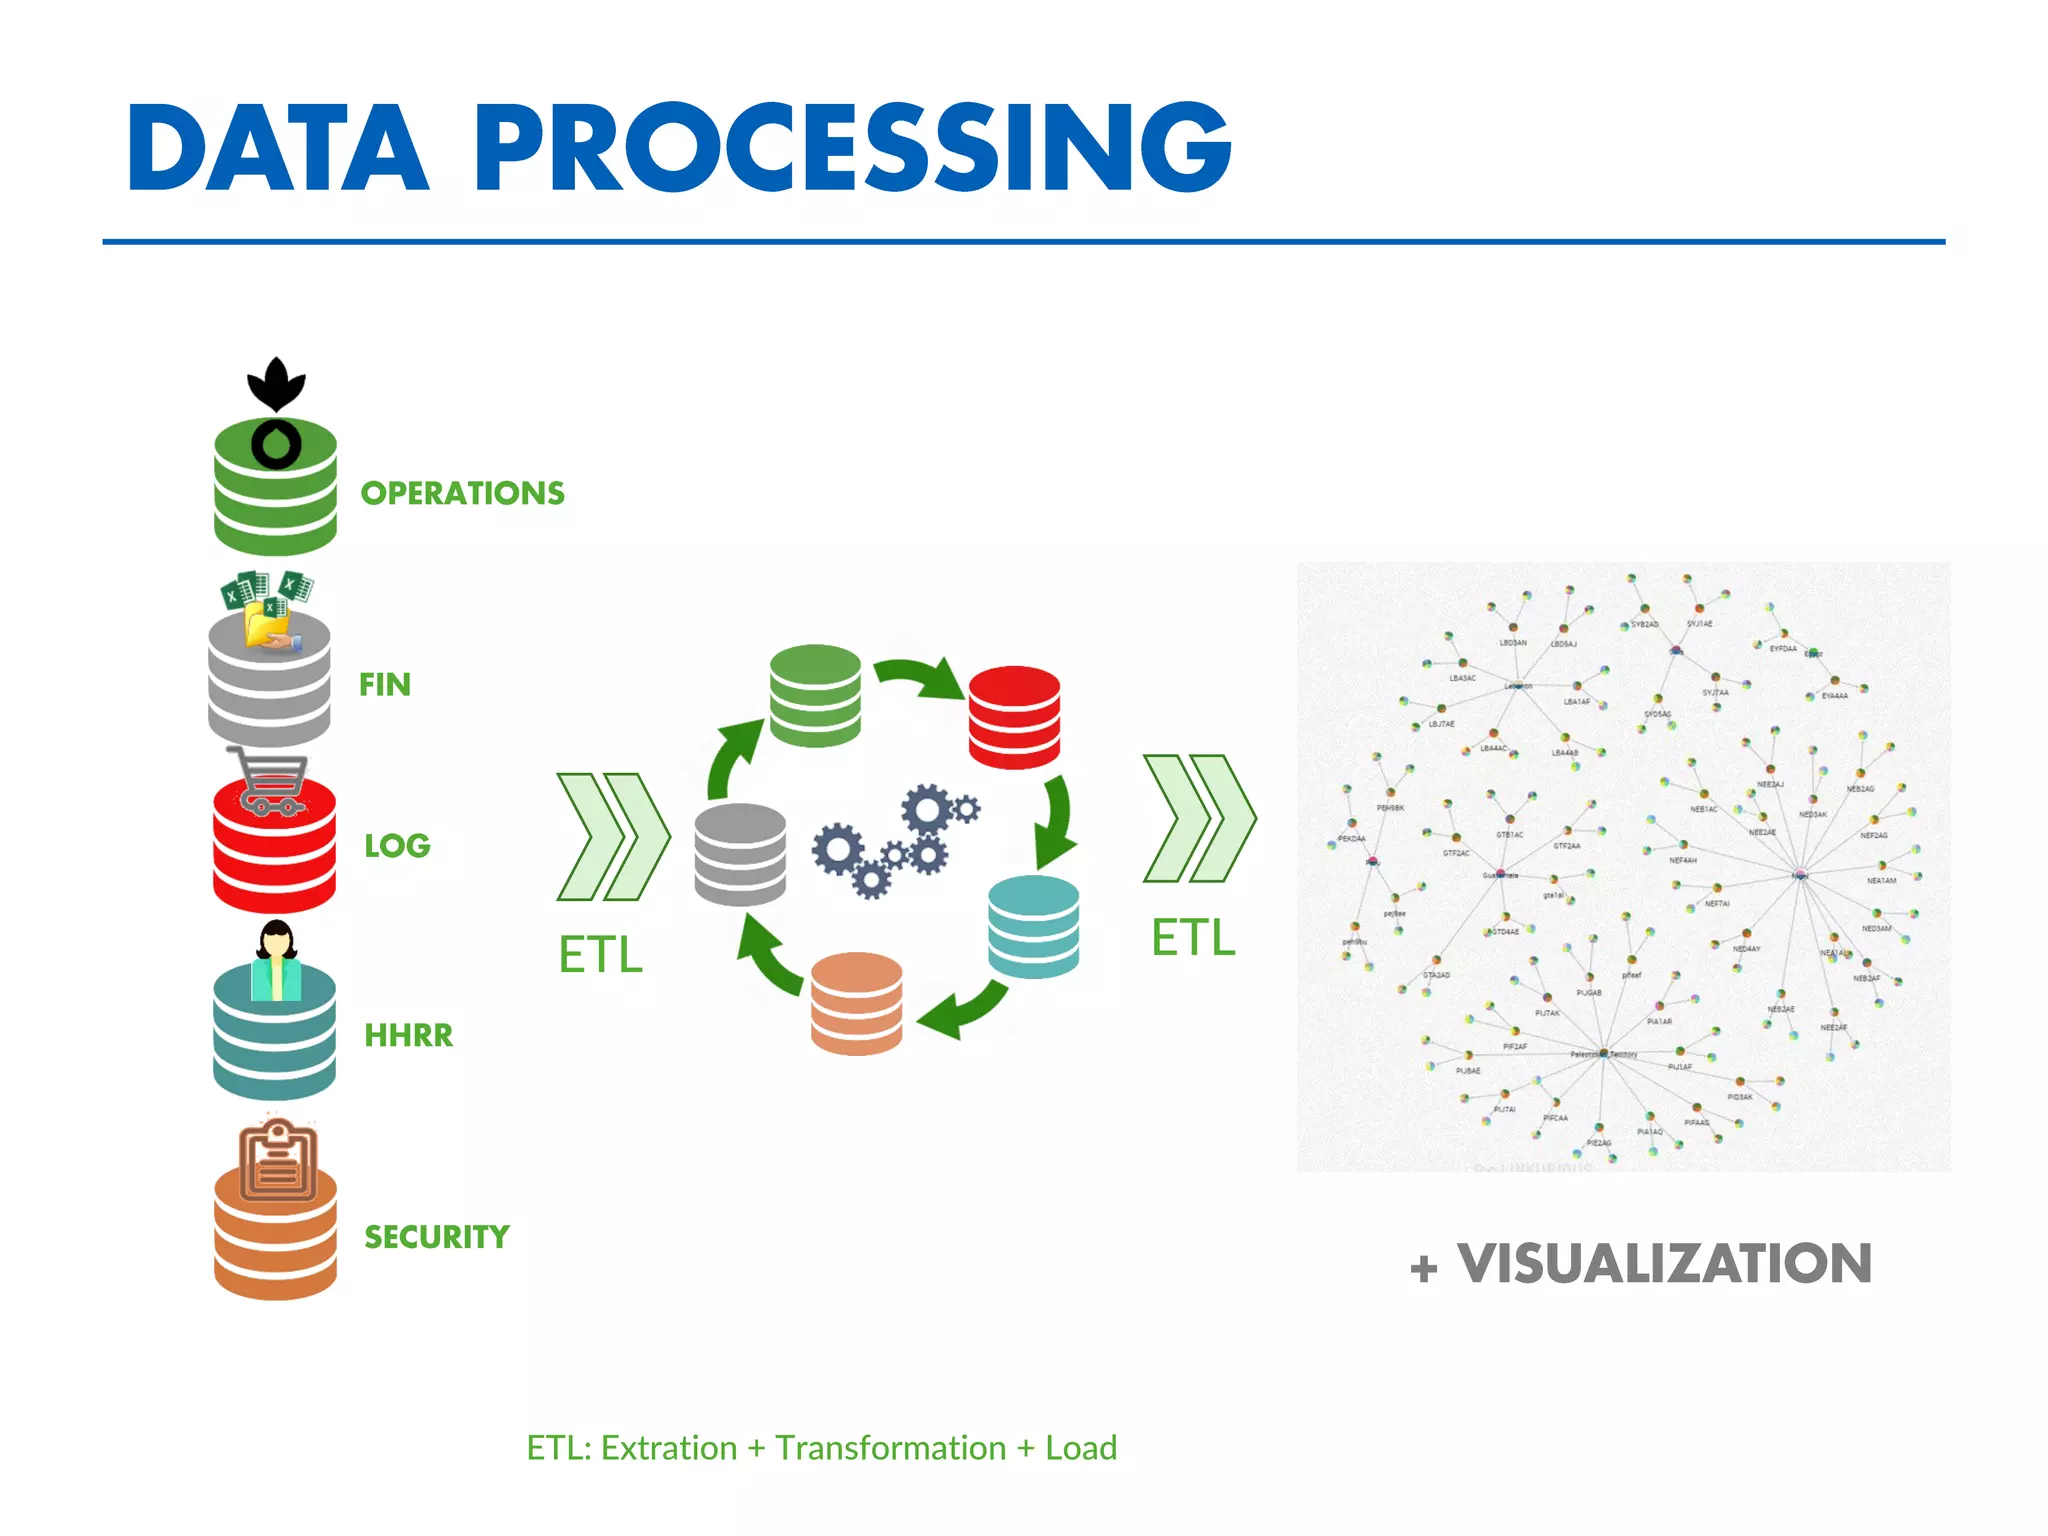
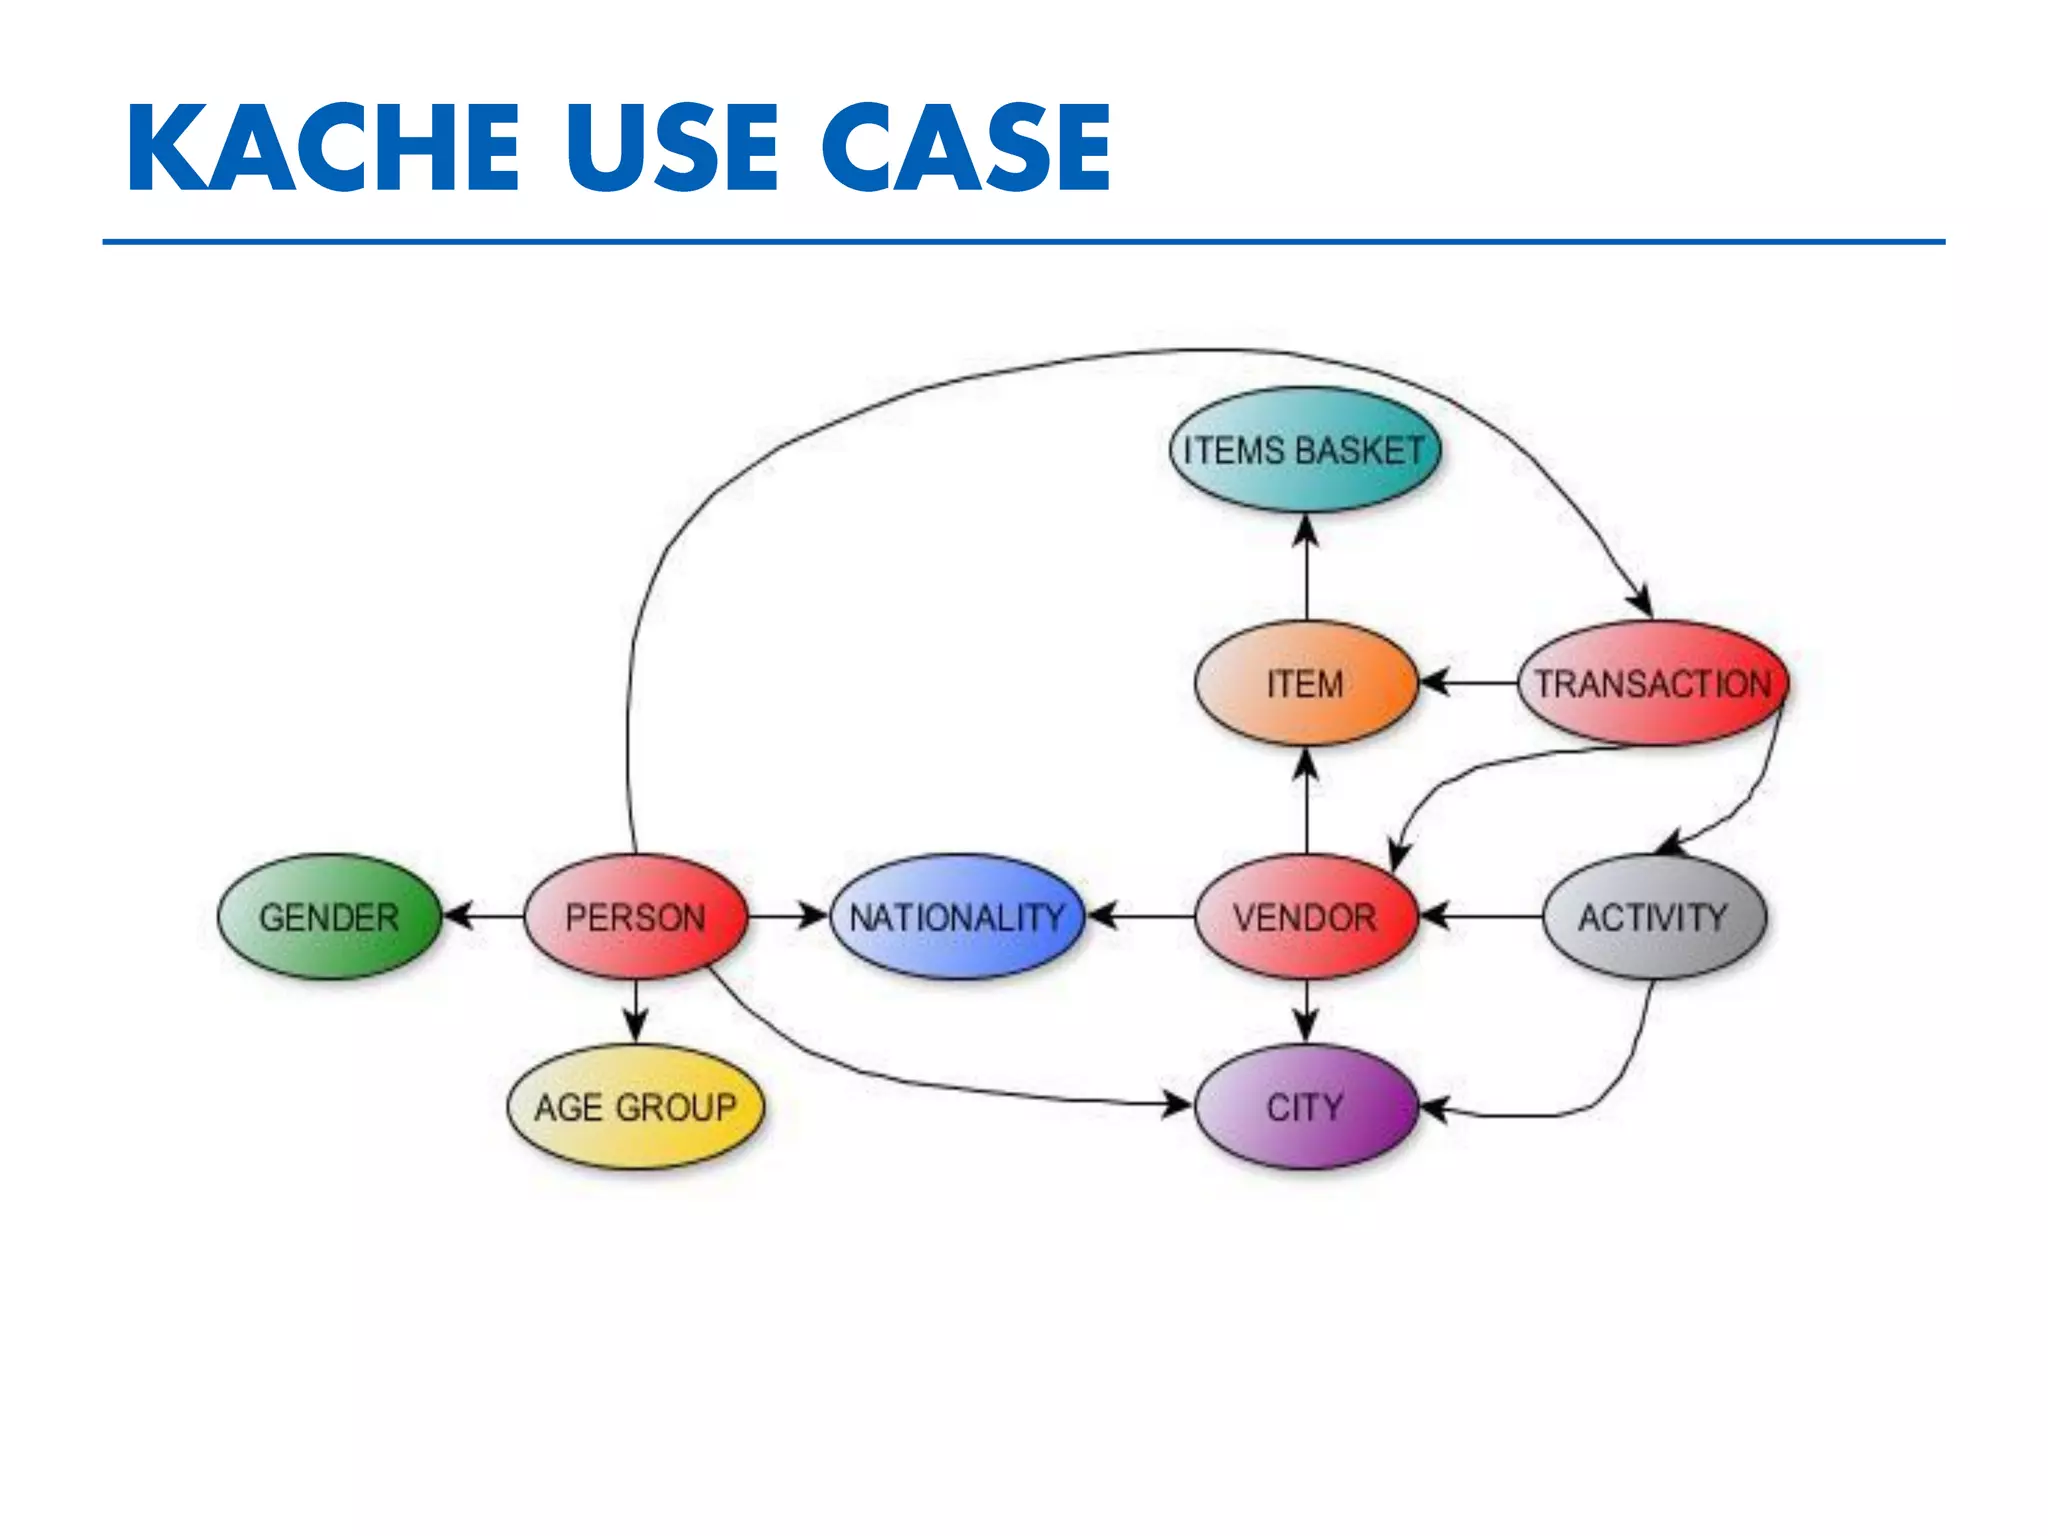
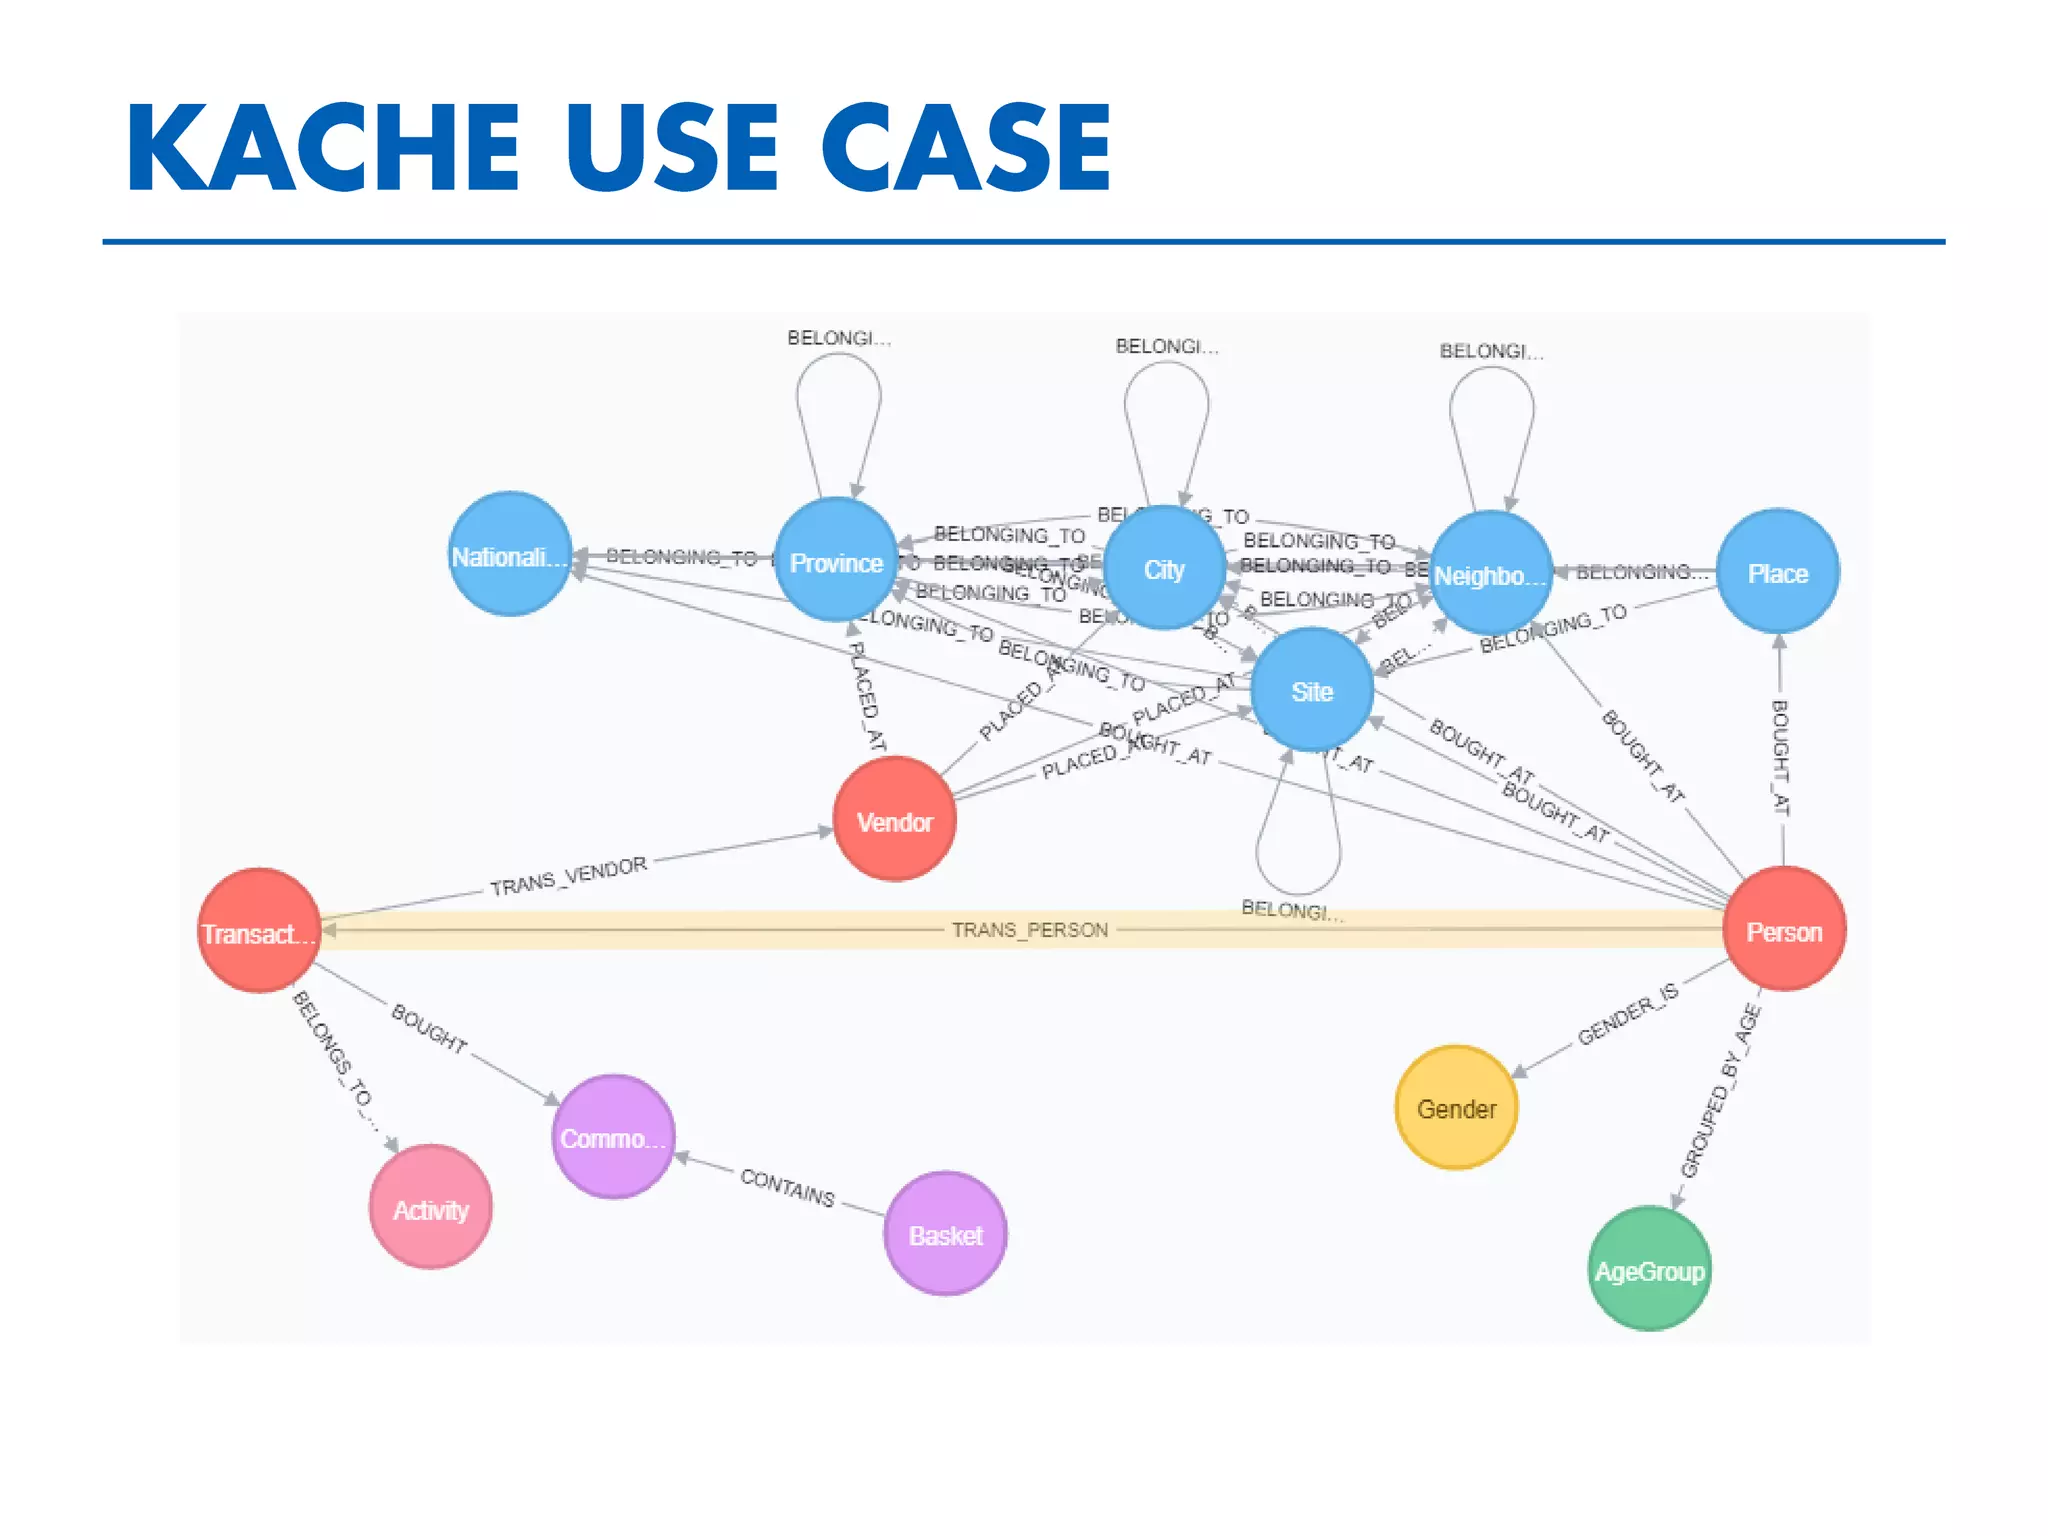
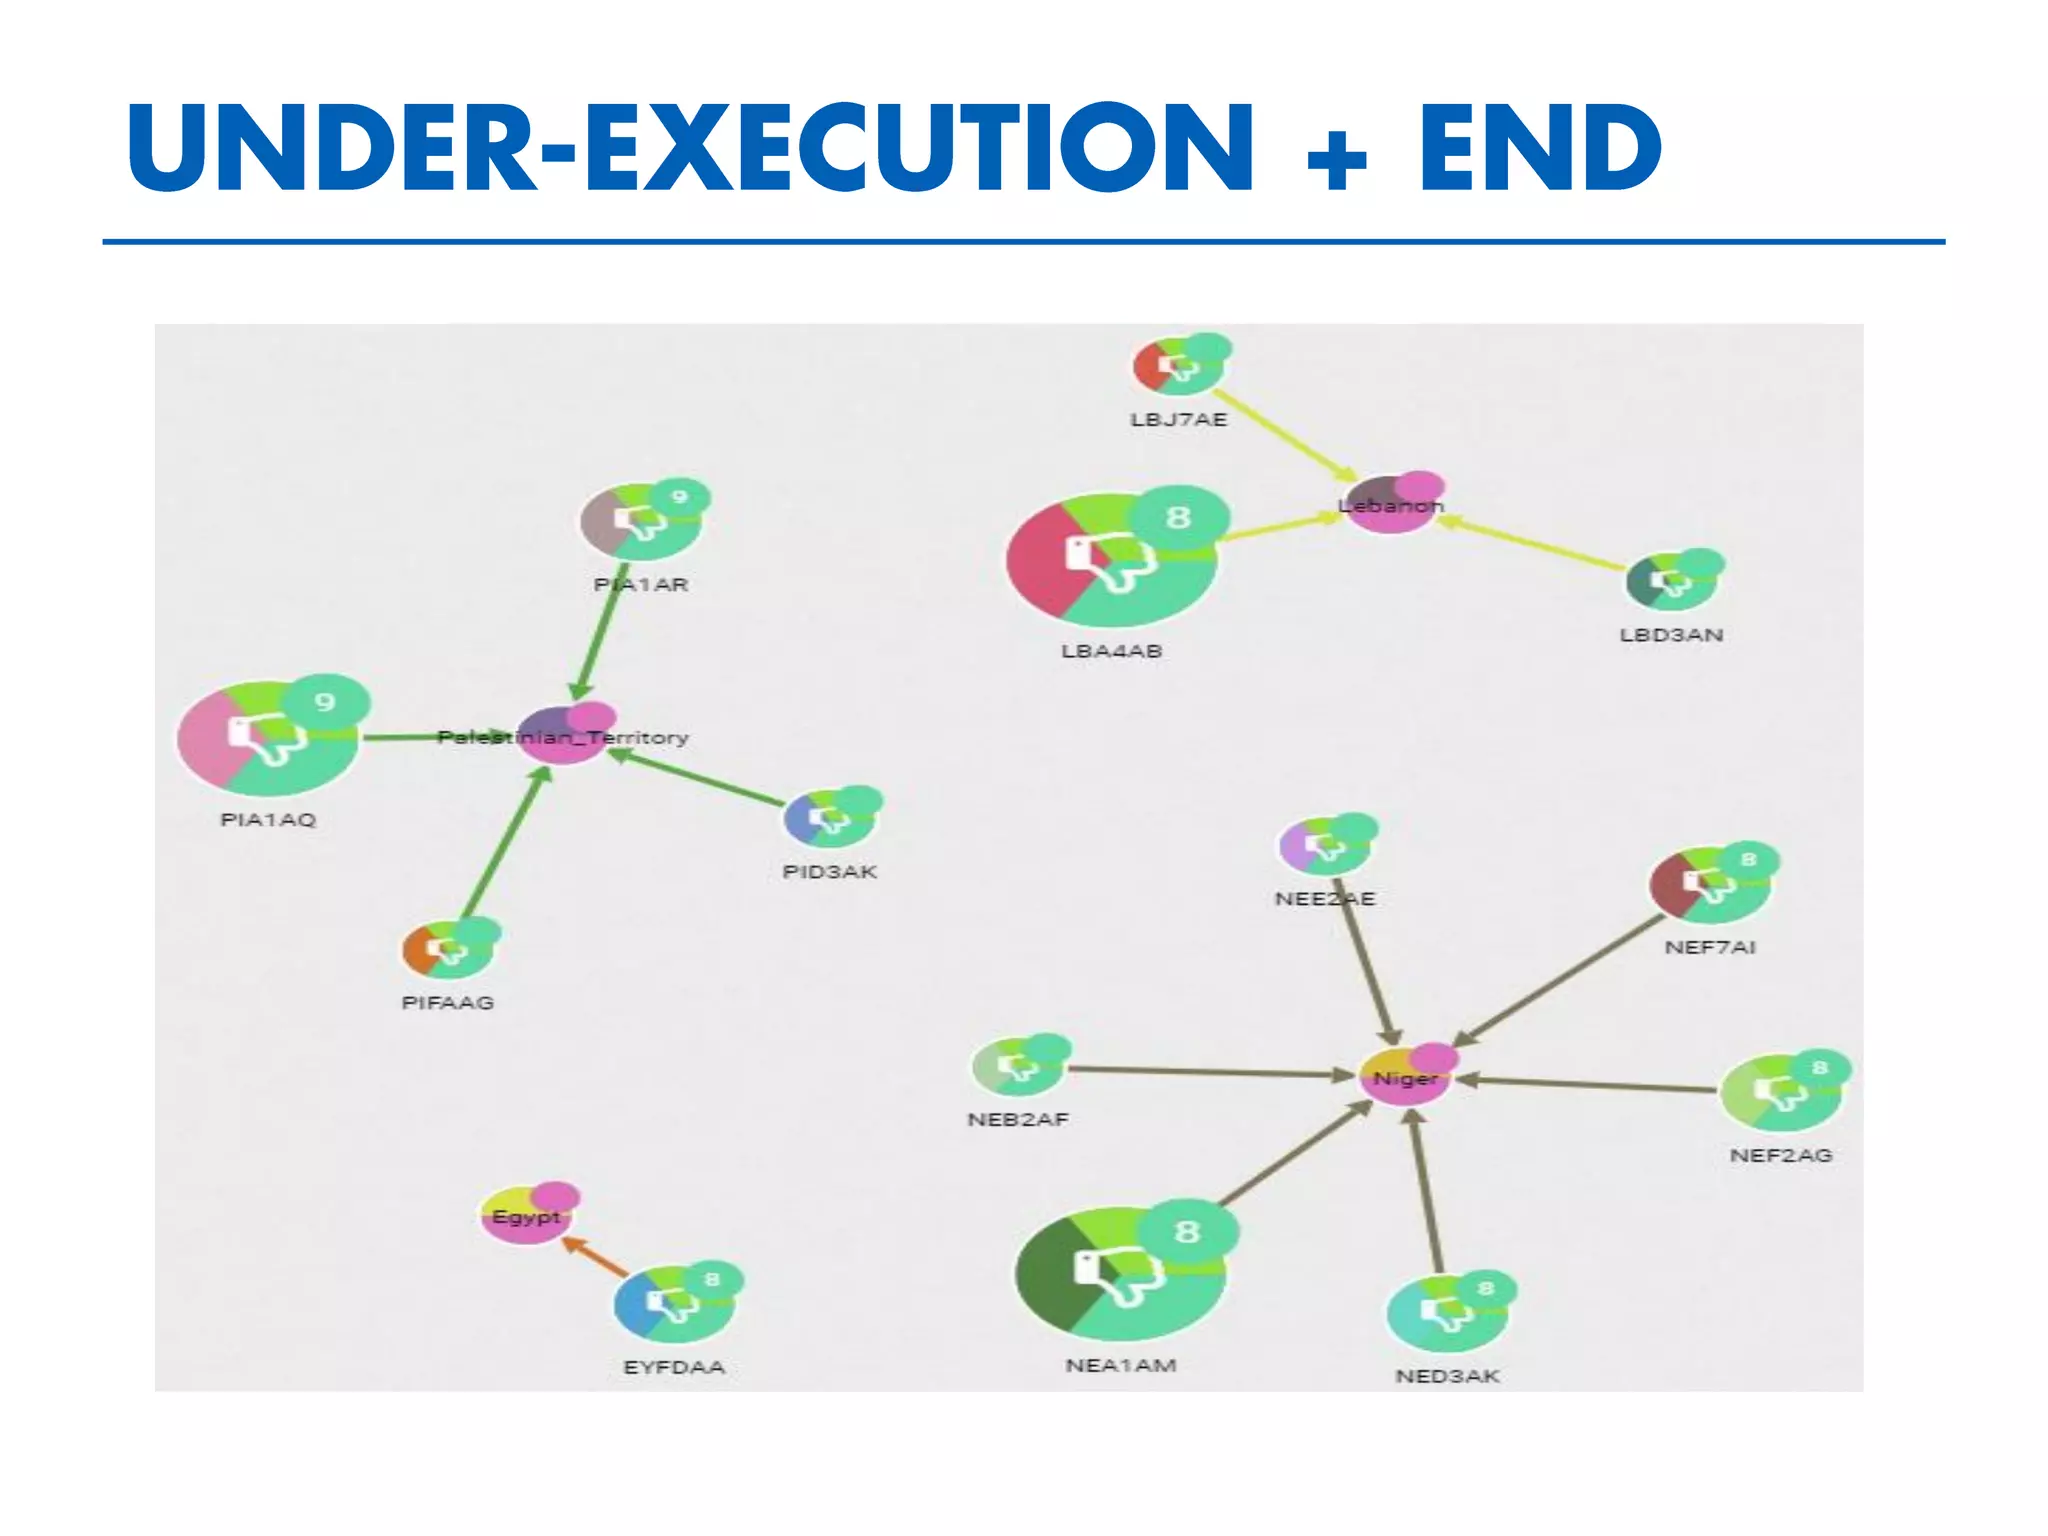
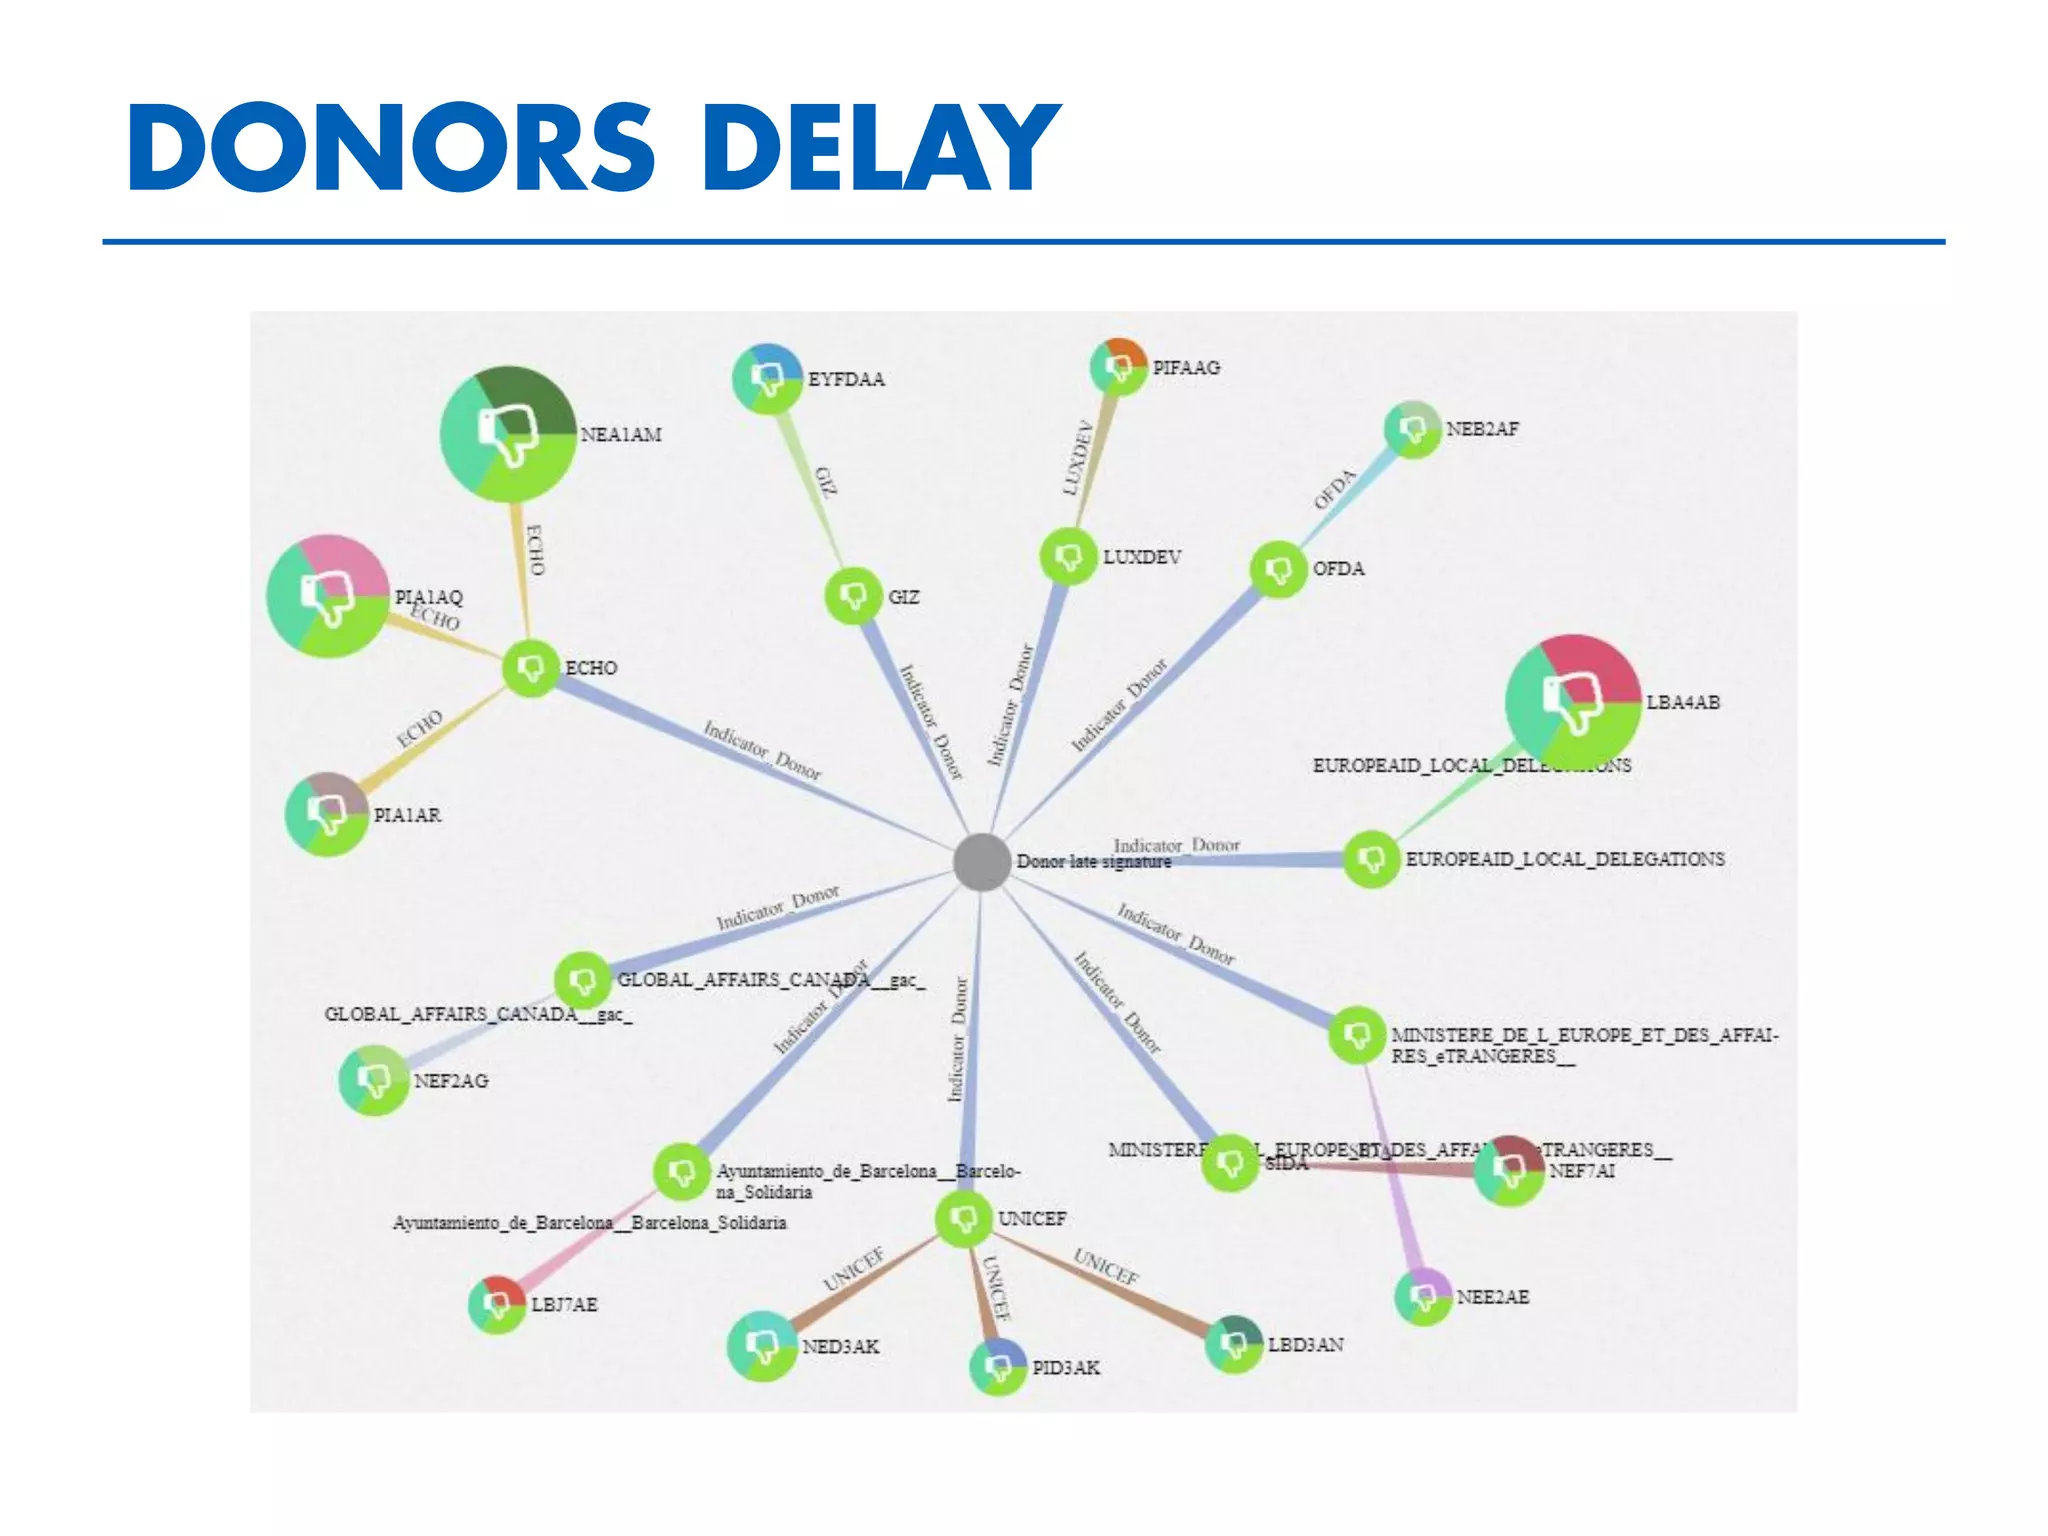
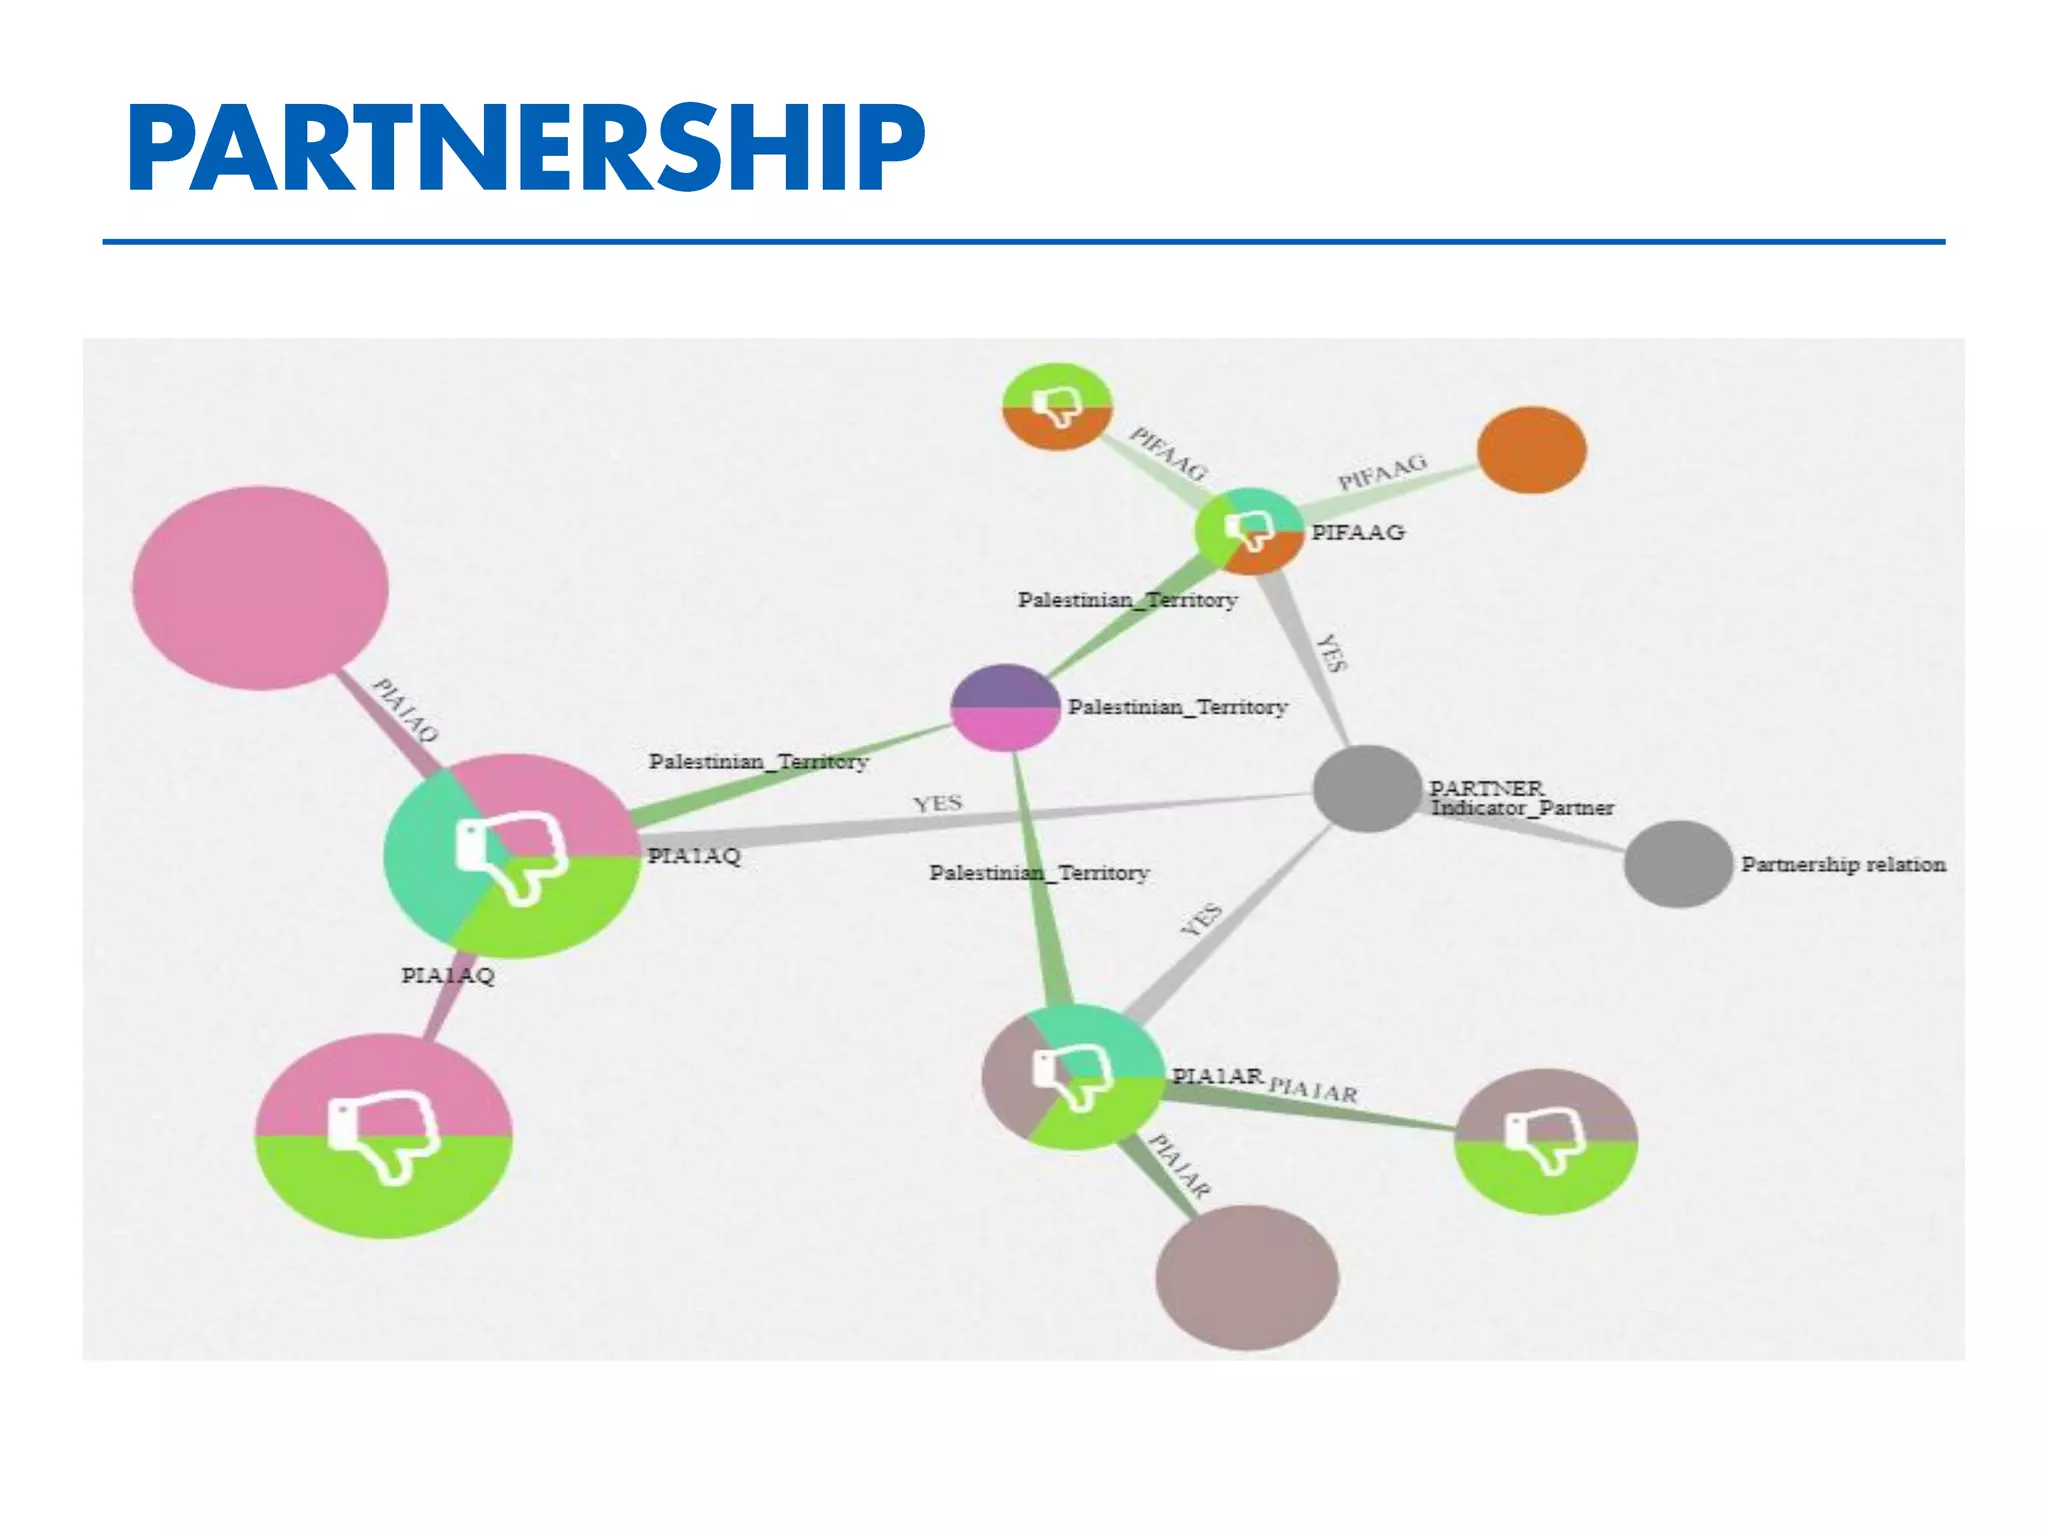

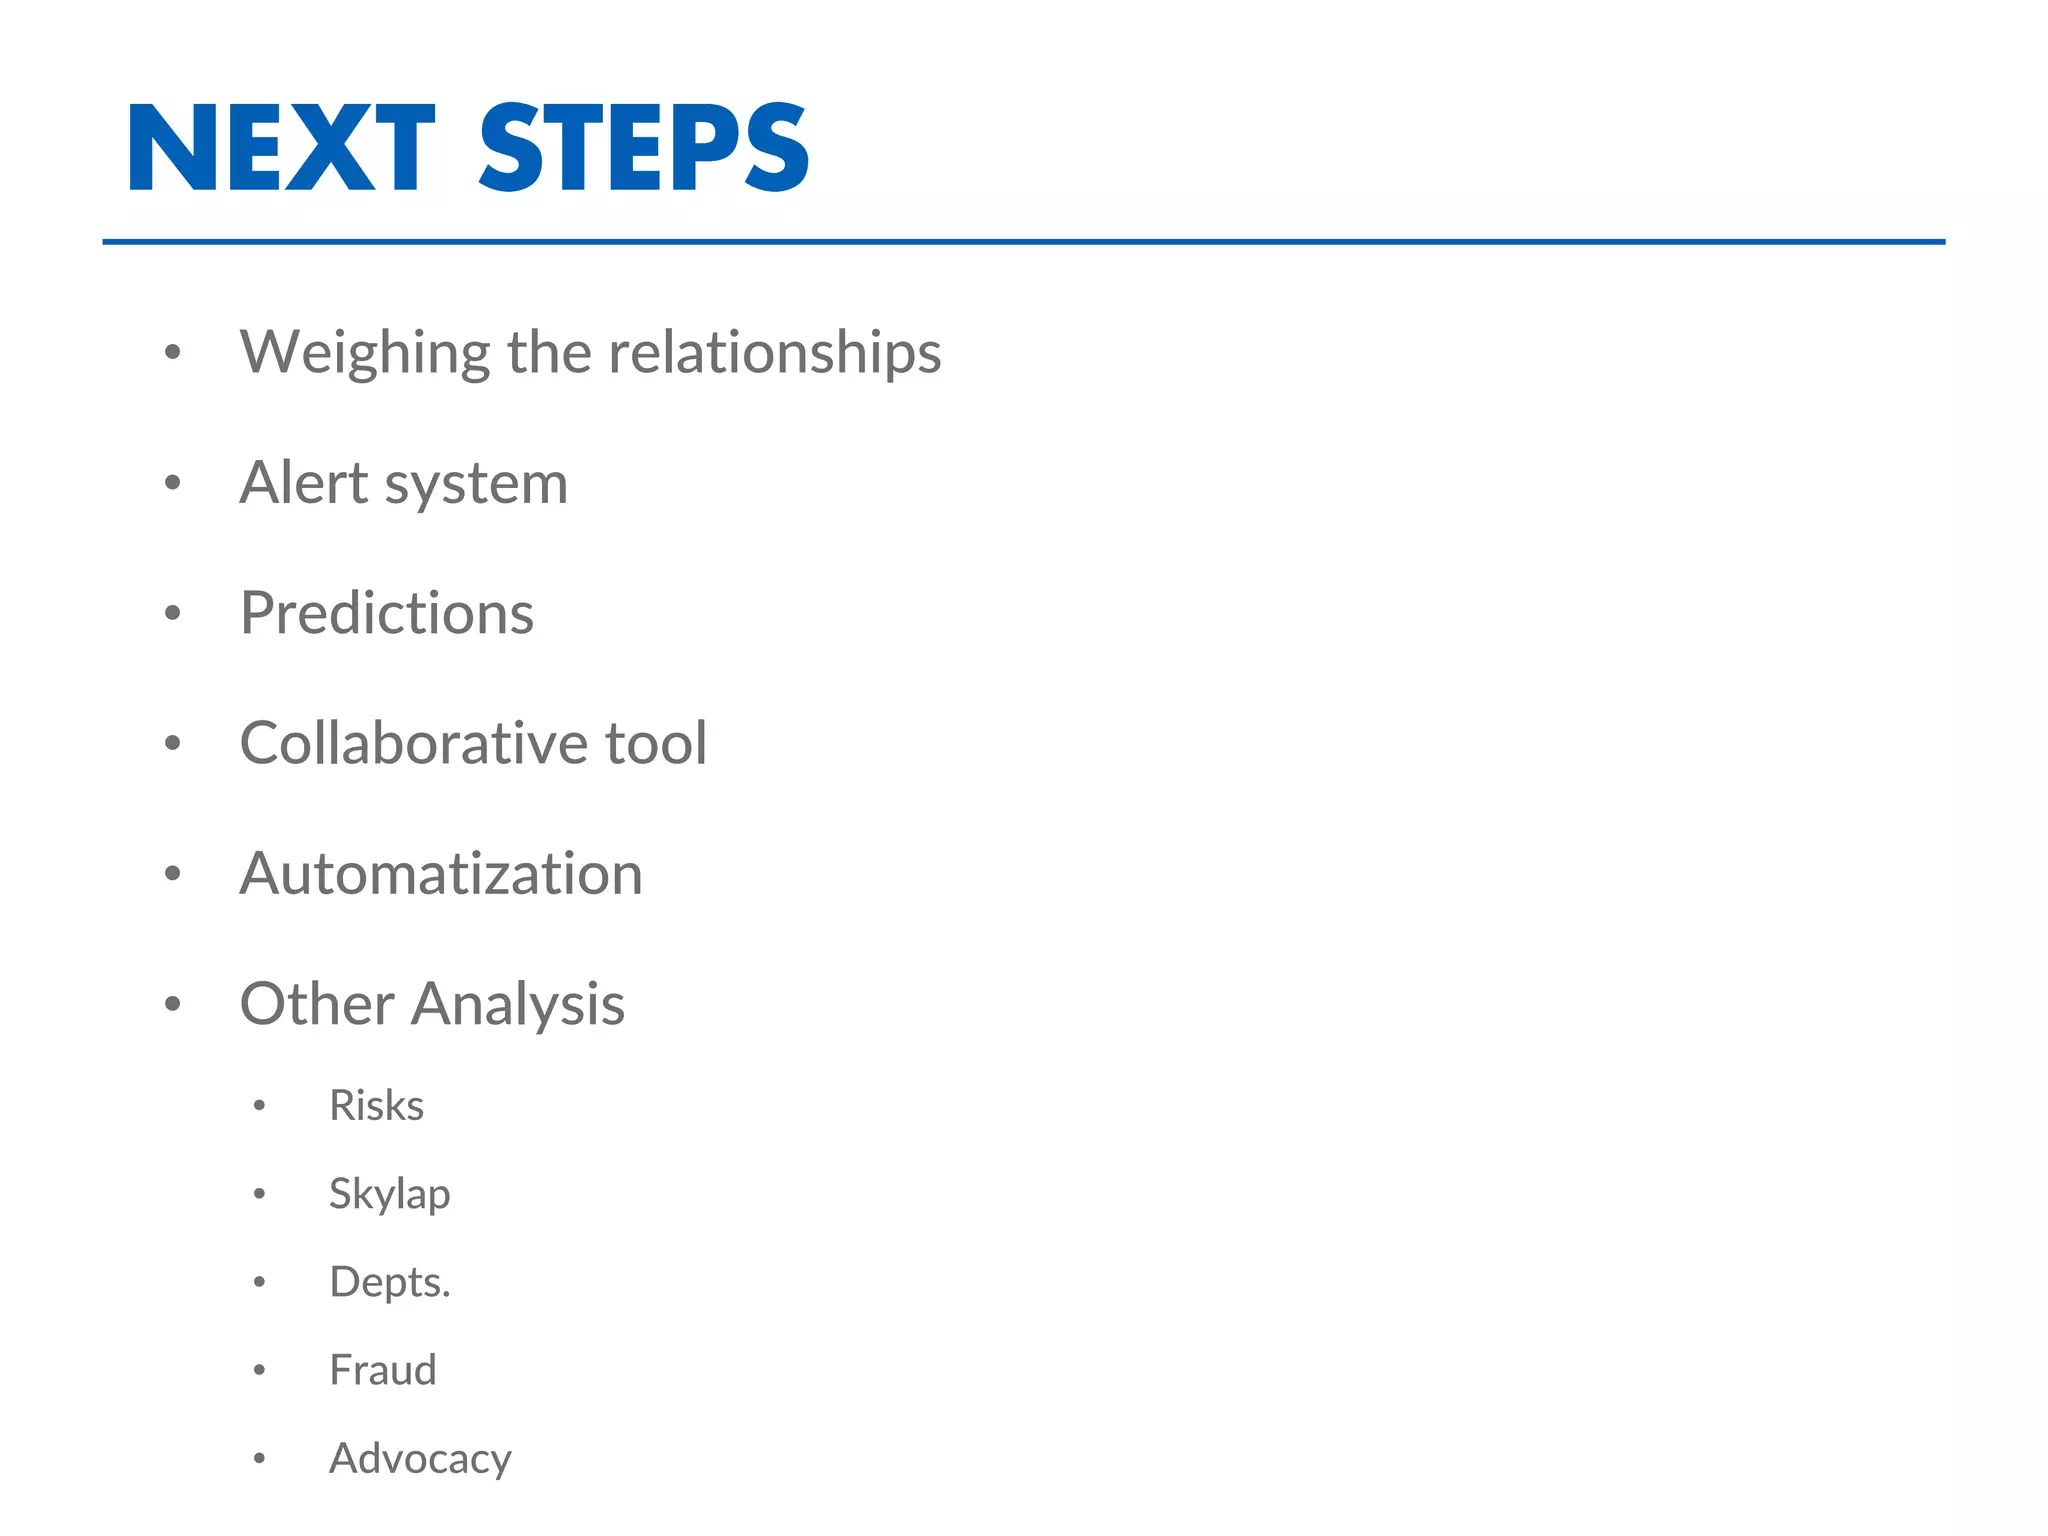

This document discusses empowering NGOs with graph technology. It describes a pilot project between Action Against Hunger Spain and Graphs for Good to use graph databases and analytics. The goals are to improve knowledge management by modeling complex relationships between data, enable qualitative analysis, and democratize data access to enhance decision making, accountability, and stakeholder engagement while addressing challenges around resources, security, and long-term planning.
![Where does Data Democracy begin? [Segment-Synapse, 2019]](https://cdn.slidesharecdn.com/ss_thumbnails/sunbasketsynapse2019agfinal-190928134248-thumbnail.jpg?width=640&height=640&fit=bounds)