Accelerating success in Vietnam real estate
•
1 like•352 views

Colliers International Vietnam Quarterly Knowledge Report for an economic overview and analysis on the Residence, Serviced Apartment, Office, Retail, Condominium, Villa/Townhouse and Industry Real Estate market in Vietnam.

Recommended
Recommended
More Related Content
What's hot
What's hot (20)
Similar to Accelerating success in Vietnam real estate
Similar to Accelerating success in Vietnam real estate (20)
More from Colliers International | Vietnam
More from Colliers International | Vietnam (17)
Recently uploaded
Recently uploaded (20)
Accelerating success in Vietnam real estate
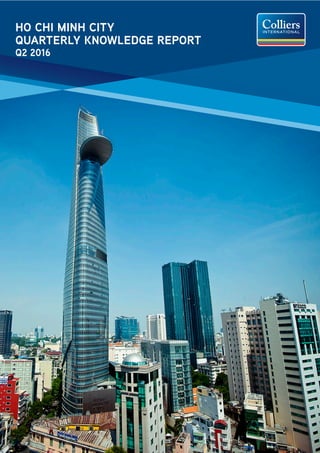
- 1. Accelerating success www.colliers.com/vietnam HO CHI MINH CITY QUARTERLY KNOWLEDGE REPORT Q2 2016
- 2. TABLE OF CONTENTS ECONOMIC OVERVIEW............................................................................................................... VIETNAM .................................................................................................................................... HO CHI MINH CITY ...................................................................................................................... HA NOI ........................................................................................................................................ HO CHI MINH CITY MARKET OVERVIEW ........................................................................ OFFICE ........................................................................................................................................ RETAIL ........................................................................................................................................ CONDOMINIUM ............................................................................................................................ VILLA & TOWNHOUSE ................................................................................................................. SERVICED APARTMENT .............................................................................................................. INDUSTRIAL ................................................................................................................................ Cover Page: Saigon Skyline 4-5 4 5 5 6-18 6 9 11 13 15 17 Page
- 3. LIST OF FIGURES Figure 1: Vietnam GDP ..................................................................................................................... Figure 2: International Arrivals to Vietnam in 1H 2016 ...................................................................... Figure 3: FDI Capital of HCMC and Hanoi .......................................................................................... Figure 4: GDP Growth Rate of HCMC and Hanoi ................................................................................ HO CHI MINH CITY MARKET OVERVIEW Figure 5: Office, Net Absorption ......................................................................................................... Figure 6: Office, Occupancy Rate ....................................................................................................... Figure 7: Retail, Market Performance................................................................................................... Figure 8: Retail, Average Asking Rent ................................................................................................ Figure 9: Condominium, New Launches and Sold Units by Year .......................................................... Figure 10: Condominium, New Launches by Segment and Quarter....................................................... Figure 11: Condominium, Sold Units by Segment and Quarter.............................................................. Figure 12: Villa and Townhouse, Changes in Asking Price.................................................................... Figure 13: Villa and Townhouse, Supply by Year ................................................................................. Figure 14: Villa and Townhouse, Primary Stock by District ................................................................. Figure 15: Serviced Apartment, Current Grade A&B Supply ............................................................... Figure 16: Serviced Apartment, Average Asking Rent by Grade ........................................................... Figure 17: Industrial, Market Performance........................................................................................... Figure 18: Industrial, Supply by District .............................................................................................. LIST OF TABLES Table 1: Macroeconomic Indicators of HCMC and Hanoi ...................................................................... Table 2: Office, Future Supply ............................................................................................................ Table 3: Significant Office Projects .................................................................................................... Table 4: Retail, Significant Future Projects under Construction .......................................................... Table 5: Significant Retail Projects .................................................................................................... Table 6: Condominium, Significant new Projects launched in Q2 2016 ................................................ Table 7: Villa and Townhouse, Significant new Projects launched in Q2 2016 ...................................... Table 8: Serviced Apartment, Significant Future Projects under construction ..................................... Table 9: Significant Serviced Apartment Projects ............................................................................... Table 10: Industrial, Future Supply ..................................................................................................... Table 11: Industrial, Market Overview ................................................................................................ 4 4 5 5 6 6 9 9 11 11 11 13 13 13 15 15 17 17 5 6 7 8 10 12 14 15 16 17 18 Page
- 4. GDP In the first six months of 2016 (1H2016), Vietnam’s GDP grew 5.52%. Although the growth rate was higher than that of 2012-2014, there were signs of slowdown when comparing to the increase of 6.32% in the same period last year. Adverse weather, including drought in the Central Highlands and salination in the Mekong Delta, resulted in the reduction of 0.8% in the agriculture output in 1H 2016. To achieve the projected economic growth of 6.7% this year, the country must push its GDP to 7.6% in the remaining of 2016. CPI Average CPI of 1H2016 climbed by 1.72% y-o-y while the core CPI (excluding energy and food prices) grew 1.80% y-o-y. An increase was seen in 10 out of 11 goods and service groups, with transport posting the highest rise at 2.99%, followed by housing and construction materials at 0.55%, restaurant services 0.21%, culture, entertainment and tourism 0.18%, and alcohol and tobacco 0.13%. Only the post and telecommunications group saw a drop of 0.06%. The rising fees of health care services, education and fuel will continue to put pressure on CPI in the rest of the year. FDI The total FDI registered in Vietnam in the first half of the year reached USD11.3 billion, significantly up 105.4% y-o-y. Of the total, USD7.5 billion came from 1,145 newly licensed projects, representing a yearly increase of 95.3% in capital and 51.3% in the number of projects. The remainder was contributed by 535 already-operating projects that had raised their capital by more than USD 3.78 billion, or 129% year-on-year (y-o-y). Disbursement of FDI surged to an estimated USD 7.25 billion in the six-month period, a y-o-y rise of 15% percent. Manufacturing and processing industries continued to be the top sector, following by the real estate sector and the science and technology sector, comprising 71%, 5.3% and 5% of the total registered FDI respectively. RETAIL SALES In the first six months of 2016, Vietnam’s retail sales of goods and services reached USD76.6 billion, up 9.5% compared to the same period last year. If the price factor was excluded, the growth rate would be 7.5%, lower than the increase of 8.8% in the same period in 2015. Specifically, retail sales of accommodation and catering services reached USD17 billion, accounting for 11.3% of the total sales, up 7.4% y-o-y. Retail sales of tourism services, which made up 0.9% of the total sales, reached USD666.7 million, up 9.6% y-o-y. Retails sales of other services which accounted for 11.6% of total sales, estimated USD8.9 billion, up 9.2% y-o-y. INTERNATIONAL ARRIVALS International visitors to Vietnam in 1H2016 were estimated to reach more than 4.7 million arrivals, marking a y-o-y increase of 21.3%. Foreign arrivals by air reached over 3.92 million, up 26% y-o-y while arrivals by road saw a yearly rise of 31.3% to 710,000. However, arrivals by sea declined 27.8 % to 75,000. Growth was recorded in the number of tourists from several Asian and European countries. EXCHANGE RATE Contrary to early 2016 expectation, the exchange rate was kept stable in the first 6 months. Using a daily-adjusted central exchange rate mechanism, the SBV has succeeded in stabilizing the Vietnam dong for several quarters. The VND/USD rate experienced minor increases for just a few days after Brexit, but soon moved back to its steady state. Nevertheless, the exchange rate may experience a mild increase to 22,750 VND/USD in the next 6 months. Q2 2016 | ECONOMIC OVERVIEW ©2016 Colliers International Research VIETNAM QUARTERLY KNOWLEDGE REPORT Page 4 Q3 2016 forecast Figure 1: Vietnam GDP Source: World Bank | Colliers International Research Figure 2: International arrivals to Vietnam in 1H 2016 Source: Asian Development Bank (ADB) | Colliers International Research VIETNAM 0 500 1,000 1,500 2,000 2,500 0 1 2 3 4 5 6 7 8 2005 2006 2007 2008 2009 2010 2011 2012 2013 2014 2015 Q2 2016 USD/capita % GDP per capita (nominal) GDP growth rate 2,000 3,000 4,000 5,000 6,000 7,000 8,000 9,000 20052006200720082009 2010 2011 2012 2013 2014 2015 Q2 2016 thousandarrivals International tourist arrivals Average
- 5. Q2 2016 | ECONOMIC OVERVIEW ©2016 Colliers International Research VIETNAM QUARTERLY KNOWLEDGE REPORT Page 5 Figure 4: GDP Growth Rate of HCMC and Hanoi Source: General Statistics Office | Colliers International Research Source: General Statistics Office | Colliers International Research Table 1: Marcoeconomic Indicators of HCMC and Hanoi HCMC Hanoi Q2 2016 Q3 2016F Q2 2016 Q3 2016F GDP (billion) 21.2 10.6 FDI (million) 685.4 1,900 Retail sales (billion) 15.4 45.7 Export (billion) 14.78 5.2 Import (billion) 17.3 11.5 HO CHI MINH CITY In the first six months of 2016, the Gross Regional Domestic Product (GRDP) of Ho Chi Minh City reached USD21.2 billion with a stable increase of 7.47% y-o-y. Of total growth rate, trade and service sector contributed 4.19%, industrial and construction sector made up 2.16% while agriculture, forestry and fisheries sector accounted for 0.04%. As of 15 June 2016, FDI inflow of both newly registered and supplementary capital to the city reached 425 projects, worth of USD685.4 million. There are 367 new investment projects with capital reaching USD512.7 million. The average price index in the first six months of this year went up 1.02% on an annual basis Transportation sector had the biggest rise of 3.33% due to the hikes in fuel and gasoline price. Retail sales achieved USD15.4 billion, an increase 11.3% y-o-y. Export values reached USD14.78 billion, up 1.7% y-o-y. Garments, agricultural products and computers & electronic devices contributed the most to export values. Import values increased by 7.9% y-o-y, worth of USD17.3 billion. The top segments of import values were milk and dairy products, fuel, garment material, plastics and iron & steel. HANOI In 1H2016, Hanoi’s GRDP achieved USD10.6 billion with a growth rate of 7.34% y-o-y. Industrial and construction sector had the highest growth rate of 7.78%, followed by service sector with the growth rate of 7.49%. Agricultural-forestry-fishery witnessed a modest growth rate of 2.06%. CPI in the first six month of 2016 continued to rise, reaching 2.67% y-o-y. Transportation sector had the highest index mainly due to the increase in gasoline prices. Retail sales of Hanoi were up 9.7% y-o-y, reaching USD45.7 billion in which retail sector achieved USD10.7 billion, an increase of 8.6% y-o-y. In the first six months of 2016, the capital welcomed 1.5 million international visitors, an increment of 39.3% y-o-y while the growth rate of domestic tourists was 2% y-o-y. As of 21 June 2016, FDI inflows of both newly registered and supplementary capital reached USD1.9 billion, triple the amount of this period in 2015 and achieved 95% of year’s target. In 1H 2016, export values grew 0.1% y-o-y, reaching USD5.2 billion while those of import went down 4.2% y-o-y, achieving USD 11.5 billion. Figure 3: FDI Capital of HCMC and Hanoi Source: General Statistics Office | Colliers International Research 0 500 1000 1500 2000 2500 3000 Q1 Q2 Q3 Q4 Q1 Q2 Q3 Q4 Q1 Q2 Q3 Q4 Q1 Q2 Q3 Q4 Q1 Q2 2012 2013 2014 2015 2016 USDmillion HCMC Hanoi 6% 8% 10% 12% 14% 2005 2006 2007 2008 2009 2010 2011 2012 2013 2014 2015 Q2 2016 HCMC Hanoi
- 6. Figure 6: Office, Occupancy Rate PERFORMANCE Strong leasing activities helped to increase occupancy rates across all grades by 2.4ppts, averaging at 96%. Grade A and Grade B’s occupancy rate were 95% and 96.8%, up 3.3ppts and 2.1% ppts respectively. Average net asking rent slilghtly improved 1.4ppts, reaching USD24.5/sqm/month. Both Grade A and Grade B achieved nominal rental growth of 1.9ppts and 1.1ppts, staying at USD37.7/ sqm/month and USD20.9/sqm/month respectively. SUPPLY The first half of 2016 recorded no new supply, which supported the existing landlords to aborb vacant space. The CBD is still the prime location for top-graded commercial office properties, with more than half of the city’s stock, including all Grade A buildings and the majority of Grade B buildings. Despite high land cost and limited land availability, the city center will continue to be home in the notable future with office supply such as Deutsches Haus and Saigon Centre (Phase 2), Saigon One Tower and The One entering the market in 2017. DEMAND Apart from traditional drivers of relocation and expansion, it is observed that demand for flexible workspace is rising globally and in Asia due to the arrival of a new generation of workers, increased attention to technology and innovation, and the rise of flexible working operators offering serviced offices and coworking space. As flexible working operators tend to seek large floorplates with plenty of natural light, it is essential for developers to incorporate new features into building design to improve the working environment for the end-users. OUTLOOK By the end of 2016, all new supply will be of Grade B, providing approximately 60,000sqm NLA from three developments. One project will be located in the city center while the other two are in decentralised districts. With limited vacant space, landlords of Grade A buildings will try to maintain higher asking rents and secure large scale occupiers. Q2 2016 | HO CHI MINH CITY | OFFICE ©2016 Colliers International Research VIETNAM QUARTERLY KNOWLEDGE REPORT Page 6 Table 2: Office, Future Supply Source: Colliers International Research Source: Colliers International Research Source: Colliers International Research Figure 5: Office, Average Asking Rent Project name Grade NLA (sqm) Expected Completion SGGP Building B 16,940 Q4 2016 HQC Royal Tower B 22,500 Q4 2016 Mapletree Business Center B+ 30,000 Q4 2016 50 60 70 80 90 100 Q1 Q2 Q3 Q4 Q1 Q2 Q3 Q4 Q1 Q2 Q3 Q4 Q1 Q2 Q3 Q4 Q1 Q2 Q3 Q4 Q1 Q2 2011 2012 2013 2014 2015 2016 Grade A Grade B% 0 10 20 30 40 50 60 70 Q1 Q2 Q3 Q4 Q1 Q2 Q3 Q4 Q1 Q2 Q3 Q4 Q1 Q2 Q3 Q4 Q1 Q2 Q3 Q4 Q1 Q2 2011 2012 2013 2014 2015 2016 US$/sqm/month Grade A Grade B
- 7. Q2 2016 | HO CHI MINH CITY | OFFICE ©2016 Colliers International Research VIETNAM QUARTERLY KNOWLEDGE REPORT Page 7 (*) US$/sqm/month (NLA) Table 3: Significant Office Projects No Name Address Completion Year NLA (sqm) Service Charges (*) Occupancy rate Average asking rent (**) 1 Saigon Centre 65 Le Loi 1996 11,650 9.0 99% 38.0 2 Saigon Tower 29 Le Duan 1997 13,950 8.0 99% 40.0 3 Sunwah Tower 115 Nguyen Hue 1997 20,800 8.0 100% 40.0 4 The Metropolitan 235 Dong Khoi 1997 15,200 8.0 93% 40.0 5 Diamond Plaza 34 Le Duan 1999 15,936 8.0 81% 35.0 6 Kumho Asiana Plaza 39 Le Duan 2009 26,000 8.0 91% 45.0 7 Bitexco Financial Tower 45 Ngo Duc Ke 2010 37,710 8.0 99% 34.0 8 President Place 93 Nguyen Du 2012 8,330 7.0 97% 33.0 9 Times Square 22-36 Nguyen Hue 2012 12,704 7.0 94% 40.0 10 Le Meridien 3C Ton Duc Thang 2013 9,125 6.0 88% 30.0 11 Vietcombank Tower 5 Me Linh Square 2015 41,250 7.0 97% 37.0 Grade A 212,655 7.7 95% 37.7 1 VTP-OSIC 8 Nguyen Hue 1993 6,500 6.0 99% 25.0 2 Yo Co Building 41 Nguyen Thi Minh Khai 1995 5,000 3.0 98% 23.0 3 Somerset Chancellor Court 21-23 NguyenThi Minh Khai 1996 3,200 5.0 100% 22.0 4 Central Plaza 17 Le Duan 1997 6,094 6.5 90% 26.0 5 Harbour View Tower 35 Nguyen Hue 1997 8,000 5.0 100% 28.0 6 Saigon Riverside Office 2A-4A Ton Duc Thang 1997 10,000 6.5 99% 24.0 7 Saigon Trade Center 37 Ton Duc Thang 1997 31,416 5.0 93% 20.0 8 MeLinh Point Tower 2 Ngo Duc Ke 1999 17,600 6.0 99% 35.5 9 Zen Plaza 54-56 Nguyen Trai 2001 11,037 5.0 92% 23.0 10 Bitexco Building 19-25 Nguyen Hue 2003 6,000 6.0 95% 27.0 11 The Landmark 5B Ton Duc Thang 2005 8,000 6.0 100% 20.0 12 Opera View 161-167 Dong Khoi 2006 3,100 7.0 100% 27.0 13 City Light 45 Vo Thi Sau 2007 10,000 6.5 97% 25.0 14 Petro Tower 1-5 Le Duan 2007 13,304 6.5 100% 26.0 15 The Lancaster 22 – 22 Bis Le Thanh Ton 2007 7,000 5.0 93% 25.0 16 CJ Building 5 Le Thanh Ton 2008 14,000 6.5 99% 25.0 17 Continential Tower 81-85 Ham Nghi 2008 15,000 6.0 99% 22.0 18 Havana Tower 132 Ham Nghi 2008 7,326 6.0 84% 22.0 19 Royal Center 235 Nguyen Van Cu 2008 14,320 6.0 100% 23.0 20 Sailing Tower 51 Nguyen Thi Minh Khai 2008 16,910 6.0 100% 26.0 21 TMS 172 Hai Ba Trung 2009 4,000 4.0 100% 24.0 22 A&B Tower 76 Le Lai 2010 17,120 6.0 99% 30.0 23 Bao Viet Tower 233 Dong Khoi 2010 10,650 5.0 100% 22.0 24 Green Power Tower 35 Ton Duc Thang 2010 15,600 6.0 99% 25.0 25 Maritime Bank Tower 192 Nguyen Cong Tru 2010 19,596 5.0 89% 21.0 26 Saigon Royal 91 Pasteur 2010 5,340 6.0 100% 23.0 27 Vincom Center 68 -70 -72 Le Thanh Ton 2010 56,600 5.0 91% 24.0 28 Empress Tower 138 Hai Ba Trung 2012 19,538 6.0 100% 30.0 29 Lim Tower 9-11 Ton Duc Thang 2013 22,000 6.0 99% 28.0 30 MB Sunny Tower 259 Tran Hung Dao, Co Giang 2013 13,200 5.5 95% 23.0 31 Lim Tower 2 Vo Van Tan 2015 8,400 5.5 100% 24.0 Grade B 405,851 5.7 96.8% 26.6
- 8. Q2 2016 | HO CHI MINH CITY | OFFICE ©2016 Colliers International Research VIETNAM QUARTERLY KNOWLEDGE REPORT Page 8 SAIGON SKYLINE REVIEW- CBD HCMC GRADE A OFFICE BUILDINGS KUMHO ASIANA PLAZA 39 Le Duan, District 1 26,000/1,402 $ 45.00 $ 8.00 DIAMOND PLAZA SAIGON 34 Le Duan, District 1 15,936/2,200 $ 35.00 $ 8.00 LE MERIDIEN 3C Ton Duc Thang, District 1 9,125/NA $ 30.00 $ 6.00 SAIGON TOWER 29 Le Duan, District 1 13,950/NA $ 40.00 $ 6.00 DEUTSCHES HAUS 3-5 Le Van Huu, District 1 THE METROPOLITAN 235 Dong Khoi, District 1 15,200/1,000 $ 40.00 $ 6.00 PRESIDENT PLACE 93 Nguyen Du, District 1 8,330/1,000 $ 42.00 $ 7.00 BITEXCO FINANCIAL TOWER 45 Ngo Duc Ke, District 1 37,710/900-1,300 $ 34.00 $ 8.00 VIETCOMBANK TOWER 5 Me Linh Square, District 1 41,250/NA $ 37.00 $ 7.00 TIMES SQUARE SAIGON 22-36 Nguyen Hue, District 1 12,704/1,450 $ 40.00 $ 7.00 SAIGON CENTRE 65 Le Loi, District 1 11,650/ 1,073 $ 38.00 $ 6.50 SUNWAH TOWER 115 Nguyen Hue, District 1 20,800/ 1,166 $ 40.00 $ 6.00
- 9. Q2 2016 | HO CHI MINH CITY | RETAIL ©2016 Colliers International Research VIETNAM QUARTERLY KNOWLEDGE REPORT Page 9 Table 4: Retail, Significant future projects under construction PERFORMANCE The CBD maintained their average net asking rent of USD125/ net sqm/month while the non-CBD reduced their rent by 3.8% q-o-q, staying at USD36.4/sqm/month. The closing of one department store increased rental rate of this segment by 1% q-o-q. In contrast, shopping centers were down 2% q-o-q in rents while retail podiums maintained their asking rates. The retail market remained tight with the average occupancy rate of 92%, up 0.43ppts q-o-q. SUPPLY The retail market welcomed one new shopping center in Go Vap District, providing an NLA of 26,651sqm. Being the 12th outlets in Vietnam, the three-storey Lotte Mart Go Vap is built under a much different model, featuring an entertainment area, a supermarket, and a cinema on each floor. After five years of operation, the Parkson Paragon shopping mall in District 7 was shut down for relocation. The closure was claimed by poor business performance, marking the withdrawal of 7,500sqm NLA. This was converted to office space. DEMAND Ho Chi Minh City is a promising retail market and has witnessed fierce competition between foreign and domestic retailers in recent years. While overseas companies have advantages in capital, distribution chain and shop design, local operators are facing challenges in professional factors, competitiveness in pricing, diversification in products and control in quality of products. As the two parties are competing to gain more local market shares, demand for retail properties will be strengthened. OUTLOOK The retail market will be more buoyant with new shopping centers to be opened later this year. Two new properties will be located in the city center while the other will be in a non-urban district to take advantage of its growing number of local consumers. Rents are forecasted to be softened due to abundant new supply while vacancy rates will remain low thanks to good pre-leasing actitivties. Figure 8: Retail, Average Asking rent Source: Colliers International Research Source: Colliers International Research Figure 7: Retail, Market performance Source: Colliers International Research 0 10 20 30 40 50 60 70 80 90 100 90% 92% 94% 96% 98% 100% Podium Department store Shopping centre USD/sqm/month Average asking rent Average occupancy 15 21 13 0 50 100 150 200 250 300 350 Retail Podium Department Store Shopping Centre USD/sqm/month Min average asking rent Max average asking rent Project name District NLA (sqm) Expected Completion Saigon Center (phase 2) 1 47,000 Q3 2016 Aeon Mall Binh Tan Binh Tan 60,000 Q3 2016 Union Square 1 39,000 Q4 2016
- 10. Q2 2016 | HO CHI MINH CITY | RETAIL VIETNAM QUARTERLY KNOWLEDGE REPORT ©2016 Colliers International Research Page 10 Table 3: Significant Office Projects (*) ARR (Average Rental Rate): All rents are stated in net rents per sqm, inclusive service charge but exculding VAT Table 5: Significant Retail Projects No Name of Project/Building Address Location Completion Year NLA (sq m) ARR (*) Occupancy Rate 1 Hotel Continental Sai Gon 132-134 Dong Khoi District 1 2000 200 90 100% 2 Caravelle Hotel 19 Lam Son Square District 1 2000 150 220 100% 3 New World Hotel 76 Le Lai District 1 2000 1,000 60 100% 4 Sheraton Saigon 88 Dong Khoi District 1 2002 750 200 100% 5 Opera View Lam Son Square District 1 2006 1,260 200 100% 6 The Manor 1 91 Nguyen Huu Canh Binh Thanh 2006 2,000 10-30 100% 7 Saigon Pearl 92 Nguyen Huu Canh Binh Thanh 2009 5,000 22 97% 8 Rex Arcade 141 Nguyen Hue District 1 2010 2,000 120 100% 9 The Manor 2 91 Nguyen Huu Canh Binh Thanh 2010 2,500 10-30 100% 10 Bitexco Financial Tower 45 Ngo Duc Ke District 1 2011 8,000 50 98% 11 The Vista Walk Hanoi Highway District 2 2012 10,000 20 97% 12 President Place 93 Nguyen Du District 1 2012 800 42 98% 13 Times Square 22-36 Nguyen Hue District 1 2012 9,000 300 100% 14 Saigon Airport Plaza 1 Bach Dang Tan Binh 2013 7,623 15 100% Retail Podium 50,283 87.0 99% 1 Zen Plaza 54-56 Nguyen Trai District 1 2001 6,817 55-60 100% 2 Parkson Hung Vuong Plaza 126 Hung Vuong District 5 2007 24,000 60 100% 3 Kumho Asiana Plaza 35 Le Duan District 1 2009 6,830 60 100% 4 Parkson Flemington 184 Le Dai Hanh District 11 2009 26,000 20 99% 5 Parkson Paragon 3 Nguyen Luong Bang District 7 2011 7,500 40 90% 6 Parkson C.T Plaza 60A Truong Son Tan Binh 2012 12,235 21 100% 7 Parkson Cantavil Premier Hanoi Highway District 2 2013 17,815 25-30 98% 8 Taka Plaza 102 Nam Ky Khoi Nghia District 1 2011 1,000 70 100% Department Store 102,197 38.0 99% 1 Diamond Plaza 34 Le Duan District 1 1999 9,000 90 100% 2 Parkson Saigontourist Plaza 35 Le Thanh Ton District 1 2002 17,000 30 98% 3 Saigon Center 35 Nam Ky Khoi Nghia District 1 1996 Renovation Renovation Renovation 4 City Plaza 102 Nam Ky Khoi Nghia District 1 2000 Renovation Renovation Renovation 5 Superbowl Vietnam TSN 38 Nguyen Hue Tan Binh 2002 5,500 22 96% 7 An Dong Plaza 18 An Duong Vuong District 5 2004 18,000 61 95% 8 Saigon Square 1 77-89 Nam Ky Khoi Nghia District 1 2006 1,300 167 100% 9 Nowzone 235 Nguyen Van Cu District 1 2008 9,000 60 99% 10 Lotte Mart Saigon South 469 Nguyen Huu Tho District 7 2008 24,000 50 100% 12 Vincom Center B 72 Le Thanh Ton District 1 2010 45,000 150 100% 13 Maximark 3/2 Extention 3/2 Street District 10 2010 25,000 35 90% 14 Lotte Mart Phu Tho Le Dai Hanh District 11 2010 24,500 13 99% 15 Crescent Mall Nguyen Van Linh District 7 2011 45,000 25 100% 16 Satra Pham Hung Pham Hung District 8 2011 11,528 14 100% 17 CMC Plaza 79B Ly Thuong Kiet Tan Binh 2011 Renovation Renovation Renovation 18 Union Square Dong Khoi District 1 2012 38,000 90-97 New opening Shopping Centre 272,828 62.0 98%
- 11. Accelerating success Q2 2016 | HO CHI MINH CITY | CONDOMINIUM VIETNAM QUARTERLY KNOWLEDGE REPORT ©2016 Colliers International Research Page 11 Table 3: Significant Office ProjectsPERFORMANCE The second quarter of 2016 recorded 5,785 successful transactions across all segments, down 35% compared to the previous quarter. Thanks to real demand from end-users, apartments valued from USD40,000-90,000 had stronger net absorption than those of higher value. The primary asking price declined 0.3% q-o-q as a result of increasing supply and moderate demand. Developers have been monitoring the market movement to adjust their price appropriately. SUPPLY There were 8,861 units launched from 17 projects, marking a 30.5% lower than the previous quarter in terms of total new supply. The mid-end segment took the highest market share of 51%, providing 4,519 units. By location, most of new supply is located in District 2, District 7, District 9 and Binh Thanh District where having large land availability. DEMAND It is observed that the mortgage market has gradually become more common in Vietnam. The change is being driven by the fact that 60% of Vietnamese are under the age of 35 and migration into cities is rising. As the younger generation have decent jobs with stable income, their ability to own properties through home loans increases. Real estate loans, which account for 13% of total bank lending in Ho Chi City in 1H2016, are contributing to a property rebound that has seen a surge in condominium sales since last year. OUTLOOK Demand for owner occupation and for investment will continue to lead the market. With more joint ventures set up between local and foreign developers such as Nam Long- Hankyu Realty- Nishi Nippon Railroad, An Gia-Creed Group-Phat Dat, Tien Phuoc-Keppel Land- Gaw Capital-Tran Thai, the real estate industry will see a growing number of high quality residential products. Figure 9: Condominium, New Launches and Sold Units by year Source: Colliers International Research Figure 11: Condominium, Sold Units by Segment and Quarter Source: Colliers International Research Figure 10: Condominium, New launches by Segment and Quarter Source: Colliers International Research 0 5,000 10,000 15,000 20,000 25,000 30,000 35,000 40,000 45,000 2012 2013 2014 2015 1H2016 units New Launches Sold Units 0 1,000 2,000 3,000 4,000 5,000 6,000 7,000 Q1 Q2 Q3 Q4 Q1 Q2 Q3 Q4 Q1 Q2 Q3 Q4 Q1 Q2 Q3 Q4 Q1 Q2 2012 2013 2014 2015 2016 units Luxury High-end Mid-end Affordable 0 2,000 4,000 6,000 8,000 10,000 12,000 Q1 Q2 Q3 Q4 Q1 Q2 Q3 Q4 Q1 Q2 Q3 Q4 Q1 Q2 Q3 Q4 Q1 Q2 2012 2013 2014 2015 2016 units Luxury High-end Mid-end Affordable
- 12. Accelerating success Q2 2016 | HO CHI MINH CITY | CONDOMINIUM VIETNAM QUARTERLY KNOWLEDGE REPORT ©2016 Colliers International Research Page 12 Table 6: Condominium, Significant new projects launched in Q2 2016 No Name of Project/Building Developer Location Completion Year Number of units Asking Price (US$/sqm) 1 The Southern Dragon - last phase Son Thuan Corp Tan Phu 2016 1,136 1,100 2 Flora Fuji (Phase 1) Nam Long, Hankyu Realty & Nishi Nippon Railroad District 9 2017 200 750 3 Saigon Mia Hung Thinh Corp Binh Chanh 2017 156 1,500 4 Summer Square Gotec Viet Nam District 6 2017 256 1,100 5 Valéo Dam Sen Phu Nhuan House Tan Phu 2017 104 1,500-2,000 6 Soho Premier SGCC Binh Thanh 2017 168 1,000 7 Heaven Riverview An Phuc District 8 2017 480 700 8 Vista Verde CapitaLand District 2 2017 200 1,500 9 Duc Long New Land Duc Long Golden Land Group District 8 2018 886 1,200-1,300 10 An Gia River City An Gia - Creed Group District 7 2018 1,000 1,300 11 Elite Park Geleximco - Vinacomin Binh Thanh 2018 208 1,500 12 Diamond City (Blue Diamond Tower) Hoan Cau Group District 7 2018 726 1,500 13 Thu Thiem Lake view CII District 2 2018 113 900 14 Duc Long Golden Land Duc Long Gia Lai Group District 7 2018 495 1,100-1,200 15 Centana Thu Thiem Dien Phuc Thanh Corp District 2 2019 422 1,200 16 Diamond Riverside NBB, CII District 8 2019 1,700 750 17 Saigon Royal NovaLand District 4 2019 611 2,500 New launches in Q2 2016 8,861 * Excluding all kinds of tax, promotions and management fee The information is updated as at the end of Q2 2016
- 13. Accelerating success Q2 2016 | HO CHI MINH CITY | VILLA & TOWNHOUSE VIETNAM QUARTERLY KNOWLEDGE REPORT ©2016 Colliers International Research Page 13 PERFORMANCE Sales of landed properties recorded a significant increase of 68% q-o-q. Successful transactions were led by townhouses, showing rising preferences for this type of property. Asking price was higher on both primary and secondary market, up 2.8% and 4.1% q-o-q respectively. Projects in District 2 and District 9 witnessed strongest price appreciation thanks to upgrading infrastructure in these localities. SUPPLY Seven projects were launched in the review quarter, providing approximately new 444 villas and townhouses. One of the most notable projects is Vinhomes Golden River, offering 63 luxury villas with land area from 225– 475sqm. Located right in the heart of District 1 and within a multifunctional township, it has been an attractive option for both homebuyers and investors. It is observed that developers have reduced sizes of landed property products to make it more affordable for buyers and combate against rising construction costs. DEMAND The villa and townhouse segment have seen stronger demand since the market recovery in late 2014. As landed properties often come with quality fittings and finishes, and are well-served with a wide range of facilities and amenities, these dwellings will continue to see demand from homebuyers seeking well-located quality residences. This type of property has also drawn robust interest from investors who are looking for high rental return and long-term capital growth. OUTLOOK It is expected that approximately 1,000 dwellings will be launched in 2H2016. The East and the South area will continue to lead new supply while the Western area is of high potential to grow in the future. Sale price will maintain the upward trend thanks to high market sentiment. Figure 12: Villa and Townhouse, Changes in Asking Prices Source: Colliers International Research Figure 14: Villa and Townhouse, Primary Stock by District Source: Colliers International Research Figure 13: Villa&Townhouse, Supply by Year Source: Colliers International Research 0.0% 1.0% 2.0% 3.0% 4.0% 5.0% 6.0% 7.0% 8.0% Primary market Secondary market q-o-q changes y-o-y changes 0 1000 2000 3000 4000 5000 6000 7000 8000 2002 2003 2004 2005 2006 2007 2008 2009 2010 2011 2012 2013 2014 2015 Q2 2016 Existing supply New supply units Dist. 2 37% Dist. 9 19% Nha Be 16% Binh Tan 7% Go Vap 6% Thu Duc 5% Dist. 12 2% Binh Thanh 3% Binh Chanh 3% Dist. 7 2%
- 14. Accelerating success Q2 2016 | HO CHI MINH CITY | VILLA & TOWNHOUSE VIETNAM QUARTERLY KNOWLEDGE REPORT ©2016 Colliers International Research Page 14 Table 7: Villa and Townhouse, Significant new projects launched in Q2 2016 No Name of Project/Building Developer Location Completion Year Number of units Asking Price (US$/sqm) 1 Feliza (Phase 2 of Hoja project) Khang Dien Dist. 9 2016 15 1,600 2 Holm Residences Sapphire Dist. 2 2016 29 5,800 3 VX HOME TX 38 Van Xuan Dist. 12 2016 17 1,100 4 VX HOME TL 13 Van Xuan Dist. 12 2016 18 650 5 Fuji Residence Nam Long Dist. 9 2016 84 1,500 6 Saroma Villa Dai Quang Minh Dist. 2 2016 166 6,600-7,100 7 Ha Do Centrosa Garden Ha Do Group Dist. 10 2019 115 6,500 New launches in Q2 2016 444
- 15. Accelerating success Q2 2016 | HO CHI MINH CITY | SERVICED APARTMENT VIETNAM QUARTERLY KNOWLEDGE REPORT ©2016 Colliers International Research Page 15 PERFORMANCE A and B grade recorded an improvement in both rents and occupancy rates over the quarter. Grade A’s average occupancy rate increased by 1.27ppts, reaching 87.5%. The average gross asking rent was up by 1.0ppts q-o-q, staying at USD30.2/sqm/ month. Grade B’s average occupancy rate rose by 88.6%, up 0.45ppts while rental rate saw an improvement of 0.89ppts, averaging at USD22.6/sqm/month. SUPPLY The total stock increased by 5.2% q-o-q with the opening of one new Grade B project in district 3. Combining the service and style of a luxury hotel with the convenience and facilities of a modern serviced apartment building, the 217 unit-Sila Urban Living offers different accommodation options, ranging from studios to one- and two-bedroom apartments. The stock will grow substantially by 2018 with nearly 3,000 serviced apartments entering the market. Future projects will be decentralised to East and South Districts. DEMAND In the first half of 2016, FDI to the city totaled USD512.7 million with 367 projects. This in turn creates demand for quality accommodation, including serviced residences for expatriates. Popularity in serviced apartments is forecasted to keep increasing as leisure and business guests enjoy the variety, range, flexibility and value for money that this type of accommodation can offer. OUTLOOK Existing developments will see challenges in the long term when new projects are opened. Rents are forecasted to be softened to achieve high occupied rates. Competition will be more intense with the growing number of buy-to-let apartments and private houses who tend to offer competitive rents for long-term stays. Project name District Total units Expected Completion Ascott Waterfront Saigon 1 222 Q3 2016 Saigon Plaza 1 119 Q4 2016 New Pearl 3 120 Q4 2016 Saigon Centre Phase 2 1 216 2017 Saigon South Place 7 480 2017 Berkley Service Residence 2 85 2017 Table 8: Serviced apartment, Significant future projects under construction Source: Colliers International Research Figure 15: Serviced Apartment, Current grade A&B supply Source: Colliers International Research Figure 16: Serviced Apartment, Average asking rent by grade Source: Colliers International Research 0 1,000 2,000 3,000 4,000 2010 2011 2012 2013 2014 2015 Q2 2016 units Grade A Grade B 15 20 25 30 35 2010 2011 2012 2013 2014 2015 Q2 2016 US$/sqm/month Grade A Grade B
- 16. Accelerating success Q2 2016 | HO CHI MINH CITY | SERVICED APARTMENT VIETNAM QUARTERLY KNOWLEDGE REPORT ©2016 Colliers International Research Page 16 Table 9: Significant Serviced Apartment Projects No. Project Name Address Location Completion Year Total Room Average Occupancy ARR(*) (**) 1 The Landmark 5B Ton Duc Thang District 1 1995 66 95.0% 26.0 2 Sedona Suites 65 Le Loi District 1 1996 89 98.0% 34.0 3 Somerset Chancellor Court 21-23 Nguyen Thi Minh Khai District 1 1996 172 90.0% 32.0 4 Nguyen Du Park Villas 111 Nguyen Du District 1 2004 41 95.0% 17.0 5 The Lancaster 22-22 Bis Le Thanh Ton District 1 2007 55 73.0% 37.0 6 Intercontinental Asian Saigon 39 Le Duan District 1 2009 260 90.0% 36.0 Grade A 683 90.5% 32.7 1 Norfork Mansion 17-21 Ly Tu Trong District 1 1998 126 85.0% 34.0 2 Saigon Sky Garden 20 Le Thanh Ton District 1 1998 154 85.0% 26.0 3 Somerset HCM 8A Nguyen Binh Khiem District 1 1998 165 94.0% 26.0 4 Diamond Plaza 34 Le Duan District 1 1999 42 88.0% 25.0 5 Garden View Court 101 Nguyen Du District 1 2000 76 95.0% 23.0 6 Ben Thanh Luxury 172-174 Ky Con District 1 2010 88 91.0% 18.0 7 Lafayette De SaiGon 8 Phung Khac Khoan District 1 2010 18 89.0% 28.0 8 Vincom Center 45A Ly Tu Trong District 1 2010 60 34.0% 26.0 9 Nikko Saigon 235 Nguyen Van Cu District 1 2011 54 100.0% 34.0 10 Saigon City Residence 8A/3D2 Thai Van Lung District 1 2011 17 84.0% 23.0 11 Spring Court 1Bis Phung Khac Khoan District 1 2011 14 86.0% 17.0 Grade B 814 85.9% 26.4 (*) US/sqm/month (**) ARR (Average Rental Rate): All rents are stated in gross rents per sqm, not including VAT and serviced charge ©2016 Colliers International Research
- 17. Accelerating success Q2 2016 | HO CHI MINH CITY | INDUSTRIAL VIETNAM QUARTERLY KNOWLEDGE REPORT ©2016 Colliers International Research Page 17 PERFORMANCE Rent remained stable at USD120/sqm/lease term on average, with the average Land Use Right term was 35.7 years. Tan Thuan Export Processing Zone in District 7 achieved the highest asking rent of USD10.4/sqm/year. Famous for being the first export and processing zone in Vietnam, it has remained to be the leader among other IPs. The average occupancy rate was 69% which was stable over the quarter. Six fully occupied IPs are Linh Trung 1, Binh Chieu, Saigon Hi-tech Park 1, Tan Binh, Cat Lai and Tan Thoi Hiep. Minimum leasable area of ready-built factories is 1,000-5,000 sqm with rents offered from USD2.5- USD4/sqm/month (excluding VAT and service charge). SUPPLY The current stock comprises of 19 IPs, providing over 2,700ha of leasable areas. To minimize negative impacts on local residents, industrial properties scattered around outlying districts. Cu Chi and District 9 are the largest suppliers, accounting for 23% and 22% of market share. There are other IPs under construction such as Tay Bac Cu Chi Industrial (phase 2) in Cu Chi district, Hiep Phuoc IP (Phase 3) in Nha Be and Vinh Loc IP (Phase 3) in Binh Chanh district. DEMAND It is expected that free trade agreements will bring more investment into the country, especially from big importers of Vietnamese products. Manafacturing actitivities by foreign companies will increase on the back of tax exemption on major products such as garments and textiles. With more international manufacturers setting up production bases in Vietnam, demand is on the rise for industrial properties, including industrial parks, warehouses and logistics facilities. OUTLOOK The city is making efforts to transform its processing and industrial zones from traditional labour-intensive structure to high-tech key industries. As most of applicants come from rural areas and lack a high school diploma, the foreign sector is experiencing difficulty in finding suitable factory workers. To support the expansion of industrial properties in Vietnam, it is necessary to have additional workplace training programs to bridge skills and knowledge gap of labour force. VIETNAM QUARTERLY KNOWLEDGE REPORT ©2016 Colliers International Research Figure 17: Industrial, Market Performance Source: Colliers International Research Figure 18: Industrial, Supply by District Source: Colliers International Research Source: Colliers International Research Table 10: Industrial, Future Supply Industrial Park Name District GFA (ha) Le Minh Xuan Industrial Park - phase 3 Binh Chanh 242 Tay Bac Cu Chi Industrial Park - phase 2 Cu Chi 173 Hiep Phuoc Industrial Park - phase 2 Nha Be 597 Dist. 9 22% Cu Chi 23% Binh Chanh 16% Binh Tan 10% Dist. 7 8% Nha Be 8% Others 13% 60% 62% 64% 66% 68% 70% 115 117 119 121 123 125 Q4 2015 Q1 2016 Q2 2016 USD/sqm/term Average asking rent Occupancy rate
- 18. Q2 2016 | HO CHI MINH CITY | INDUSTRIAL VIETNAM QUARTERLY KNOWLEDGE REPORT ©2016 Colliers International Research Page 18 Table 3: Significant Office Projects Table 11: HCMC Industrial Market Overview No Name of Industrial Park Location Distance to CBD (km) Total Area (ha) Total leasable area (ha) Asking Rent (US$/sqm/ term) Occupancy LUR Term 1 Linh Trung 1 Export Processing Zone Thu Duc 18 62 46 60 100% 2042 2 Linh Trung 2 Export Processing Zone Thu Duc 17 62 44 60 99% 2050 3 Binh Chieu Industrial Park Thu Duc 16 27 27 150 100% 2046 4 Saigon Hi-tech Park P1 District 9 15 300 300 60 100% 2052 5 Tay Bac Cu Chi Industrial Park Cu Chi 36.5 208 150 90 99% 2047 6 Tan Phu Trung Industrial Park Cu Chi 37 543 359 73 28% 2054 7 Tan Thuan Export Processing Zone District 7 6.4 300 205 260 81% 2054 8 Hiep Phuoc Industrial Park 1 Nha Be 21 331 224 100 93% 2041 9 Hiep Phuoc Industrial Park 2 Nha Be 22 597 345 100 10% 2048 10 Tan Tao Industrial Park 1 Binh Tan 17 161 97 251 97% 2058 11 Tan Tao Industrial Park 2 Binh Tan 17 183 116 251 78% 2047 12 Tan Binh Industrial Park Tan Binh 11 129 100 235 100% 2050 13 Le Minh Xuan Industrial Park Binh Chanh 20 100 66 100 95% 2047 14 Vinh Loc Industrial Park Binh Chanh 15 203 131 270 95% 2047 15 Dong Nam Industrial Park Cu Chi 30 343 287 63 69% 2047 16 An Ha Industrial Park Binh Chanh 23 124 124 64 23% 2058 17 Cat Lai Industrial Park District 2 21 137 87 90 100% 2058 18 Automotive - Mechanical (Hoa Phu) Cu Chi 40 99 67 56 83% 2061 19 Tan Thoi Hiep Industrial Park District 12 16 28 20 100 100% 2057 Total 3,937 2,795 120 69%
- 19. COLLIERS INTERNATIONAL | VIETNAM HO CHI MINH CITY 18HBT Building, 4th floor 16-18 Hai Ba Trung Street, Ben Nghe Ward, District 1 HCMC, Vietnam Tel: + 84 8 3827 5665 HANOI Room A52, 5th Floor 68 Nguyen Du Street, Hai Ba Trung District, Hanoi, Vietnam Tel: +84 8 3827 5665 502 offices in 67 countries on 6 continents Accelerating success DAVID JACKSON General Director david.jackson@colliers.com +84 8 3827 5665 About Colliers International Colliers International is a leader in global real estate services, defined by our spirit of enterprise. Through a culture of service excellence and a shared sense of initiative, we integrate the resources of real estate specialists worldwide to accelerate the success of our partners. We connect through a shared set of values that shape a collaborative environment throughout our organization that is unsurpassed in the industry. With more than 100 professionals in 2 offices in Vietnam, the team is market driven and has proven and successful track record with both international and local experience. From Hanoi to Ho Chi Minh City, we provide a full range of real estate services The foundation of our services is the strength and depth of our experience. Publication Coverage Frequency Content Availability Knowledge Report/ Market Insights Vietnam Cities Quarterly All market sectors Publicly available Investment report Vietnam Quarterly Economic updates and Investment highlights Publicly available CBD Report HCMC CBD Monthly Office, Retail, Hotel and Serviced Apartment Publicly available Residential launch update HCMC Monthly Residential Publicly available Asia Pacific Office Report Asia Pacific including Vietnam Quarterly Office market Publicly available Vietnam Property Market Report Vietnam cities Quarterly All market sectors On subscription Development Recommendation Vietnam cities At request All market sectors On subscription $2.30 billion in annual revenue 158 million square meter under management 16,300 professionals and staff This document has been prepared by Colliers International for advertising and general information only. Colliers International makes no guarantees, representations or warranties of any kind, expressed or implied, regarding the information including, but not limited to, warranties of content, accuracy and reliability. Any interested party should undertake their own inquiries as to the accuracy of the information. Colliers International excludes unequivocally all inferred or implied terms, conditions and warranties arising out of this document and excludes all liability for loss and damages arising there from. This publication is the copyrighted property of Colliers International and/or its licensor(s). ©2016. All rights reserved. For further information, please contact us: VIETNAM | RESEARCH FORECAST REPORT ©2016 Colliers International Research www.colliers.com/vietnam HA VO Research Manager ha.vo@colliers.com +84 8 3827 5665