
Recommended
Recommended
More Related Content
Similar to TrialBalanceGeneralLedger.pptx
Similar to TrialBalanceGeneralLedger.pptx (20)
Recently uploaded
Recently uploaded (20)
TrialBalanceGeneralLedger.pptx
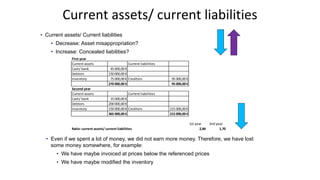
- 1. 1 1 Risk & Control Department Current assets/ current liabilities • Current assets/ Current liabilities • Decrease: Asset misappropriation? • Increase: Concealed liabilities? • Even if we spent a lot of money, we did not earn more money. Therefore, we have lost some money somewhere, for example: • We have maybe invoiced at prices below the referenced prices • We have maybe modified the inventory First year Current assets Current liabilities Cash/ bank 45 000,00 € Debtors 150 000,00 € Inventory 75 000,00 € Creditors 95 000,00 € 270 000,00 € 95 000,00 € Second year Current assets Current liabilities Cash/ bank 15 000,00 € Debtors 200 000,00 € Inventory 150 000,00 € Creditors 215 000,00 € 365 000,00 € 215 000,00 € 1st year 2nd year Ratio: current assets/ current liabilities 2,84 1,70
- 2. 2 2 Risk & Control Department Receivables turnover • Receivables turnover (comparison between debtors and profit). • (efficiency– collections) • Decrease: Fictious sales (that have not been paid) ? • In this example, there are less debtors with regards to profit. Therefore, it appears that the accounts receivable service has improved the efficiency of collections. First year Net sales 250 000,00 € Average net receivables 155 000,00 € Second year Net sales 450 000,00 € Average net receivables 210 000,00 € 1st year 2nd year Ratio : receivables turnover 1,61 2,14
- 3. 3 3 Risk & Control Department Profit margin • Profit margin • (profit per dollar of sales) • Decrease: Fictitious costs: phony vendors, inflated expenses, ghost employees ? • Increase: Fictitious sales? • There was less net sales per dollar of sales • The inventory has maybe been modified, • Fictitious consulting services have maybe been given. Première année Net income 15 000,00 € Net sales 250 000,00 € Deuxième année Net income -25 000,00 € Net sales 450 000,00 € 1st year 2nd year Net income/ net sales 0,06 -0,06
- 4. 4 4 Risk & Control Department Zero balances Negative cost balance Positive revenue balance Positive liabilities balance Negative assets balance Unexplained large variance year-on-year High value of movements/ balance for risky accounts (bad- debt) High value debit movements on revenue (cancellations)? High value credit movements expenditure (cancellations)? Year-on-year changes to ratios Benchmark ratios similar entities Trial balance – things to look for
- 5. 5 5 Risk & Control Department Balance sheet accounts We tend to analyse the balance P&L accounts We tend to analyse the movements Why? Because balance sheet accounts are have open item management, meaning that they are cleared. For example, a customer invoice is debited to the customer control account and a customer incoming payment is credited to the customer control account. What we tend to be interested in in balance sheet accounts, is where we have outstanding balances (for example outstanding debit on the customer control account), or where the account is “out of balance”, perhaps because a customer did not reimburse a credit note and then the account becomes negative rather than the expected debtor balance. Because P&L accounts do not have open item management, meaning that we usually post all expenditure on debit and all revenues on credit. What we tend to be interested in, is where we see the opposite, for example revenues on debit, because this could indicate cancellations of revenue, for example, cancellation after closing of previously entered fictitious invoices. Trial balance – quick tips
- 6. 6 6 Risk & Control Department Trial Balance checklist # Description Reason 1 Check that debit = credit Ensure that the data is coherent 2 Check that assets = liabilities + retained earnings Ensure that the data is coherent 3 Identify accounts that are new in this FY Fictitious GL accounts for hiding miss-statements 4 Check the current assets/ current liabilities ratio year- on-year (see next page) Decrease: asset miss- appropriation? Increase: Concealed liabilities? 5 Check the receivables ratio year-on-year Decrease: fictious sales? Increase: More efficient AR? 6 Check the profit margin year- on-year Decrease: fictitious costs? Increase: Fictious sales? 7 Identify accounts not used in FY-1 Fictious GL account to hide misstatement? 8 Increase in postings to suspense accounts year-on- year? Cookie-jar / fictitious cost or revenue? 9 New cost/ profit center Hiding fictitious cost/ profit?
- 7. 7 7 Risk & Control Department Journal entry checklist # Description Reason 1 High percentage manual Material misstatements 2 Manual journal entries entered by top management Miss-statements 3 High-value adjustments entered by top management at year end (filter on document type) Miss-statements 4 High value / repeated credit/ debit memos, especially after closing Fictitious sales or purchasing that is then cancelled 5 Unusual “Z” document types Unusual postings used to hide misstatements/ misuse of SAP 6 Document types for interfaces such as T&E: check volume over time High-values T&E used for gifts/ bribes 7 Document types for cash/ checks Cash/ checks used for gifts/ bribes 8 Accounts that are not mapped to Tango Hiding of misstatements on accounts that are not consolidated # Description Reason 9 Users that rarely enter JEs, but enter JEs of a high value Misstatements, usurpation user access to hide misstatement 10 Users that are not members of the accounts department (FI postings only) Fictitious journal entries entered by operational staff in order to hide fictitious customer/ supplier invoices, etc.