SlideShare a Scribd company logo
1 of 5
Download to read offline
Reconciliation of opposing views on
membrane–sugar interactions
Heidi D. Andersena
, Chunhua Wanga,b
, Lise Arlethc
, Günther H. Petersb,d
, and Peter Westha,b,1
a
Research Unit for Functional Biomaterials, Roskilde University, 1 Universitetsvej, DK-4000, Roskilde, Denmark; b
MEMPHYS—Center for Biomembrane
Physics, University of Southern Denmark, Campusvej 55, DK-5230 Odense M, Denmark; c
Faculty of Life Sciences, Biophysics, University of Copenhagen,
40 Thorvaldsensvej, DK-1871 Frederiksberg, Denmark; and d
Department of Chemistry, Technical University of Denmark, DK-2800, Kgs. Lyngby, Denmark
Edited by Harry B. Gray, California Institute of Technology, Pasadena, CA, and approved December 21, 2010 (received for review August 25, 2010)
It is well established that small sugars exert different types of sta-
bilization of biomembranes both in vivo and in vitro. However, the
essential question of whether sugars are bound to or expelled from
membrane surfaces, i.e., the sign and size of the free energy of the
interaction, remains unresolved, and this prevents a molecular
understanding of the stabilizing mechanism. We have used small-
angle neutron scattering and thermodynamic measurements to
show that sugars may be either bound or expelled depending
on the concentration of sugar. At low concentration, small sugars
bind quite strongly to a lipid bilayer, and the accumulation of
sugar at the interface makes the membrane thinner and laterally
expanded. Above ∼0.2 M the sugars gradually become expelled
from the membrane surface, and this repulsive mode of interaction
counteracts membrane thinning. The dual nature of sugar–mem-
brane interactions offers a reconciliation of conflicting views in
earlier reports on sugar-induced modulations of membrane proper-
ties.
membrane interface ∣ membrane structure ∣ preferential binding ∣
preferential exclusion ∣ interaction free energy
Small sugars such as the disaccharides sucrose and trehalose
are among the so-called osmolytes (1) or compensatory
solutes (2), which are accumulated in response to environmental
stress in virtually all taxa. Their function is to act as inert regu-
lators of the osmotic pressure, but they also optimize the physical
properties of the cytosol (3) and stabilize biomolecular conforma-
tions against cold, drought, and heat (4–7). The same small
carbohydrates have also proven useful in vitro as protectants
or excipients for biopreservation (8). Many reports have shown
that membranous structures are particularly stabilized by small
sugars (4, 6, 9), but the definition of stabilization covers a wide
range of biological and physical parameters. Thus, studies on
intact cells have documented improved survival following expo-
sure to heat, cold, drought, or chemical stressors (6, 10, 11).
Other works have analyzed stabilization on the basis of phenom-
enological properties of model membranes, for example, the
leakage or intermixing of probes in liposomes (12, 13). Finally,
stability has been discussed with respect to rigorous physical para-
meters such as the structure or mechanical properties of lipid
bilayers (14, 15). The current work addresses membrane dimen-
sions and the thermodynamics of interaction with the purpose of
elucidating fundamental aspects of membrane–sugar interrela-
tionships. The different observations of sugar stabilization have
sparked a large number of studies on sugars and model mem-
branes (usually phospholipid bilayers) over the past 30 y. Inves-
tigations of fully hydrated membranes show an interesting
tendency to fall into two groups with mutually conflicting conclu-
sions. Thus, many investigations have suggested direct (favor-
able) interaction of sugars and the phospholipid interface
(16–23), and it is obvious that such interactions could be the ori-
gin of sugar effects, for example, through interlocking of several
lipids molecules that simultaneously hydrogen bond to the same
disaccharide molecule (24). Other stabilizing consequences of
sugar binding have been put forward, and in this paper, we col-
lectively refer to this interpretation as the “interaction hypoth-
esis.” In contrast to this, other works have concluded that the
sugars are preferentially expelled from the hydration zone and
that their effect on the membrane is exerted indirectly by the local
osmotic imbalance and the concomitant increase in interfacial
free energy (25–30). We call this the “exclusion hypothesis.”
The most unambiguous support for the interaction hypothesis
is probably the lateral expansion of phospholipid monolayers,
which is observed when, e.g., sucrose or trehalose is added to the
aqueous subphase in a Langmuir–Blodgett trough (16–18, 31).
The obvious interpretation of this is that the sugar molecules
increase the area through intercalation between the lipid head
groups. Other experimental approaches have reached analogous
conclusions in work on lipid bilayers (19, 20, 24, 32), and Viera
et al. (33) found that trehalose that was bound to a bilayer during
dehydration remained associated for hours upon rehydration in
buffer without sugar. Most recently, the interaction hypothesis
has been supported by many molecular dynamics simulations
(see, e.g., refs. 21–23 and references therein), which consistently
reported membrane–sugar attraction and an associated buildup
of sugar at the membrane interface. Conversely, the exclusion
hypothesis is supported by a multitude of studies on the phase
behavior of fully hydrated phospholipids showing that the addi-
tion of sugars and other kosmotropic solutes consistently stabilize
the phase with the smallest surface area (34, 35). For example, the
gel phase is stabilized over the fluid phase (25, 27), hexagonal
phases are favored over lamellar phases (34, 36), and the lateral
expansion associated with interdigitation is strongly disfavored
(37). This ubiquitous correlation is explained by a preferential
expulsion or exclusion that increases the interfacial free energy
and thus promotes the stability of lipid phases with low water ac-
cessible areas. The exclusion hypothesis has been supported by
some spectroscopic evidence (28), and recently both small-angle
scattering studies (36, 38) and vapor pressure measurements (39)
have provided direct evidence for a partial depletion of sugar in
the hydration zone of lipid bilayers. Several aspects of the exclu-
sion hypothesis were recently discussed by Lenné et al. (40) who
concluded that “sugars partition away from the phospholipid
headgroups, rather than inserting between the headgroups.”
To address the obvious contrast between the interaction and
exclusion hypotheses, we have used small-angle neutron scatter-
ing (SANS) and thermodynamic measurements and found that
the interaction of membranes and small sugars indeed includes
both an attractive and a repulsive component. The former leads
to a buildup of sugar at the interface (in accord with the inter-
action hypothesis) at low sugar concentration, whereas the latter
Author contributions: H.D.A. and P.W. designed research; H.D.A., C.W., L.A., and P.W.
performed research; H.D.A., C.W., L.A., and P.W. contributed new reagents/analytic tools;
H.D.A., C.W., L.A., G.H.P., and P.W. analyzed data; and L.A. and P.W. wrote the paper.
The authors declare no conflict of interest.
This article is a PNAS Direct Submission.
1
To whom correspondence should be addressed. E-mail: pwesth@ruc.dk.
This article contains supporting information online at www.pnas.org/lookup/suppl/
doi:10.1073/pnas.1012516108/-/DCSupplemental.
1874–1878 ∣ PNAS ∣ February 1, 2011 ∣ vol. 108 ∣ no. 5 www.pnas.org/cgi/doi/10.1073/pnas.1012516108
brings about an expulsion of sugar (as described in the exclusion
hypothesis) in more concentrated samples. This unique mode of
interaction is shown to make the membrane thinner and laterally
expanded even if the interfacial free energy is increased. We
suggest that this is the origin of earlier disagreement on sugar–
membrane interactions in excess water and that this unusual
interaction pattern should be considered in analyses of sugar-
induced stabilization of fully hydrated membranes (whereas
the issue of sugar effects on dry membranes is beyond the current
scope).
Results
Data from SANS measurements were fitted with a molecular con-
strained analytical model for polydisperse bilayer liposomes. We
used a three-shell model for the bilayer cross-section and mod-
eled the bilayer in terms of a central hydrophobic core, containing
the hydrocarbon chains, sandwiched between inner and outer
hydrophilic layers, composed by the hydrophilic head groups
and hydration water. This approach, including its use of molecu-
lar constraints, was pioneered by Luzatti and Husson (41), later
refined (42, 43), and recently further modified and extensively
applied to lipid bilayers by Kucerka et al. (44, 45). Our approach
is similar in spirit to Kucerka’s approach (see SI Text). However,
as the single SANS bulk contrast does not contain sufficient
information to use the detailed structural model of Kucerka et
al., we have, for simplicity, used a step-function-based scattering
length density profile instead of Gaussian-based function. The
free parameters of the model are R, the average radius of the
liposomes, σR∕R, the relative standard deviation of the Gaussian
describing the size distribution, Nhyd, the number of hydration
water molecules per hydrophilic head group of the phospholipids,
and Dbilayer, the total bilayer thickness. In addition to these model
parameters, we also fitted an overall scaling factor, accounting for
the product of the experimental uncertainties in the absolute
scale calibration and sample concentration, respectively, and a
small constant background. A more detailed description of the
model is available in SI Text.
The central SANS parameter for the current analysis is the
thickness, Dbilayer, which is plotted as a function of the sugar con-
centration in Fig. 1. It appears that the sugars consistently make
the membranes thinner. The largest changes exceed 3 Å or about
8% of the total thickness, and the effect is quite similar for the
two investigated lipids, DMPC (1,2-dimyristoyl-sn-glycero-3-
phosphocholine) and DOPC (1,2-dioleoyl-sn-glycero-3-phospho-
choline). Interestingly, the monosaccharide (glucose) induces
only about half the thinning of the disaccharides (trehalose
and sucrose) at the same weight fraction.
The effect of sugar on the lipid volume was measured by
densitometry. The specific volume, Vspec, of tertiary (waterþ
sugar þ lipid) samples were calculated from the resonant
frequencies measured in the densitometer, and the apparent
specific volume (46) of the lipid, Vlip, was determined (47) as
Vlip ¼
½Vspec−ð1−wlipÞVsolventŠ
wlip
, where wlip is the weight fraction of lipid
in the tertiary samples and Vsolvent is the specific volume of the
binary aqueous solvent (water þ sugar, with exactly the same
composition as the aqueous part of the tertiary sample). Values
of Vlip are plotted as a function of the sugar concentration
in Fig. 2.
The net affinity of sugars for the membranes (i.e., the free
energy of membrane–sugar interaction) was calculated from
the dialysis measurements and expressed by the so-called prefer-
ential binding parameter, Γ3, as described in SI Text and Table S1.
This parameter quantifies the binding (or expulsion) in mol sugar
per mol lipid, and it may be positive or negative. Positive values of
Γ3 imply favorable interactions of sugar and membrane, and thus
an accumulation of sugar at the membrane interface. Conversely,
negative values of Γ3 occur when water–membrane interactions
are stronger than sugar–membrane interactions and it entails a
partial (or “preferential”) exclusion of the solute from the inter-
facial zone. The results in Fig. 3 show that both of these cases
occur for the membrane–sugar systems investigated here. Thus,
Γ3 is positive in dilute sugar solutions but runs through a maxi-
mum and becomes negative at higher concentrations. We note
that the abscissa in Fig. 3 is the free sugar concentration (mea-
sured outside the dialysis bag), whereas the abscissas in Figs. 1
and 2 are total (bound þ free) concentrations. However, calcula-
tion of the bound fraction in Figs. 1 and 2 shows that this is small
compared to the experimental errors, and it follows that the
results in Figs. 1–3 may be compared directly and that the
reported concentrations can be converted to osmolalities using
activity coefficients for the binary aqueous sugar solutions.
Discussion
The understanding of sugar-induced stabilization of membranes
will depend on the molecular description of sugar–membrane
interactions. As illustrated in the Introduction, current views
on this are divided on the question of whether sugars exert their
effect through direct (attractive) interaction or indirect modula-
tions, driven by preferential exclusion (Γ3 < 0). The preferential
binding data in Fig. 3 emphasize the importance of sugar concen-
tration in these discussions. Thus, at low concentrations, the
sugars accumulate at the membrane interface (Γ3 > 0) in accord
A B
Fig. 1. Overview of the SANS results. (A) Examples of SANS data (points) and
model fits (full lines). Black: DMPC in D2O. Fit parameters: R ¼ 427 Å,
σR∕R ¼ 28%, Nhyd ¼ 1, Dbilayer ¼ 39.1Å. Red: DMPC in D2O with 20% treha-
lose. Fit parameters: R ¼ 295 Å, σR∕R ¼ 26%, Nhyd ¼ 1, Dbilayer ¼ 35.7 Å. Both
samples are measured at 40 °C. The sugar-induced thinning is directly visible
in the data around q ¼ 0.1 Å−1
, where it makes the thinner bilayer (red) fall
off toward zero at slightly higher q values. (B) The total bilayer thickness,
Dbilayer, for, respectively, DOPC and DMPC as a function of the weight fraction
of sugar.
Fig. 2. Apparent volume of DMPC at 40 °C as obtained from the densitome-
try measurements and plotted against the weight fraction of sugar. Volumes
are given in both cm3∕g (left-hand ordinate) and Å3
∕molecule (right-hand
ordinate).
Andersen et al. PNAS ∣ February 1, 2011 ∣ vol. 108 ∣ no. 5 ∣ 1875
BIOPHYSICSAND
COMPUTATIONALBIOLOGY
CHEMISTRY
with the binding hypothesis. This effect reaches a maximum at
about 3% (wt∕wt) for glucose and about twice this concentration
for the disaccharides (that is about 0.2 M in all cases). For the
disaccharides the amount of bound sugar at the maximum is
0.07 mol∕mol lipid; i.e., there is 1 sugar for each 14 lipids in
the membrane. At higher sugar concentrations, Γ3 decreases lin-
early to negative values thus signifying preferential exclusion of
sugar from the membrane interface in accord with earlier reports
(38, 39). These data are compiled and compared with the current
results in Table S2. We interpret this nonmonotonic course of Γ3
as the result of two independent modes of interaction. One mode
contributes positively to Γ3 (binding), whereas the other mode
contributes negatively (exclusion). The positive values of Γ3 at
low sugar show that the binding mode dominates under these
conditions, and this is likely to reflect sugar–head group hydrogen
bonding, as identified in several computational studies (see, e.g.,
refs. 21–23). Recently, computational analysis of systems at low
water contents (48) has suggested that this binding couples to an
enlarged lateral area as also seen in this work. At higher sugar
concentration, the binding mode appears to saturate and to be
exceeded by the exclusion mode, which drives Γ3 to negative va-
lues. This is in accord with the general kosmotropic nature of
small sugars, which tend to exclude them from aqueous interfaces
(49) and thereby affecting lipid phase behavior (25, 27, 29, 34, 37,
50). It is important to note that the two suggested modes overlap
and that the (thermodynamic) function Γ3 will quantify the sum
of these contributions (and possibly other, as of yet unidentified
effects). In a 5% trehalose solution, for example, where the bind-
ing mode is most pronounced, there will also be a numerically
smaller negative contribution to Γ3 from the exclusion mode.
This overlapping also pertains to higher sugar concentrations
where the negative Γ3-values will be composed of a positive con-
tribution from the bound sugars, which is exceeded by the exclu-
sion, so that the average composition of the aqueous solvent in
the hydration zone is poorer in sugar than the bulk.
Addition of sugars made the membranes thinner by as much as
8–9% for the highest concentrations (Fig. 1). The thinning pro-
duced by the disaccharides was similar both for DMPC and
DOPC, whereas the monosaccharide, glucose, generated a much
smaller reduction in Dbilayer for both lipids. In spite of the decreas-
ing thickness, the molecular volume of DMPC exhibited a weak
increase with increasing sugar concentration up to 20% sugar
(Fig. 2). A detailed analysis of the resulting lateral expansion
awaits comprehensive scattering studies of the sugar content
in the membrane interface, but if the area per phospholipid is
simply estimated as the ratio of the volume and thickness
(A ¼ Vlip∕Dbilayer), we find a maximal increase in phospholipid
lateral area of 5–6 Å2
or 9% for the disaccharides (see Fig. S1).
This number is estimated from the apparent volume of the lipid
molecules and hydration water only. If the partitioning of sugar
into the hydrophilic part of the membrane phase is included
in the calculations, even higher degrees of expansion will be
obtained. A more quantitative thermodynamic analysis of this
can be carried out by means of the lateral equation of state that
separates the intrabilayer free energy into three terms describing,
respectively, the interfacial free energy, the head-group repul-
sion, and the repulsion resulting from hydrocarbon chain entropy
(51).
It is interesting to compare the changes in membrane dimen-
sions with the binding data in Fig. 3. Thus, at low sugar concen-
tration (<5%), it is intuitive to conclude that the binding of sugar
involves some degree of intercalation, which separates the lipid
head groups and thus increases the lateral area. This, in turn,
allows increased disordering of the lipid chains (more gauche
conformers) and hence a thinning of the membrane, which is
more pronounced for the disaccharides than for the smaller glu-
cose (Fig. 1). This general behavior is typical for the interfacial
binding of small molecules to membranes (52, 53), and we con-
clude that the structural and thermodynamic results at low sugar
concentration are mutually supportive. At higher sugar concen-
trations we see a different and unorthodox picture. Thus, the ne-
gative values of Γ3 and the associated increased interfacial free
energy would be expected to compress the membrane laterally.
Nevertheless, DMPC membranes in, e.g., 15% trehalose are
thinner and laterally expanded compared to membranes in pure
water. We suggest that this can be explained by the two modes of
interaction discussed above. Thus, at 15%, the sugar molecules
already bound at lower sugar concentrations are still in the mem-
brane and these bound sugars still dominate the changes in mem-
brane dimensions. At still higher sugar concentration, we find a
compression of the lipids (negative slope of Vlip in Fig. 2), which
suggests that the increased interfacial free energy associated with
the exclusion eventually offsets the structural changes of the
bound sugars. This conclusion is also in line with the occurrence
of minima in the thickness data in Fig. 1 as the lateral expansion
of the bound sugars is gradually counteracted by increasing inter-
facial free energy (unfortunately SANS measurements could not
be extended above 20% sugar with the current methods).
Sugar–membrane interactions have been extensively discussed
on the basis of lipid phase transition data, and many reports have
concluded that addition of sugar favors the phase with the smal-
lest interfacial area because of a preferential exclusion, which is
common to all kosmotropes. We note that while Γ3 for the fluid
membrane [Γ3ðfluidÞ] may be a useful parameter, changes in,
e.g., the main (gel-to-fluid) transition temperature, Tm, is not
governed by Γ3ðfluidÞ itself, but by the difference, ΔΓ3 ¼
Γ3ðfluidÞ − Γ3ðgelÞ. If, for example, ΔΓ3 is negative, the solute
interacts more favorably with the gel phase and consequently
stabilizes this phase (i.e., raises the temperature where it melts).
Conversely, solutes with ΔΓ3 > 0 will lower Tm. The behavior of
Γ3ðfluidÞ and Γ3ðgelÞ for the sucrose-DMPC system is illustrated
in Fig. 3, Inset. Obviously, it is not possible to study the two
different phases under the exact same conditions, so the experi-
mental temperature was 18 °C and 30 °C, respectively, for studies
of gel- and fluid-phase DMPC. It appears that the two curves are
qualitatively similar with a maximum at the same location and
hence that the two modes of interaction pertain to both phases.
The binding to the gel phase is somewhat weaker, but the differ-
ence is not large. The most conspicuous difference is the negative
slope after the maximum, which is larger by a factor of three for
the fluid phase compared to the gel phase (Fig. 3, Inset). This
difference in slopes gives rise to substantial negative values of
Fig. 3. Net affinity of sugars for unilamellar DMPC membranes expressed as
the preferential binding parameter, Γ3, and plotted as a function of the
weight fraction of sugar. The experimental temperature was 30 °C for data
in the main panel. (Inset) Data for sucrose at 30 °C (closed symbols) where
DMPC is in the fluid phase and 18 °C (open symbols) where DMPC is in
the gel phase. Error bars are ÆSEM. In Table S2, results from this figure
are expressed as partitioning coefficients and compared with literature data.
1876 ∣ www.pnas.org/cgi/doi/10.1073/pnas.1012516108 Andersen et al.
ΔΓ3 in accord with the increased Tm reported at high sucrose (25,
50). Sucrose binding in dilute solutions is quite similar for fluid-
and gel-phase DMPC (ΔΓ3 is small), and hence this binding is of
minor importance for the phase equilibrium. The important para-
meter for sugar effects on Tm is the unfavorable interaction of
fluid membranes and sucrose at moderate and high concentra-
tion. This interpretation is in line with the exclusion theory
(34, 54), and we conclude that although this approach neglects
the binding mode, exclusion theories may provide reasonable
results on phase behavior because the binding mode has little
effect on ΔΓ3. This limited effect of the binding mode on phase
behavior is in strong contrast to the structural changes that couple
to the binding.
The main conclusions of this work are reiterated in the cartoon
in Fig. 4. The data show that membrane–sugar interactions may
be described by the overlapping action of an attractive and a
repulsive component. The former is likely to reflect hydrogen
bonding and to saturate at intermediate sugar concentrations.
The latter is driven by the kosmotropic or “water-structure-
making” effect (55), which causes a general depletion of sugars
from aqueous interfaces (34, 54). The kosmotropic contribution
dominates except at low sugar concentrations, where the attrac-
tive contribution is stronger. The binding triggers significant
changes in the dimensions of the bilayer (Fig. 1), which are in-
creasingly counteracted by the exclusion, and reverted at very
high sugar concentration (Fig. 2). It appears that this dual mode
of interaction may be the cause of some controversy in earlier
studies on sugar–membrane interactions, which is discussed in
the Introduction. Thus, experimental approaches that are sensi-
tive to the membrane dimensions (e.g., monolayer methods) will
primarily detect the consequences of the binding mode, whereas
macroscopic approaches (e.g., phase behavior and thermody-
namics of interaction) will detect exclusion except at quite low
sugar concentration, where the effects are difficult to measure.
This interpretation provides a reconciliation of the binding
and exclusion theories discussed in the Introduction. It is also
inclusive to other observations on sugar–membrane interactions
such as increased order parameters of the acyl chains at very high
(67%) trehalose (56) where the compression exerted by the
exclusion mode exceeds the binding-induced expansion. It
appears to be of interest to study if this unique mode of interac-
tion is important for the different types of membrane stabilization
provided by small carbohydrates.
Methods and Materials
Chemicals. All lipids (99%) were purchased as powders (Avanti
Polar Lipids) and used as supplied. Glucose [>99.5% D-(+)-
glucose] and sucrose (>99.5% α-D-Glucopyranosyl β-D-fructo-
furanoside) was from Sigma-Aldrich, and trehalose (>99%
α-D-glucopyranosyl α-D-glucopyranoside) was from AppliChem.
Normal water was freshly made in a MilliQ equipment (Milli-
pore) and D2O (99.9 atom % D) was from Sigma-Aldrich.
Small-Angle Neutron Scattering. Dry DMPC or DOPC was
hydrated on the day of use by solutions of sugars in D2O. The
lipid concentration was 6.2 mg∕mL. The lipid suspension was
extruded to unilamellar liposomes through two stacked polycar-
bonate filters with 100-nm pore size in a Lipex extrusion device
(Northern Lipids). SANS experiments were performed at the
SANS-II instrument at the Swiss Spallation Neutron Source
(SINQ) at the Paul Scherrer Institute. Using three different com-
binations of neutron wavelengths and sample-to-detector dis-
tances, a q range from 0.005 to 0.3 Å−1
was covered. The SANS
data were azimuthally averaged and background subtracted by
the standard software used at the facility and normalized to
absolute units of differential scattering cross-section per unit
volume (cm2∕cm3) by division by the scattering spectrum of
H2O (57). The wavelength spread Δλ∕λ was 10.5% FWHM. The
resolution effects arising from wavelength spread and finite col-
limation were taken into account in the data analysis by convolu-
tion of the model with the appropriate resolution function at each
setting (58). This is done automatically in the programs used for
the data analysis. All samples were measured in 5 mm Hellma
Quartz cells and at a temperature of 40 °C.
Dialysis Measurements. Stock suspensions of 2–4% (wt∕wt) DMPC
in MilliQ water were extruded to unilamellar liposomes. About
500 μL of the extruded solution was transferred to dialysis bags
(Spectrum Laboratories Inc., molecular weight cutoff ¼ 12–
14 kDa), and placed in a closed beaker with 250 mL of sugar
solution of the desired concentration. The beaker was placed
on a shaking table in a thermostatted box (air bath) and slowly
temperature cycled between 20 and 30 °C for 12 h. Slow passage
through the main transition (at about 24 °C for DMPC) is asso-
ciated with a massive transient leakage that provides transbilayer
equilibration of small polar molecules (59). After the T cycling,
the samples were held at 30 °C (Æ0.2 °C) for an additional 12 h. It
is implicit for the subsequent data analysis that this treatment
equilibrates the sugar across the membrane, and hence that
the local sugar concentration in the hydration zone is the same
for the two membrane leaflets. Samples from inside and outside
the dialysis bag were retrieved and diluted 1∶50 (or 1∶100 for
the highest sugar concentrations) in 50% 1-propanol, so that the
liposomes dissolved and released their contents. The amounts of
sugar and lipid were measured in a Varian 9012 HPLC equipped
with a Sedex 85 evaporative light scattering detector and con-
verted into molal concentration units as described in SI Text.
Samples from the dialysis experiments were analyzed in five se-
parate HPLC runs, and the standard error of mean of repeated
measurements was less than 0.5%.
Densitometry. Vacuum dried DMPC aliquots were hydrated with
2 mL of either pure water or previously prepared sugar solution
(5–30% wt∕wt). All steps were quantified gravimetrically to with-
in 0.01 mg. The samples were temperature cycled, shaken, and
intermittently treated with light ultrasound prior to the densito-
metry. The density of both tertiary (water–sugar–lipid) and binary
(water–sugar) samples was measured in a DMA 601 vibrating
tube densitometer (Anton Parr) at 40 Æ 0.01 °C. Prior to the mea-
surements, the samples were degassed by stirring under vacuum
Fig. 4. Simplified illustration of the hypothesis for sugar–membrane interactions. Intercalation of the bound sugar molecules at low sugar concentration
(5–10%) makes the membrane thinner and laterally expanded. Under these conditions, the sugar:water molar ratio is increased in the vicinity of the membrane
as indicated by the small graph (Middle). At about 20% sugar the concentration gradient near the interface has changed sign (Γ3 < 0), as indicated in the small
graph (Right), but the membrane is still laterally expanded by the bound sugar.
Andersen et al. PNAS ∣ February 1, 2011 ∣ vol. 108 ∣ no. 5 ∣ 1877
BIOPHYSICSAND
COMPUTATIONALBIOLOGY
CHEMISTRY
for ∼45 s. This removal of microbubbles proved to be necessary
for a satisfactory precision, and the associated loss of water
through evaporation (∼1 mg) was quantified gravimetrically and
corrected for in the data analysis. The instrument was regularly
calibrated against pure water and air. The experimental repeat-
ability was 3 × 10⁻⁶ cm3∕g.
ACKNOWLEDGMENTS. Beamtime at the SANS-II instrument at the SINQ facility
at the Paul Scherrer Institute in Switzerland is gratefully acknowledged along
with experimental support from Dr. Sandor Balog. This work was supported
by the Lundbeck Foundation, the Danish Agency for Science, Technology and
Innovation (Grant 272-06-0505), and the Danish National Research Founda-
tion through the establishment of the MEMPHYS Center of Excellence.
Economical support from the Danscatt user program is also gratefully
acknowledged.
1. Somero GN (1994) Adapting to water stress: Convergence on common solutions.
Water and Life, eds GN Somero, CB Osmond, and CL Bolis (Springer, Berlin).
2. Gilles R (1997) “Compensatory” organic osmolytes in high osmolarity and dehydration
stresses: History and perspectives. Comp Biochem Phys A 117:279–290.
3. Yancey PH, Clark ME, Hand SC, Bowlus RD, Somero GN (1982) Living with water-stress
—Evolution of osmolyte systems. Science 217:1214–1222.
4. Crowe JH (2007) Trehalose as a “chemical chaperone”: Fact and fantasy. Molecular
Aspects of the Stress Response: Chaperones, Membranes and Networks, eds P Csermely
and L Vígh (Springer, New York), pp 143–158.
5. Crowe LM, Reid DS, Crowe JH (1996) Is trehalose special for preserving dry biomater-
ials? Biophys J 71:2087–2093.
6. Singer MA, Lindquist S (1998) Thermotolerance in Saccharomyces cerevisiae: The Yin
and Yang of trehalose. Trends Biotechnol 16:460–468.
7. Zachariassen KE (1985) Physiology of cold tolerance in insects. Physiol Rev 65:799–832.
8. Lee JC (2000) Biopharmaceutical formulation. Curr Opin Biotechnol 11:81–84.
9. Crowe JH, et al. (2001) The trehalose myth revisited: Introduction to a symposium on
stabilization of cells in the dry state. Cryobiology 43:89–105.
10. Joo WH, et al. (2000) Intracellular changes of trehalose content in toluene tolerant
Pseudomonas sp BCNU 171 after exposure to toluene. Biotechnol Lett 22:1021–1024.
11. Zavaglia AG, Tymczyszyn E, De Antoni G, Disalvo EA (2003) Action of trehalose on the
preservation of Lactobacillus delbrueckii ssp. bulgaricus by heat and osmotic dehydra-
tion. J Appl Microbiol 95:1315–1320.
12. Fabrie C, Dekruijff B, Degier J (1990) Protection by sugars against phase transition-
induced leak in hydrated dimyristoylphosphatidylcholine liposomes. Biochim Biophys
Acta 1024:380–384.
13. Rudolph AS, Crowe JH (1985) Membrane stabilization during freezing—The role of 2
natural cryoprotectants, trehalose and proline. Cryobiology 22:367–377.
14. Deme B, Dubois M, Zemb T (2002) Swelling of a lecithin lamellar phase induced by
small carbohydrate solutes. Biophys J 82:215–225.
15. Genova J, Zheliaskova A, Mitov MD (2007) Monosaccharides (fructose, glucose)
and disaccharides (sucrose, trehalose) influence the elasticity of SOPC membranes.
J Optoelectron Adv M 9:427–430.
16. Crowe JH, Whittam MA, Chapman D, Crowe LM (1984) Interactions of phospholipid
monolayers with carbohydrates. Biochim Biophys Acta 769:151–159.
17. Lairion F, Disalvo EA (2007) Effect of trehalose on the contributions to the dipole
potential of lipid monolayers. Chem Phys Lipids 150:117–124.
18. Lambruschini C, Relini N, Ridi A, Cordone L, Gliozzi A (2000) Trehalose interacts with
phospholipid polar heads in Langmuir monolayers. Langmuir 16:5467–5470.
19. Luzardo MD, et al. (2000) Effect of trehalose and sucrose on the hydration and dipole
potential of lipid bilayers. Biophys J 78:2452–2458.
20. Strauss G, Schurtenberger P, Hauser H (1986) The interaction of saccharides with lipid
bilayer vesicles—Stabilization during freeze-thawing and freeze-drying. Biochim
Biophys Acta 858:169–180.
21. Leekumjorn S, Sum AK (2006) Molecular investigation of the interactions of trehalose
with lipid bilayers of DPPC, DPPE and their mixture. Mol Simul 32:219–230.
22. Skibinsky A, Venable RM, Pastor RW (2005) A molecular dynamics study of the
response of lipid bilayers and monolayers to trehalose. Biophys J 89:4111–4121.
23. Villarreal MA, Diaz SB, Disalvo EA, Montich GG (2004) Molecular dynamics simulation
study of the interaction of trehalose with lipid membranes. Langmuir 20:7844–7851.
24. van den Bogaart G, Hermans N, Krasnikov V, de Vries AH, Poolman B (2007) On the
decrease in lateral mobility of phospholipids by sugars. Biophys J 92:1598–1605.
25. Cevc G (1988) Effect of lipid headgroups and (nonelectrolyte) solution on the struc-
tural and phase properties of bilayer-membranes. Ber Bunsen Phys Chem 92:953–961.
26. Deme B, Zemb T (2000) Measurement of sugar depletion from uncharged lamellar
phases by SANS contrast variation. J Appl Crystallogr 33:569–573.
27. Rudolph AS, Goins B (1991) The effect of hydration stress solutes on the
phase-behavior of hydrated dipalmitoylphosphatidylcholine. Biochim Biophys Acta
1066:90–94.
28. Soderlund T, Alakoskela JMI, Pakkanen AL, Kinnunen PKJ (2003) Comparison of the
effects of surface tension and osmotic pressure on the interfacial hydration of a fluid
phospholipid bilayer. Biophys J 85:2333–2341.
29. Stumpel J, Vaz WLC, Hallmann D (1985) An x-ray-diffraction and differential scanning
calorimetric study on the effect of sucrose on the properties of phosphatidylcholine
bilayers. Biochim Biophys Acta 821:165–168.
30. Takahashi H, Matsuo A, Hatta I (2002) Effects of salt on the lamellar and bicontinuous
cubic phases of fully hydrated monoacylglycerol (monoelaidin). Phys Chem Chem Phys
4:2365–2370.
31. Johnston DS, Coppard E, Parera GV, Chapman D (1984) Langmuir film balance study of
the interactions between carbohydrates and phospholipid monolayers. Biochemistry
23:6912–6919.
32. Diaz S, Amalfa F, de Lopez ACB, Disalvo EA (1999) Effect of water polarized at the
carbonyl groups of phosphatidylcholines on the dipole potential of lipid bilayers.
Langmuir 15:5179–5182.
33. Viera LI, Alonsoromanowski S, Borovyagin V, Feliz MR, Disalvo EA (1993) Properties of
gel phase lipid-trehalose bilayers upon rehydration. Biochim Biophys Acta
1145:157–167.
34. Koynova R, Brankov J, Tenchov B (1997) Modulation of lipid phase behavior by
kosmotropic and chaotropic solutes—Experiment and thermodynamic theory.
Eur Biophys J Biophy 25:261–274.
35. Sanderson PW, Lis LJ, Quinn PJ, Williams WP (1991) The Hofmeister effect in relation to
membrane lipid phase-stability. Biochim Biophys Acta 1067:43–50.
36. Kent B, et al. (2010) Measurement of glucose exclusion from the fully hydrated DOPE
inverse hexagonal phase. Soft Matter 6:1197–1202.
37. Takahashi H, Ohmae H, Hatta I (1997) Trehalose-induced destabilization of interdigi-
tated gel phase in dihexadecylphosphatidylcholine. Biophys J 73:3030–3038.
38. Lenne T, Bryant G, Garvey CJ, Kelderling U, Koster KL (2006) Location of sugars in
multilamellar membranes at low hydration. Physica B 385–386:862–864.
39. Westh P (2008) Glucose, sucrose and trehalose are partially excluded from the
interface of hydrated DMPC bilayers. Phys Chem Chem Phys 10:4110–4112.
40. Lenné T, Garvey CJ, Koster KL, Bryant G (2009) Effects of sugars on lipid bilayers during
dehydration—SAXS/WAXS measurements and quantitative model. J Phys Chem B
113:2486–2491.
41. Luzzati V, Husson F (1962) Structure of liquid-crystalline phases of lipid-water systems.
J Cell Biol 12:207–219.
42. Hayter JB, Zemb T (1982) Concentration-dependent structure of sodium octanoate
micelles. Chem Phys Lett 93:91–94.
43. Hayter JB, Penfold J (1981) An analytic structure factor for macroion solutions.
Mol Phys 42:109–118.
44. Kucerka N, et al. (2008) Lipid bilayer structure determined by the simultaneous ana-
lysis of neutron and x-ray scattering data. Biophys J 95:2356–2367.
45. Uhrikova D, Kucerka N, Teixeira J, Gordeliy V, Balgavy P (2008) Structural changes in
dipalmitoylphosphatidylcholine bilayer promoted by Ca2þ ions: A small-angle neu-
tron scattering study. Chem Phys Lipids 155:80–89.
46. McGlashan ML (1979) Chemical Thermodynamics (Academic, London).
47. Peters GH, Hansen FY, Moller MS, Westh P (2009) Effects of fatty acid inclusion in a
DMPC bilayer membrane. J Phys Chem B 113:92–102.
48. Golovina EA, Golovin A, Hoekstra FA, Faller R (2010) Water replacement hypothesis in
atomic details: Effect of trehalose on the structure of single dehydrated POPC bilayers.
Langmuir 26:11118–11126.
49. Pegram LM, Record MT (2009) Using surface tension data to predict differences
in surface and bulk concentrations of nonelectrolytes in water. J Phys Chem C
113:2171–2174.
50. Crowe LM, Crowe JH (1991) Solution effects on the thermotropic phase-transition of
unilamellar liposomes. Biochim Biophys Acta 1064:267–274.
51. Leontidis E, Aroti A, Belloni L, Dubois M, Zemb T (2007) Effects of monovalent anions
of the Hofmeister series on DPPC lipid Bilayers part II: Modeling the perpendicular and
lateral equation-of-state. Biophys J 93:1591–1607.
52. Coster HGL, Laver DR (1986) The effect of benzyl alcohol and cholesterol on the acyl
chain order and alkane solubility of bimolecular phosphatidylcholine membranes.
Biochim Biophys Acta 861:406–412.
53. Pedersen UR, Peters GH, Westh P (2007) Molecular packing in 1-hexanol-DMPC bilayers
studied by molecular dynamics simulation. Biophys Chem 125:104–111.
54. Takahashi H, Matsuo A, Hatta I (2000) Effects of chaotropic and kosmotropic solutes on
the structure of lipid cubic phase: Monoolein-water systems. Mol Cryst Liq Cryst
347:475–482.
55. Collins KD, Washabaugh MW (1985) The Hofmeister effect and the behavior of water
at interfaces. Q Rev Biophys 18:323–422.
56. Bechinger B, Macdonald PM, Seelig J (1988) Deuterium NMR-studies of the interac-
tions of polyhydroxyl compounds and of glycolipids with lipid model membranes.
Biochim Biophys Acta 943:381–385.
57. Lindner P (2002) Scattering experiments: Experimental aspects, initial data reduction
and absolute calibration. Neutrons, X-Rays and Light: Scattering Methods Applied to
Soft Condensed Matter, eds P Linder and Th Zemb (Elsevier, Amsterdam).
58. Pedersen JS, Posselt D, Mortensen K (1990) Analytical treatment of the resolution
function for small-angle scattering. J Appl Crystallogr 23:321–333.
59. Hays LM, Crowe JH, Wolkers W, Rudenko S (2001) Factors affecting leakage of trapped
solutes from phospholipid vesicles during thermotropic phase transitions. Cryobiology
42:88–102.
1878 ∣ www.pnas.org/cgi/doi/10.1073/pnas.1012516108 Andersen et al.

More Related Content

Similar to PNAS-2011

Polymeric composite membranes for temperature and pH-responsive delivery of d...
Polymeric composite membranes for temperature and pH-responsive delivery of d...Polymeric composite membranes for temperature and pH-responsive delivery of d...
Polymeric composite membranes for temperature and pH-responsive delivery of d...Nanomedicine Journal (NMJ)
 
我coauther第一篇paper
我coauther第一篇paper我coauther第一篇paper
我coauther第一篇paperYiming Chai
 
Study of the effects of electrochemical aqueous sodium
Study of the effects of electrochemical aqueous sodiumStudy of the effects of electrochemical aqueous sodium
Study of the effects of electrochemical aqueous sodiumAlexander Decker
 
An overview on_biofiltration_modeling
An overview on_biofiltration_modelingAn overview on_biofiltration_modeling
An overview on_biofiltration_modelingAvi Kumar
 
Gawrisch Insights From Biophysical Studies On The Role Of Pufa For Function O...
Gawrisch Insights From Biophysical Studies On The Role Of Pufa For Function O...Gawrisch Insights From Biophysical Studies On The Role Of Pufa For Function O...
Gawrisch Insights From Biophysical Studies On The Role Of Pufa For Function O...lab13unisa
 
Comparison of homeopathic globules prepared from high andultra-high dilutions...
Comparison of homeopathic globules prepared from high andultra-high dilutions...Comparison of homeopathic globules prepared from high andultra-high dilutions...
Comparison of homeopathic globules prepared from high andultra-high dilutions...home
 
A quantum-like model of homeopathy clinical trials: importance of in situ ran...
A quantum-like model of homeopathy clinical trials: importance of in situ ran...A quantum-like model of homeopathy clinical trials: importance of in situ ran...
A quantum-like model of homeopathy clinical trials: importance of in situ ran...home
 
2011 NSF CAREER_Steve Koch Full Project Description
2011 NSF CAREER_Steve Koch Full Project Description 2011 NSF CAREER_Steve Koch Full Project Description
2011 NSF CAREER_Steve Koch Full Project Description Steve Koch
 
Goldschmidt Conference Abstract 2010
Goldschmidt Conference Abstract 2010Goldschmidt Conference Abstract 2010
Goldschmidt Conference Abstract 2010Christine A. Waters
 
Solubility and dissolution enhancement strategies-Current understanding and r...
Solubility and dissolution enhancement strategies-Current understanding and r...Solubility and dissolution enhancement strategies-Current understanding and r...
Solubility and dissolution enhancement strategies-Current understanding and r...ajaykumarpa
 
Spreading of liquid drops over solid substrates like wets like- Eng.Bashar Sasa
Spreading of liquid drops over solid substrates like wets like- Eng.Bashar SasaSpreading of liquid drops over solid substrates like wets like- Eng.Bashar Sasa
Spreading of liquid drops over solid substrates like wets like- Eng.Bashar SasaBashar Sasa
 
Reaction of Succinic Acid with Superoxide Dismutase
Reaction of Succinic Acid with Superoxide DismutaseReaction of Succinic Acid with Superoxide Dismutase
Reaction of Succinic Acid with Superoxide DismutaseRichard Boakye-Marfo
 
Biomedical science adina georgiana dorobantu
Biomedical science adina georgiana dorobantuBiomedical science adina georgiana dorobantu
Biomedical science adina georgiana dorobantuAdina Georgiana
 
Intermolecular Interactions of Edaravone in Aqueous Solutions of Ethaline and...
Intermolecular Interactions of Edaravone in Aqueous Solutions of Ethaline and...Intermolecular Interactions of Edaravone in Aqueous Solutions of Ethaline and...
Intermolecular Interactions of Edaravone in Aqueous Solutions of Ethaline and...Maciej Przybyłek
 
Toh et al. 2014
Toh et al. 2014 Toh et al. 2014
Toh et al. 2014 Fran Flores
 

Similar to PNAS-2011 (20)

978 1-4899-1176-6 1
978 1-4899-1176-6 1978 1-4899-1176-6 1
978 1-4899-1176-6 1
 
Polymeric composite membranes for temperature and pH-responsive delivery of d...
Polymeric composite membranes for temperature and pH-responsive delivery of d...Polymeric composite membranes for temperature and pH-responsive delivery of d...
Polymeric composite membranes for temperature and pH-responsive delivery of d...
 
我coauther第一篇paper
我coauther第一篇paper我coauther第一篇paper
我coauther第一篇paper
 
Study of the effects of electrochemical aqueous sodium
Study of the effects of electrochemical aqueous sodiumStudy of the effects of electrochemical aqueous sodium
Study of the effects of electrochemical aqueous sodium
 
An overview on_biofiltration_modeling
An overview on_biofiltration_modelingAn overview on_biofiltration_modeling
An overview on_biofiltration_modeling
 
Gawrisch Insights From Biophysical Studies On The Role Of Pufa For Function O...
Gawrisch Insights From Biophysical Studies On The Role Of Pufa For Function O...Gawrisch Insights From Biophysical Studies On The Role Of Pufa For Function O...
Gawrisch Insights From Biophysical Studies On The Role Of Pufa For Function O...
 
Comparison of homeopathic globules prepared from high andultra-high dilutions...
Comparison of homeopathic globules prepared from high andultra-high dilutions...Comparison of homeopathic globules prepared from high andultra-high dilutions...
Comparison of homeopathic globules prepared from high andultra-high dilutions...
 
AHendersonCMTLabReport
AHendersonCMTLabReportAHendersonCMTLabReport
AHendersonCMTLabReport
 
A quantum-like model of homeopathy clinical trials: importance of in situ ran...
A quantum-like model of homeopathy clinical trials: importance of in situ ran...A quantum-like model of homeopathy clinical trials: importance of in situ ran...
A quantum-like model of homeopathy clinical trials: importance of in situ ran...
 
2011 NSF CAREER_Steve Koch Full Project Description
2011 NSF CAREER_Steve Koch Full Project Description 2011 NSF CAREER_Steve Koch Full Project Description
2011 NSF CAREER_Steve Koch Full Project Description
 
Goldschmidt Conference Abstract 2010
Goldschmidt Conference Abstract 2010Goldschmidt Conference Abstract 2010
Goldschmidt Conference Abstract 2010
 
Solubility and dissolution enhancement strategies-Current understanding and r...
Solubility and dissolution enhancement strategies-Current understanding and r...Solubility and dissolution enhancement strategies-Current understanding and r...
Solubility and dissolution enhancement strategies-Current understanding and r...
 
Final osmosis summary
Final osmosis summaryFinal osmosis summary
Final osmosis summary
 
Spreading of liquid drops over solid substrates like wets like- Eng.Bashar Sasa
Spreading of liquid drops over solid substrates like wets like- Eng.Bashar SasaSpreading of liquid drops over solid substrates like wets like- Eng.Bashar Sasa
Spreading of liquid drops over solid substrates like wets like- Eng.Bashar Sasa
 
Reaction of Succinic Acid with Superoxide Dismutase
Reaction of Succinic Acid with Superoxide DismutaseReaction of Succinic Acid with Superoxide Dismutase
Reaction of Succinic Acid with Superoxide Dismutase
 
Oral Presentation.pptx
Oral Presentation.pptxOral Presentation.pptx
Oral Presentation.pptx
 
Biomedical science adina georgiana dorobantu
Biomedical science adina georgiana dorobantuBiomedical science adina georgiana dorobantu
Biomedical science adina georgiana dorobantu
 
Intermolecular Interactions of Edaravone in Aqueous Solutions of Ethaline and...
Intermolecular Interactions of Edaravone in Aqueous Solutions of Ethaline and...Intermolecular Interactions of Edaravone in Aqueous Solutions of Ethaline and...
Intermolecular Interactions of Edaravone in Aqueous Solutions of Ethaline and...
 
bakal_sereda_en
bakal_sereda_enbakal_sereda_en
bakal_sereda_en
 
Toh et al. 2014
Toh et al. 2014 Toh et al. 2014
Toh et al. 2014
 

PNAS-2011

  • 1. Reconciliation of opposing views on membrane–sugar interactions Heidi D. Andersena , Chunhua Wanga,b , Lise Arlethc , Günther H. Petersb,d , and Peter Westha,b,1 a Research Unit for Functional Biomaterials, Roskilde University, 1 Universitetsvej, DK-4000, Roskilde, Denmark; b MEMPHYS—Center for Biomembrane Physics, University of Southern Denmark, Campusvej 55, DK-5230 Odense M, Denmark; c Faculty of Life Sciences, Biophysics, University of Copenhagen, 40 Thorvaldsensvej, DK-1871 Frederiksberg, Denmark; and d Department of Chemistry, Technical University of Denmark, DK-2800, Kgs. Lyngby, Denmark Edited by Harry B. Gray, California Institute of Technology, Pasadena, CA, and approved December 21, 2010 (received for review August 25, 2010) It is well established that small sugars exert different types of sta- bilization of biomembranes both in vivo and in vitro. However, the essential question of whether sugars are bound to or expelled from membrane surfaces, i.e., the sign and size of the free energy of the interaction, remains unresolved, and this prevents a molecular understanding of the stabilizing mechanism. We have used small- angle neutron scattering and thermodynamic measurements to show that sugars may be either bound or expelled depending on the concentration of sugar. At low concentration, small sugars bind quite strongly to a lipid bilayer, and the accumulation of sugar at the interface makes the membrane thinner and laterally expanded. Above ∼0.2 M the sugars gradually become expelled from the membrane surface, and this repulsive mode of interaction counteracts membrane thinning. The dual nature of sugar–mem- brane interactions offers a reconciliation of conflicting views in earlier reports on sugar-induced modulations of membrane proper- ties. membrane interface ∣ membrane structure ∣ preferential binding ∣ preferential exclusion ∣ interaction free energy Small sugars such as the disaccharides sucrose and trehalose are among the so-called osmolytes (1) or compensatory solutes (2), which are accumulated in response to environmental stress in virtually all taxa. Their function is to act as inert regu- lators of the osmotic pressure, but they also optimize the physical properties of the cytosol (3) and stabilize biomolecular conforma- tions against cold, drought, and heat (4–7). The same small carbohydrates have also proven useful in vitro as protectants or excipients for biopreservation (8). Many reports have shown that membranous structures are particularly stabilized by small sugars (4, 6, 9), but the definition of stabilization covers a wide range of biological and physical parameters. Thus, studies on intact cells have documented improved survival following expo- sure to heat, cold, drought, or chemical stressors (6, 10, 11). Other works have analyzed stabilization on the basis of phenom- enological properties of model membranes, for example, the leakage or intermixing of probes in liposomes (12, 13). Finally, stability has been discussed with respect to rigorous physical para- meters such as the structure or mechanical properties of lipid bilayers (14, 15). The current work addresses membrane dimen- sions and the thermodynamics of interaction with the purpose of elucidating fundamental aspects of membrane–sugar interrela- tionships. The different observations of sugar stabilization have sparked a large number of studies on sugars and model mem- branes (usually phospholipid bilayers) over the past 30 y. Inves- tigations of fully hydrated membranes show an interesting tendency to fall into two groups with mutually conflicting conclu- sions. Thus, many investigations have suggested direct (favor- able) interaction of sugars and the phospholipid interface (16–23), and it is obvious that such interactions could be the ori- gin of sugar effects, for example, through interlocking of several lipids molecules that simultaneously hydrogen bond to the same disaccharide molecule (24). Other stabilizing consequences of sugar binding have been put forward, and in this paper, we col- lectively refer to this interpretation as the “interaction hypoth- esis.” In contrast to this, other works have concluded that the sugars are preferentially expelled from the hydration zone and that their effect on the membrane is exerted indirectly by the local osmotic imbalance and the concomitant increase in interfacial free energy (25–30). We call this the “exclusion hypothesis.” The most unambiguous support for the interaction hypothesis is probably the lateral expansion of phospholipid monolayers, which is observed when, e.g., sucrose or trehalose is added to the aqueous subphase in a Langmuir–Blodgett trough (16–18, 31). The obvious interpretation of this is that the sugar molecules increase the area through intercalation between the lipid head groups. Other experimental approaches have reached analogous conclusions in work on lipid bilayers (19, 20, 24, 32), and Viera et al. (33) found that trehalose that was bound to a bilayer during dehydration remained associated for hours upon rehydration in buffer without sugar. Most recently, the interaction hypothesis has been supported by many molecular dynamics simulations (see, e.g., refs. 21–23 and references therein), which consistently reported membrane–sugar attraction and an associated buildup of sugar at the membrane interface. Conversely, the exclusion hypothesis is supported by a multitude of studies on the phase behavior of fully hydrated phospholipids showing that the addi- tion of sugars and other kosmotropic solutes consistently stabilize the phase with the smallest surface area (34, 35). For example, the gel phase is stabilized over the fluid phase (25, 27), hexagonal phases are favored over lamellar phases (34, 36), and the lateral expansion associated with interdigitation is strongly disfavored (37). This ubiquitous correlation is explained by a preferential expulsion or exclusion that increases the interfacial free energy and thus promotes the stability of lipid phases with low water ac- cessible areas. The exclusion hypothesis has been supported by some spectroscopic evidence (28), and recently both small-angle scattering studies (36, 38) and vapor pressure measurements (39) have provided direct evidence for a partial depletion of sugar in the hydration zone of lipid bilayers. Several aspects of the exclu- sion hypothesis were recently discussed by Lenné et al. (40) who concluded that “sugars partition away from the phospholipid headgroups, rather than inserting between the headgroups.” To address the obvious contrast between the interaction and exclusion hypotheses, we have used small-angle neutron scatter- ing (SANS) and thermodynamic measurements and found that the interaction of membranes and small sugars indeed includes both an attractive and a repulsive component. The former leads to a buildup of sugar at the interface (in accord with the inter- action hypothesis) at low sugar concentration, whereas the latter Author contributions: H.D.A. and P.W. designed research; H.D.A., C.W., L.A., and P.W. performed research; H.D.A., C.W., L.A., and P.W. contributed new reagents/analytic tools; H.D.A., C.W., L.A., G.H.P., and P.W. analyzed data; and L.A. and P.W. wrote the paper. The authors declare no conflict of interest. This article is a PNAS Direct Submission. 1 To whom correspondence should be addressed. E-mail: pwesth@ruc.dk. This article contains supporting information online at www.pnas.org/lookup/suppl/ doi:10.1073/pnas.1012516108/-/DCSupplemental. 1874–1878 ∣ PNAS ∣ February 1, 2011 ∣ vol. 108 ∣ no. 5 www.pnas.org/cgi/doi/10.1073/pnas.1012516108
  • 2. brings about an expulsion of sugar (as described in the exclusion hypothesis) in more concentrated samples. This unique mode of interaction is shown to make the membrane thinner and laterally expanded even if the interfacial free energy is increased. We suggest that this is the origin of earlier disagreement on sugar– membrane interactions in excess water and that this unusual interaction pattern should be considered in analyses of sugar- induced stabilization of fully hydrated membranes (whereas the issue of sugar effects on dry membranes is beyond the current scope). Results Data from SANS measurements were fitted with a molecular con- strained analytical model for polydisperse bilayer liposomes. We used a three-shell model for the bilayer cross-section and mod- eled the bilayer in terms of a central hydrophobic core, containing the hydrocarbon chains, sandwiched between inner and outer hydrophilic layers, composed by the hydrophilic head groups and hydration water. This approach, including its use of molecu- lar constraints, was pioneered by Luzatti and Husson (41), later refined (42, 43), and recently further modified and extensively applied to lipid bilayers by Kucerka et al. (44, 45). Our approach is similar in spirit to Kucerka’s approach (see SI Text). However, as the single SANS bulk contrast does not contain sufficient information to use the detailed structural model of Kucerka et al., we have, for simplicity, used a step-function-based scattering length density profile instead of Gaussian-based function. The free parameters of the model are R, the average radius of the liposomes, σR∕R, the relative standard deviation of the Gaussian describing the size distribution, Nhyd, the number of hydration water molecules per hydrophilic head group of the phospholipids, and Dbilayer, the total bilayer thickness. In addition to these model parameters, we also fitted an overall scaling factor, accounting for the product of the experimental uncertainties in the absolute scale calibration and sample concentration, respectively, and a small constant background. A more detailed description of the model is available in SI Text. The central SANS parameter for the current analysis is the thickness, Dbilayer, which is plotted as a function of the sugar con- centration in Fig. 1. It appears that the sugars consistently make the membranes thinner. The largest changes exceed 3 Å or about 8% of the total thickness, and the effect is quite similar for the two investigated lipids, DMPC (1,2-dimyristoyl-sn-glycero-3- phosphocholine) and DOPC (1,2-dioleoyl-sn-glycero-3-phospho- choline). Interestingly, the monosaccharide (glucose) induces only about half the thinning of the disaccharides (trehalose and sucrose) at the same weight fraction. The effect of sugar on the lipid volume was measured by densitometry. The specific volume, Vspec, of tertiary (waterþ sugar þ lipid) samples were calculated from the resonant frequencies measured in the densitometer, and the apparent specific volume (46) of the lipid, Vlip, was determined (47) as Vlip ¼ ½Vspec−ð1−wlipÞVsolventŠ wlip , where wlip is the weight fraction of lipid in the tertiary samples and Vsolvent is the specific volume of the binary aqueous solvent (water þ sugar, with exactly the same composition as the aqueous part of the tertiary sample). Values of Vlip are plotted as a function of the sugar concentration in Fig. 2. The net affinity of sugars for the membranes (i.e., the free energy of membrane–sugar interaction) was calculated from the dialysis measurements and expressed by the so-called prefer- ential binding parameter, Γ3, as described in SI Text and Table S1. This parameter quantifies the binding (or expulsion) in mol sugar per mol lipid, and it may be positive or negative. Positive values of Γ3 imply favorable interactions of sugar and membrane, and thus an accumulation of sugar at the membrane interface. Conversely, negative values of Γ3 occur when water–membrane interactions are stronger than sugar–membrane interactions and it entails a partial (or “preferential”) exclusion of the solute from the inter- facial zone. The results in Fig. 3 show that both of these cases occur for the membrane–sugar systems investigated here. Thus, Γ3 is positive in dilute sugar solutions but runs through a maxi- mum and becomes negative at higher concentrations. We note that the abscissa in Fig. 3 is the free sugar concentration (mea- sured outside the dialysis bag), whereas the abscissas in Figs. 1 and 2 are total (bound þ free) concentrations. However, calcula- tion of the bound fraction in Figs. 1 and 2 shows that this is small compared to the experimental errors, and it follows that the results in Figs. 1–3 may be compared directly and that the reported concentrations can be converted to osmolalities using activity coefficients for the binary aqueous sugar solutions. Discussion The understanding of sugar-induced stabilization of membranes will depend on the molecular description of sugar–membrane interactions. As illustrated in the Introduction, current views on this are divided on the question of whether sugars exert their effect through direct (attractive) interaction or indirect modula- tions, driven by preferential exclusion (Γ3 < 0). The preferential binding data in Fig. 3 emphasize the importance of sugar concen- tration in these discussions. Thus, at low concentrations, the sugars accumulate at the membrane interface (Γ3 > 0) in accord A B Fig. 1. Overview of the SANS results. (A) Examples of SANS data (points) and model fits (full lines). Black: DMPC in D2O. Fit parameters: R ¼ 427 Å, σR∕R ¼ 28%, Nhyd ¼ 1, Dbilayer ¼ 39.1Å. Red: DMPC in D2O with 20% treha- lose. Fit parameters: R ¼ 295 Å, σR∕R ¼ 26%, Nhyd ¼ 1, Dbilayer ¼ 35.7 Å. Both samples are measured at 40 °C. The sugar-induced thinning is directly visible in the data around q ¼ 0.1 Å−1 , where it makes the thinner bilayer (red) fall off toward zero at slightly higher q values. (B) The total bilayer thickness, Dbilayer, for, respectively, DOPC and DMPC as a function of the weight fraction of sugar. Fig. 2. Apparent volume of DMPC at 40 °C as obtained from the densitome- try measurements and plotted against the weight fraction of sugar. Volumes are given in both cm3∕g (left-hand ordinate) and Å3 ∕molecule (right-hand ordinate). Andersen et al. PNAS ∣ February 1, 2011 ∣ vol. 108 ∣ no. 5 ∣ 1875 BIOPHYSICSAND COMPUTATIONALBIOLOGY CHEMISTRY
  • 3. with the binding hypothesis. This effect reaches a maximum at about 3% (wt∕wt) for glucose and about twice this concentration for the disaccharides (that is about 0.2 M in all cases). For the disaccharides the amount of bound sugar at the maximum is 0.07 mol∕mol lipid; i.e., there is 1 sugar for each 14 lipids in the membrane. At higher sugar concentrations, Γ3 decreases lin- early to negative values thus signifying preferential exclusion of sugar from the membrane interface in accord with earlier reports (38, 39). These data are compiled and compared with the current results in Table S2. We interpret this nonmonotonic course of Γ3 as the result of two independent modes of interaction. One mode contributes positively to Γ3 (binding), whereas the other mode contributes negatively (exclusion). The positive values of Γ3 at low sugar show that the binding mode dominates under these conditions, and this is likely to reflect sugar–head group hydrogen bonding, as identified in several computational studies (see, e.g., refs. 21–23). Recently, computational analysis of systems at low water contents (48) has suggested that this binding couples to an enlarged lateral area as also seen in this work. At higher sugar concentration, the binding mode appears to saturate and to be exceeded by the exclusion mode, which drives Γ3 to negative va- lues. This is in accord with the general kosmotropic nature of small sugars, which tend to exclude them from aqueous interfaces (49) and thereby affecting lipid phase behavior (25, 27, 29, 34, 37, 50). It is important to note that the two suggested modes overlap and that the (thermodynamic) function Γ3 will quantify the sum of these contributions (and possibly other, as of yet unidentified effects). In a 5% trehalose solution, for example, where the bind- ing mode is most pronounced, there will also be a numerically smaller negative contribution to Γ3 from the exclusion mode. This overlapping also pertains to higher sugar concentrations where the negative Γ3-values will be composed of a positive con- tribution from the bound sugars, which is exceeded by the exclu- sion, so that the average composition of the aqueous solvent in the hydration zone is poorer in sugar than the bulk. Addition of sugars made the membranes thinner by as much as 8–9% for the highest concentrations (Fig. 1). The thinning pro- duced by the disaccharides was similar both for DMPC and DOPC, whereas the monosaccharide, glucose, generated a much smaller reduction in Dbilayer for both lipids. In spite of the decreas- ing thickness, the molecular volume of DMPC exhibited a weak increase with increasing sugar concentration up to 20% sugar (Fig. 2). A detailed analysis of the resulting lateral expansion awaits comprehensive scattering studies of the sugar content in the membrane interface, but if the area per phospholipid is simply estimated as the ratio of the volume and thickness (A ¼ Vlip∕Dbilayer), we find a maximal increase in phospholipid lateral area of 5–6 Å2 or 9% for the disaccharides (see Fig. S1). This number is estimated from the apparent volume of the lipid molecules and hydration water only. If the partitioning of sugar into the hydrophilic part of the membrane phase is included in the calculations, even higher degrees of expansion will be obtained. A more quantitative thermodynamic analysis of this can be carried out by means of the lateral equation of state that separates the intrabilayer free energy into three terms describing, respectively, the interfacial free energy, the head-group repul- sion, and the repulsion resulting from hydrocarbon chain entropy (51). It is interesting to compare the changes in membrane dimen- sions with the binding data in Fig. 3. Thus, at low sugar concen- tration (<5%), it is intuitive to conclude that the binding of sugar involves some degree of intercalation, which separates the lipid head groups and thus increases the lateral area. This, in turn, allows increased disordering of the lipid chains (more gauche conformers) and hence a thinning of the membrane, which is more pronounced for the disaccharides than for the smaller glu- cose (Fig. 1). This general behavior is typical for the interfacial binding of small molecules to membranes (52, 53), and we con- clude that the structural and thermodynamic results at low sugar concentration are mutually supportive. At higher sugar concen- trations we see a different and unorthodox picture. Thus, the ne- gative values of Γ3 and the associated increased interfacial free energy would be expected to compress the membrane laterally. Nevertheless, DMPC membranes in, e.g., 15% trehalose are thinner and laterally expanded compared to membranes in pure water. We suggest that this can be explained by the two modes of interaction discussed above. Thus, at 15%, the sugar molecules already bound at lower sugar concentrations are still in the mem- brane and these bound sugars still dominate the changes in mem- brane dimensions. At still higher sugar concentration, we find a compression of the lipids (negative slope of Vlip in Fig. 2), which suggests that the increased interfacial free energy associated with the exclusion eventually offsets the structural changes of the bound sugars. This conclusion is also in line with the occurrence of minima in the thickness data in Fig. 1 as the lateral expansion of the bound sugars is gradually counteracted by increasing inter- facial free energy (unfortunately SANS measurements could not be extended above 20% sugar with the current methods). Sugar–membrane interactions have been extensively discussed on the basis of lipid phase transition data, and many reports have concluded that addition of sugar favors the phase with the smal- lest interfacial area because of a preferential exclusion, which is common to all kosmotropes. We note that while Γ3 for the fluid membrane [Γ3ðfluidÞ] may be a useful parameter, changes in, e.g., the main (gel-to-fluid) transition temperature, Tm, is not governed by Γ3ðfluidÞ itself, but by the difference, ΔΓ3 ¼ Γ3ðfluidÞ − Γ3ðgelÞ. If, for example, ΔΓ3 is negative, the solute interacts more favorably with the gel phase and consequently stabilizes this phase (i.e., raises the temperature where it melts). Conversely, solutes with ΔΓ3 > 0 will lower Tm. The behavior of Γ3ðfluidÞ and Γ3ðgelÞ for the sucrose-DMPC system is illustrated in Fig. 3, Inset. Obviously, it is not possible to study the two different phases under the exact same conditions, so the experi- mental temperature was 18 °C and 30 °C, respectively, for studies of gel- and fluid-phase DMPC. It appears that the two curves are qualitatively similar with a maximum at the same location and hence that the two modes of interaction pertain to both phases. The binding to the gel phase is somewhat weaker, but the differ- ence is not large. The most conspicuous difference is the negative slope after the maximum, which is larger by a factor of three for the fluid phase compared to the gel phase (Fig. 3, Inset). This difference in slopes gives rise to substantial negative values of Fig. 3. Net affinity of sugars for unilamellar DMPC membranes expressed as the preferential binding parameter, Γ3, and plotted as a function of the weight fraction of sugar. The experimental temperature was 30 °C for data in the main panel. (Inset) Data for sucrose at 30 °C (closed symbols) where DMPC is in the fluid phase and 18 °C (open symbols) where DMPC is in the gel phase. Error bars are ÆSEM. In Table S2, results from this figure are expressed as partitioning coefficients and compared with literature data. 1876 ∣ www.pnas.org/cgi/doi/10.1073/pnas.1012516108 Andersen et al.
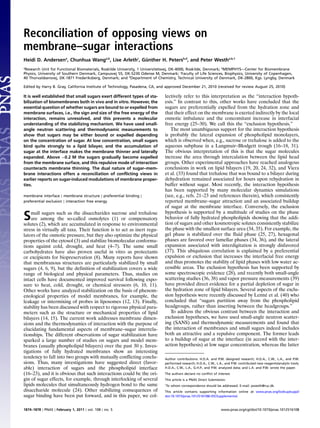
  • 4. ΔΓ3 in accord with the increased Tm reported at high sucrose (25, 50). Sucrose binding in dilute solutions is quite similar for fluid- and gel-phase DMPC (ΔΓ3 is small), and hence this binding is of minor importance for the phase equilibrium. The important para- meter for sugar effects on Tm is the unfavorable interaction of fluid membranes and sucrose at moderate and high concentra- tion. This interpretation is in line with the exclusion theory (34, 54), and we conclude that although this approach neglects the binding mode, exclusion theories may provide reasonable results on phase behavior because the binding mode has little effect on ΔΓ3. This limited effect of the binding mode on phase behavior is in strong contrast to the structural changes that couple to the binding. The main conclusions of this work are reiterated in the cartoon in Fig. 4. The data show that membrane–sugar interactions may be described by the overlapping action of an attractive and a repulsive component. The former is likely to reflect hydrogen bonding and to saturate at intermediate sugar concentrations. The latter is driven by the kosmotropic or “water-structure- making” effect (55), which causes a general depletion of sugars from aqueous interfaces (34, 54). The kosmotropic contribution dominates except at low sugar concentrations, where the attrac- tive contribution is stronger. The binding triggers significant changes in the dimensions of the bilayer (Fig. 1), which are in- creasingly counteracted by the exclusion, and reverted at very high sugar concentration (Fig. 2). It appears that this dual mode of interaction may be the cause of some controversy in earlier studies on sugar–membrane interactions, which is discussed in the Introduction. Thus, experimental approaches that are sensi- tive to the membrane dimensions (e.g., monolayer methods) will primarily detect the consequences of the binding mode, whereas macroscopic approaches (e.g., phase behavior and thermody- namics of interaction) will detect exclusion except at quite low sugar concentration, where the effects are difficult to measure. This interpretation provides a reconciliation of the binding and exclusion theories discussed in the Introduction. It is also inclusive to other observations on sugar–membrane interactions such as increased order parameters of the acyl chains at very high (67%) trehalose (56) where the compression exerted by the exclusion mode exceeds the binding-induced expansion. It appears to be of interest to study if this unique mode of interac- tion is important for the different types of membrane stabilization provided by small carbohydrates. Methods and Materials Chemicals. All lipids (99%) were purchased as powders (Avanti Polar Lipids) and used as supplied. Glucose [>99.5% D-(+)- glucose] and sucrose (>99.5% α-D-Glucopyranosyl β-D-fructo- furanoside) was from Sigma-Aldrich, and trehalose (>99% α-D-glucopyranosyl α-D-glucopyranoside) was from AppliChem. Normal water was freshly made in a MilliQ equipment (Milli- pore) and D2O (99.9 atom % D) was from Sigma-Aldrich. Small-Angle Neutron Scattering. Dry DMPC or DOPC was hydrated on the day of use by solutions of sugars in D2O. The lipid concentration was 6.2 mg∕mL. The lipid suspension was extruded to unilamellar liposomes through two stacked polycar- bonate filters with 100-nm pore size in a Lipex extrusion device (Northern Lipids). SANS experiments were performed at the SANS-II instrument at the Swiss Spallation Neutron Source (SINQ) at the Paul Scherrer Institute. Using three different com- binations of neutron wavelengths and sample-to-detector dis- tances, a q range from 0.005 to 0.3 Å−1 was covered. The SANS data were azimuthally averaged and background subtracted by the standard software used at the facility and normalized to absolute units of differential scattering cross-section per unit volume (cm2∕cm3) by division by the scattering spectrum of H2O (57). The wavelength spread Δλ∕λ was 10.5% FWHM. The resolution effects arising from wavelength spread and finite col- limation were taken into account in the data analysis by convolu- tion of the model with the appropriate resolution function at each setting (58). This is done automatically in the programs used for the data analysis. All samples were measured in 5 mm Hellma Quartz cells and at a temperature of 40 °C. Dialysis Measurements. Stock suspensions of 2–4% (wt∕wt) DMPC in MilliQ water were extruded to unilamellar liposomes. About 500 μL of the extruded solution was transferred to dialysis bags (Spectrum Laboratories Inc., molecular weight cutoff ¼ 12– 14 kDa), and placed in a closed beaker with 250 mL of sugar solution of the desired concentration. The beaker was placed on a shaking table in a thermostatted box (air bath) and slowly temperature cycled between 20 and 30 °C for 12 h. Slow passage through the main transition (at about 24 °C for DMPC) is asso- ciated with a massive transient leakage that provides transbilayer equilibration of small polar molecules (59). After the T cycling, the samples were held at 30 °C (Æ0.2 °C) for an additional 12 h. It is implicit for the subsequent data analysis that this treatment equilibrates the sugar across the membrane, and hence that the local sugar concentration in the hydration zone is the same for the two membrane leaflets. Samples from inside and outside the dialysis bag were retrieved and diluted 1∶50 (or 1∶100 for the highest sugar concentrations) in 50% 1-propanol, so that the liposomes dissolved and released their contents. The amounts of sugar and lipid were measured in a Varian 9012 HPLC equipped with a Sedex 85 evaporative light scattering detector and con- verted into molal concentration units as described in SI Text. Samples from the dialysis experiments were analyzed in five se- parate HPLC runs, and the standard error of mean of repeated measurements was less than 0.5%. Densitometry. Vacuum dried DMPC aliquots were hydrated with 2 mL of either pure water or previously prepared sugar solution (5–30% wt∕wt). All steps were quantified gravimetrically to with- in 0.01 mg. The samples were temperature cycled, shaken, and intermittently treated with light ultrasound prior to the densito- metry. The density of both tertiary (water–sugar–lipid) and binary (water–sugar) samples was measured in a DMA 601 vibrating tube densitometer (Anton Parr) at 40 Æ 0.01 °C. Prior to the mea- surements, the samples were degassed by stirring under vacuum Fig. 4. Simplified illustration of the hypothesis for sugar–membrane interactions. Intercalation of the bound sugar molecules at low sugar concentration (5–10%) makes the membrane thinner and laterally expanded. Under these conditions, the sugar:water molar ratio is increased in the vicinity of the membrane as indicated by the small graph (Middle). At about 20% sugar the concentration gradient near the interface has changed sign (Γ3 < 0), as indicated in the small graph (Right), but the membrane is still laterally expanded by the bound sugar. Andersen et al. PNAS ∣ February 1, 2011 ∣ vol. 108 ∣ no. 5 ∣ 1877 BIOPHYSICSAND COMPUTATIONALBIOLOGY CHEMISTRY
  • 5. for ∼45 s. This removal of microbubbles proved to be necessary for a satisfactory precision, and the associated loss of water through evaporation (∼1 mg) was quantified gravimetrically and corrected for in the data analysis. The instrument was regularly calibrated against pure water and air. The experimental repeat- ability was 3 × 10⁻⁶ cm3∕g. ACKNOWLEDGMENTS. Beamtime at the SANS-II instrument at the SINQ facility at the Paul Scherrer Institute in Switzerland is gratefully acknowledged along with experimental support from Dr. Sandor Balog. This work was supported by the Lundbeck Foundation, the Danish Agency for Science, Technology and Innovation (Grant 272-06-0505), and the Danish National Research Founda- tion through the establishment of the MEMPHYS Center of Excellence. Economical support from the Danscatt user program is also gratefully acknowledged. 1. Somero GN (1994) Adapting to water stress: Convergence on common solutions. Water and Life, eds GN Somero, CB Osmond, and CL Bolis (Springer, Berlin). 2. Gilles R (1997) “Compensatory” organic osmolytes in high osmolarity and dehydration stresses: History and perspectives. Comp Biochem Phys A 117:279–290. 3. Yancey PH, Clark ME, Hand SC, Bowlus RD, Somero GN (1982) Living with water-stress —Evolution of osmolyte systems. Science 217:1214–1222. 4. Crowe JH (2007) Trehalose as a “chemical chaperone”: Fact and fantasy. Molecular Aspects of the Stress Response: Chaperones, Membranes and Networks, eds P Csermely and L Vígh (Springer, New York), pp 143–158. 5. Crowe LM, Reid DS, Crowe JH (1996) Is trehalose special for preserving dry biomater- ials? Biophys J 71:2087–2093. 6. Singer MA, Lindquist S (1998) Thermotolerance in Saccharomyces cerevisiae: The Yin and Yang of trehalose. Trends Biotechnol 16:460–468. 7. Zachariassen KE (1985) Physiology of cold tolerance in insects. Physiol Rev 65:799–832. 8. Lee JC (2000) Biopharmaceutical formulation. Curr Opin Biotechnol 11:81–84. 9. Crowe JH, et al. (2001) The trehalose myth revisited: Introduction to a symposium on stabilization of cells in the dry state. Cryobiology 43:89–105. 10. Joo WH, et al. (2000) Intracellular changes of trehalose content in toluene tolerant Pseudomonas sp BCNU 171 after exposure to toluene. Biotechnol Lett 22:1021–1024. 11. Zavaglia AG, Tymczyszyn E, De Antoni G, Disalvo EA (2003) Action of trehalose on the preservation of Lactobacillus delbrueckii ssp. bulgaricus by heat and osmotic dehydra- tion. J Appl Microbiol 95:1315–1320. 12. Fabrie C, Dekruijff B, Degier J (1990) Protection by sugars against phase transition- induced leak in hydrated dimyristoylphosphatidylcholine liposomes. Biochim Biophys Acta 1024:380–384. 13. Rudolph AS, Crowe JH (1985) Membrane stabilization during freezing—The role of 2 natural cryoprotectants, trehalose and proline. Cryobiology 22:367–377. 14. Deme B, Dubois M, Zemb T (2002) Swelling of a lecithin lamellar phase induced by small carbohydrate solutes. Biophys J 82:215–225. 15. Genova J, Zheliaskova A, Mitov MD (2007) Monosaccharides (fructose, glucose) and disaccharides (sucrose, trehalose) influence the elasticity of SOPC membranes. J Optoelectron Adv M 9:427–430. 16. Crowe JH, Whittam MA, Chapman D, Crowe LM (1984) Interactions of phospholipid monolayers with carbohydrates. Biochim Biophys Acta 769:151–159. 17. Lairion F, Disalvo EA (2007) Effect of trehalose on the contributions to the dipole potential of lipid monolayers. Chem Phys Lipids 150:117–124. 18. Lambruschini C, Relini N, Ridi A, Cordone L, Gliozzi A (2000) Trehalose interacts with phospholipid polar heads in Langmuir monolayers. Langmuir 16:5467–5470. 19. Luzardo MD, et al. (2000) Effect of trehalose and sucrose on the hydration and dipole potential of lipid bilayers. Biophys J 78:2452–2458. 20. Strauss G, Schurtenberger P, Hauser H (1986) The interaction of saccharides with lipid bilayer vesicles—Stabilization during freeze-thawing and freeze-drying. Biochim Biophys Acta 858:169–180. 21. Leekumjorn S, Sum AK (2006) Molecular investigation of the interactions of trehalose with lipid bilayers of DPPC, DPPE and their mixture. Mol Simul 32:219–230. 22. Skibinsky A, Venable RM, Pastor RW (2005) A molecular dynamics study of the response of lipid bilayers and monolayers to trehalose. Biophys J 89:4111–4121. 23. Villarreal MA, Diaz SB, Disalvo EA, Montich GG (2004) Molecular dynamics simulation study of the interaction of trehalose with lipid membranes. Langmuir 20:7844–7851. 24. van den Bogaart G, Hermans N, Krasnikov V, de Vries AH, Poolman B (2007) On the decrease in lateral mobility of phospholipids by sugars. Biophys J 92:1598–1605. 25. Cevc G (1988) Effect of lipid headgroups and (nonelectrolyte) solution on the struc- tural and phase properties of bilayer-membranes. Ber Bunsen Phys Chem 92:953–961. 26. Deme B, Zemb T (2000) Measurement of sugar depletion from uncharged lamellar phases by SANS contrast variation. J Appl Crystallogr 33:569–573. 27. Rudolph AS, Goins B (1991) The effect of hydration stress solutes on the phase-behavior of hydrated dipalmitoylphosphatidylcholine. Biochim Biophys Acta 1066:90–94. 28. Soderlund T, Alakoskela JMI, Pakkanen AL, Kinnunen PKJ (2003) Comparison of the effects of surface tension and osmotic pressure on the interfacial hydration of a fluid phospholipid bilayer. Biophys J 85:2333–2341. 29. Stumpel J, Vaz WLC, Hallmann D (1985) An x-ray-diffraction and differential scanning calorimetric study on the effect of sucrose on the properties of phosphatidylcholine bilayers. Biochim Biophys Acta 821:165–168. 30. Takahashi H, Matsuo A, Hatta I (2002) Effects of salt on the lamellar and bicontinuous cubic phases of fully hydrated monoacylglycerol (monoelaidin). Phys Chem Chem Phys 4:2365–2370. 31. Johnston DS, Coppard E, Parera GV, Chapman D (1984) Langmuir film balance study of the interactions between carbohydrates and phospholipid monolayers. Biochemistry 23:6912–6919. 32. Diaz S, Amalfa F, de Lopez ACB, Disalvo EA (1999) Effect of water polarized at the carbonyl groups of phosphatidylcholines on the dipole potential of lipid bilayers. Langmuir 15:5179–5182. 33. Viera LI, Alonsoromanowski S, Borovyagin V, Feliz MR, Disalvo EA (1993) Properties of gel phase lipid-trehalose bilayers upon rehydration. Biochim Biophys Acta 1145:157–167. 34. Koynova R, Brankov J, Tenchov B (1997) Modulation of lipid phase behavior by kosmotropic and chaotropic solutes—Experiment and thermodynamic theory. Eur Biophys J Biophy 25:261–274. 35. Sanderson PW, Lis LJ, Quinn PJ, Williams WP (1991) The Hofmeister effect in relation to membrane lipid phase-stability. Biochim Biophys Acta 1067:43–50. 36. Kent B, et al. (2010) Measurement of glucose exclusion from the fully hydrated DOPE inverse hexagonal phase. Soft Matter 6:1197–1202. 37. Takahashi H, Ohmae H, Hatta I (1997) Trehalose-induced destabilization of interdigi- tated gel phase in dihexadecylphosphatidylcholine. Biophys J 73:3030–3038. 38. Lenne T, Bryant G, Garvey CJ, Kelderling U, Koster KL (2006) Location of sugars in multilamellar membranes at low hydration. Physica B 385–386:862–864. 39. Westh P (2008) Glucose, sucrose and trehalose are partially excluded from the interface of hydrated DMPC bilayers. Phys Chem Chem Phys 10:4110–4112. 40. Lenné T, Garvey CJ, Koster KL, Bryant G (2009) Effects of sugars on lipid bilayers during dehydration—SAXS/WAXS measurements and quantitative model. J Phys Chem B 113:2486–2491. 41. Luzzati V, Husson F (1962) Structure of liquid-crystalline phases of lipid-water systems. J Cell Biol 12:207–219. 42. Hayter JB, Zemb T (1982) Concentration-dependent structure of sodium octanoate micelles. Chem Phys Lett 93:91–94. 43. Hayter JB, Penfold J (1981) An analytic structure factor for macroion solutions. Mol Phys 42:109–118. 44. Kucerka N, et al. (2008) Lipid bilayer structure determined by the simultaneous ana- lysis of neutron and x-ray scattering data. Biophys J 95:2356–2367. 45. Uhrikova D, Kucerka N, Teixeira J, Gordeliy V, Balgavy P (2008) Structural changes in dipalmitoylphosphatidylcholine bilayer promoted by Ca2þ ions: A small-angle neu- tron scattering study. Chem Phys Lipids 155:80–89. 46. McGlashan ML (1979) Chemical Thermodynamics (Academic, London). 47. Peters GH, Hansen FY, Moller MS, Westh P (2009) Effects of fatty acid inclusion in a DMPC bilayer membrane. J Phys Chem B 113:92–102. 48. Golovina EA, Golovin A, Hoekstra FA, Faller R (2010) Water replacement hypothesis in atomic details: Effect of trehalose on the structure of single dehydrated POPC bilayers. Langmuir 26:11118–11126. 49. Pegram LM, Record MT (2009) Using surface tension data to predict differences in surface and bulk concentrations of nonelectrolytes in water. J Phys Chem C 113:2171–2174. 50. Crowe LM, Crowe JH (1991) Solution effects on the thermotropic phase-transition of unilamellar liposomes. Biochim Biophys Acta 1064:267–274. 51. Leontidis E, Aroti A, Belloni L, Dubois M, Zemb T (2007) Effects of monovalent anions of the Hofmeister series on DPPC lipid Bilayers part II: Modeling the perpendicular and lateral equation-of-state. Biophys J 93:1591–1607. 52. Coster HGL, Laver DR (1986) The effect of benzyl alcohol and cholesterol on the acyl chain order and alkane solubility of bimolecular phosphatidylcholine membranes. Biochim Biophys Acta 861:406–412. 53. Pedersen UR, Peters GH, Westh P (2007) Molecular packing in 1-hexanol-DMPC bilayers studied by molecular dynamics simulation. Biophys Chem 125:104–111. 54. Takahashi H, Matsuo A, Hatta I (2000) Effects of chaotropic and kosmotropic solutes on the structure of lipid cubic phase: Monoolein-water systems. Mol Cryst Liq Cryst 347:475–482. 55. Collins KD, Washabaugh MW (1985) The Hofmeister effect and the behavior of water at interfaces. Q Rev Biophys 18:323–422. 56. Bechinger B, Macdonald PM, Seelig J (1988) Deuterium NMR-studies of the interac- tions of polyhydroxyl compounds and of glycolipids with lipid model membranes. Biochim Biophys Acta 943:381–385. 57. Lindner P (2002) Scattering experiments: Experimental aspects, initial data reduction and absolute calibration. Neutrons, X-Rays and Light: Scattering Methods Applied to Soft Condensed Matter, eds P Linder and Th Zemb (Elsevier, Amsterdam). 58. Pedersen JS, Posselt D, Mortensen K (1990) Analytical treatment of the resolution function for small-angle scattering. J Appl Crystallogr 23:321–333. 59. Hays LM, Crowe JH, Wolkers W, Rudenko S (2001) Factors affecting leakage of trapped solutes from phospholipid vesicles during thermotropic phase transitions. Cryobiology 42:88–102. 1878 ∣ www.pnas.org/cgi/doi/10.1073/pnas.1012516108 Andersen et al.