1. Mechanism of Aβ Aggregation in Alzheimer’s Disease
CHRISTINE XUE, YOON LEE, Joyce Tran, Hongsu Wang, and Zhefeng Guo
Department of Neurology, Mary S. Easton Center for Alzheimer’s Disease Research,
Brain Research Institute, Molecular Biology Institute, University of California, Los Angeles
http://drugdiscoveryopinion.com/tag/alzheimers
Background
Quantification of Amyloid Fibrils: Thioflavin T
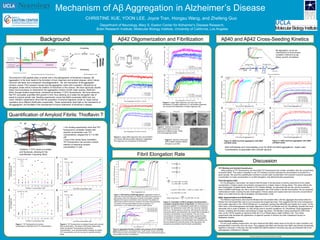
Aβ42 Oligomerization and Fibrillization Aβ40 and Aβ42 Cross-Seeding Kinetics
Discussion
Fibril Elongation Rate
Kumar and Walter 2011
Aβ aggregation curves are
characterized by three phases:
nucleation (refered to as lag
phase), growth, and plateau.
Figure 1. ThT fluorescence at various
combinations of Aβ fibril and ThT concentrations.
Figure 2. ThT fluorescence correlates linearly with amyloid
fibril concentration. The slope of this linear relationship,
which we termed “Fluorescence per Amyloid
Concentration”, is an amyloid-specific property at a given
ThT concentration and can be used to quantify amyloid
fibrils.
Thioflavin T (ThT) binds to β sheets
and fluoresces, allowing for the
quantification of growing fibrils.
• Our binding experiments show that ThT
fluorescence correlates linearly with
amyloid concentration over ThT
concentrations ranging from 0.1 to 500
µM
• Due to this strong linear correlation,
ThT fluorescence can provide a robust
method of measuring amyloid
concentration in vitro
Figure 3. Larger Aβ42 oligomers form amyloid fibrils
at a slower rate than smaller oligomers, suggesting
that oligomers are off-pathway to fibrillization.
Figure 5. Electron microscopy
(EM) of Aβ42 fibrils formed by
oligomers of different sizes. Fibrils
are morphologically similar.
The amyloid β (Aβ) peptide plays a central role in the pathogenesis of Alzheimer’s disease. Aβ
aggregation in the brain leads to the formation of toxic oligomers and amyloid plaques, which induce
neuronal cell death and consequent neurodegeneration. Yet, the mechanism of Aβ aggregation
remains unclear. Prior research reveals that Aβ aggregation starts with nucleation, followed by an
elongation phase which involves the addition of monomers to the nucleus. We have rigorously studied
these micro-processes to characterize the aggregation kinetics of both major species, Aβ40 and
Aβ42, through kinetics experiments monitored by thioflavin T (ThT) fluorescence. We have observed
that ThT accurately quantifies fibril growth in vitro, thus allowing us to relate the elongation rate of
seeds to amyloid growth rate. Seeding experiments reveal that Aβ40 accelerates Aβ42 and vice
versa. Filtration experiments show that the population of amyloid oligomers (small vs. large) during
nucleation have different fibrillization propensities. These experiments shed light on the mechanism of
Aβ aggregation and facilitate in the development of future treatments of Alzheimer’s disease.
Figure 7. Self-seeding of Aβ40 aggregation. Aggregation kinetics of
Aβ40 with a final concentration of 15μM in the absence and presence of
Aβ40 seeds. Each color represents a specific concentration of seeds.
Repeats of the same concentration were conducted. The addition of
Aβ40 seeds to Aβ40 induces an increase in the slope of the lag phase.
This slope in the lag phase reflects the rate of change in ThT
fluorescence, in turn reflecting the growth of Aβ40 seeded.
Figure 9. Calculation of fibril elongate and dissociation
constants using the slope of lag phase. (A) Seeds grow by
monomer addition. S1 represents a seed with no monomers
attached. S2 represents a seed with one monomer attached,
and so on. M represents a monomer. (B) Using the rate that
monomers attach and dissociate, the overall rate of change of
monomer concentration can be derived. The sum of the
concentration of seeds at different lengths equals the total
concentration of seeds in the beginning of the aggregation.
(C) The fibril elongation and dissociation rate constants can
thus be determined using the slope of the lag phase, the
monomer concentration and the seed concentration.
Figure 10. Aβ40 monomer aggregation with Aβ40
and Aβ42 seeds.
Figure 11. Aβ42 monomer aggregation with Aβ40
and Aβ42 seeds.
Both self-seeding and cross-seeding occur for Aβ40 and Aβ42 aggregations. Higher seed
concentrations is associated with a shorter lag time.
ThT Binding and Amyloid Quantification
When looking at ThT fluorescence, we found that ThT fluorescence has a linear correlation with the concentration
of amyloid fibrils. This makes it possible to use ThT binding to quickly estimate the concentration of amyloid for a
given sample. We used this quantification method to convert seed concentration from amyloid monomer equivalent
concentration to molar concentration in our fibril elongation rate determinination experiments.
Fibril Elongation Rate
For the elongation rate project, we observe that the slope in the lag phase is directly proportional to the seeds
concentration. A higher seeds concentration corresponds to a higher slope in the lag phase. This slope reflects the
rate of elongation of added seeds. Based on ThT binding findings, we speculate that we can use the conversion
factor 0.02686 FoldChange per uM to convert elongation rate of the seeds to the Aβ concentration. By our proposed
mathematical model, knowing the rate of elongation of these seeds and original seed and monomer concentrations
allows us to determine the rate of elongation and dissociation of Aβ.
Aβ42 oligomerization and fibrillization
The filtration experiments show that the filtrates from the smallest filter (100 kD) aggregate the fastest while the
filtrates from the largest filter size (0.2 µm) possess the longest lag times. This suggests that the more homogenous
and smaller oligomers in the 100 kD filtrates are “on-pathway” species that efficiently and rapidly form nuclei. On the
other hand, more heterogeneous and larger oligomers in the 0.2 µm filtrates may be “off-pathway” species that must
dissociate first in order to fibrillize. Or, they simply exist in dynamic equilibrium as “off-pathway” large aggregates in
solution, inhibiting fibril formation (and leading to longer lag times). The filtration mixing experiments confirm this
view, as the 100 kD speeds up lag times while the 0.2 µm filtrate plays a slight inhibitory role. Thus these
experiments help elucidate the significance of oligomer species in solution and their subsequent impact on
fibrillization kinetics.
Cross-Seeding Experiments
For the cross-seeding experiments, we have observed that Aβ40 seeds serve as the site for rapid nucleation and
template Aβ42 monomers, and vice versa. This suggests that Aβ42 and the less toxic Aβ40 may interact dynamically
together in the brain. In this way, the ratio of Aβ40 and Aβ42 proteins in the brain may play an important role in the
pathogenesis of Alzheimer’s disease.
Madine & Middleton,2009
Figure 4. Larger Aβ42 oligomers can slow down the
fibrillization of smaller oligomers (A), and smaller oligomers
can promote the fibrillization of larger oligomers (B).
Funding is supported by the National Institutes of Health.
0.0000250.0000250.0000250.000025
Figure 8: Aggregation kinetics of Aβ40 in the presence of 0.15 uM Aβ40
seeds. Aβ40 monomer concentrations are 10 μM, 20 μM, 30 μM, and 40 μM.
When fixing the seeds concentration, the slope maintains consistent throughout
varying Aβ40 monomer concentrations.
Figure 6. Electron microscopy
(EM) of Aβ42 samples filtered
through 0.2 µm filter.