1. Stevia Rebaudian Bertoni and
the Effects on Insulin Sensitivity
Christopher M. Isken
HNF 480 S’09
RESULTS AND DISCUSSION
REFERENCES
NULL HYPOTHESIS
ABSTRACT
CONCLUSION
INTRODUCTION
Stevioside, a glycoside present in the leaves of the plant,
Stevia rebaudiana Bertoni, has shown to have potential
antihyperglycemic effects. Stevia may increase the insulin
secretion, in part, by induction of genes involved in glycolysis.
Purpose of this research is to analyze the effects of Stevia on the
body prior and during a standard oral glucose tolerance test
using an analox instrument.
Null Hypothesis:
There will be no difference comparing a normal oral glucose
tolerance test compared to supplementing Stevia extract 30 minutes
prior.
In the glucose tolerance experiment, glucose in the blood
will be oxidized to Gluconic acid and Hydrogen Peroxide by a
glucose oxidase enzyme. Oxygen is utilized in the production of
hydrogen peroxide and the disappearance of oxygen is
proportional to the amount of glucose in the sample.
All test subjects were administered two tests, a baseline
measuring normal blood glucose concentration during fasting,
and the second test using Stevia as the variable. Subjects showed
a 13% increased response in glucose metabolism with the first 20
minutes of testing. As a result of increased insulin response,
subjects showed enhanced blood glucose stability, decreasing the
short hypoglycemic effect that appeared during the initial
baseline test. Blood glucose stasis was present as early as 40
minutes after consuming glucose solution while taking Stevia,
while baseline test appeared to stabilize near the 100 minute
mark.
Consumption of Stevia has shown increase insulin
sensitivity, thus, the null hypothesis was incorrect.
Stevioside, a glycoside present in the leaves of the plant,
Stevia rebaudiana Bertoni, has shown to have potential anti-
hyperglycemic effects. Stevioside may increase the insulin
secretion, in part, by induction of genes involved in glycolysis.
Insulin is a hormone produced by the body which causes
cells in the liver, muscle, and adipose to take up glucose from the
blood, storing it as glycogen in the liver and muscle, and stopping
the use of fat as an energy source. When the body detects an
increase of glucose in the blood, insulin is the main source for
glucose uptake. Using a standardized blood glucose test, we can
measure insulin efficiency and levels of glucose in the blood. The
data recorded during normal blood glucose tolerance test
compared to supplemented with Stevia will determine the net
increase of insulin sensitivity.
1. Fast for at least 4 hours prior to testing ( when doing second
test consume stevia solution (5g/L) 30min before glucose
tolerance test)
2. Obtain,
-Lancets
-Capillary tubes containing heparin, Fl-, and –NO2
-200ml glucose water concentration (50g/L conc.)
-Sanitizing swabs, paper towel
3. Warm hands or jog in place to increase heart rate
4. With lancet prick finger and squeeze to produce a blood
droplet.
5. Take capillary tube and consistently “dab” blood until lancet is
~70% full.
6. Mix blood with capillary mix of heparin, Fl-, and –NO2. The
heparin prevents the blood from clotting, the Fl- ion inhibits
glycolysis in the red blood cell and the –NO2 forms met-
hemoglobin. Both the Fl- and the –NO2 prevents the red
blood cell from using the glucose in your blood while you are
waiting to analyze your sample.
7. Tape and label capillary tube to paper towel.
8. Consume 200ml glucose solution within a 10min period.
9. Repeat steps 4, 5, 6, and 7 as described 20, 40, 60, 80, and 100
minutes after consumption of the glucose solution.
10. Inject 10μL of blood into the analox system, record values
into excel spread sheet.
There will be no difference comparing a normal glucose tolerance
test compared to supplementing Stevia 30 minutes prior.
MATERIALS AND METHODS
A. Douglas Kinghorn. Stevia: The genus Stevia. London: Taylor
& Francis; 2002.
B. Deepthi K. Weerasinghe, Grant E. DuBois. Sweetness and
Sweeteners: Biology, Chemistry, and Psychophysics. USA:
Oxford University Press; 2008
C. Nelms, K. Sucher, S. Long. Nutrtition Therapy and
Pathophysiology. USA: Thomson Brooks/Cole; 2007
Though not all subjects showed a net decrease of blood
glucose concentration when supplemented with Stevia, there was a
net change in all subjects showing decreased hypo/hyperglycemic
effects.
By closely comparing results by an individual basis, Stevia
has had a positive effect on increasing insulin sensitivity. With
increasing insulin response, subjects displayed extended period of
blood glucose homeostasis.
In conclusion, there was an increase in insulin response
when supplementing Stevia thirty minutes before a standard oral
glucose tolerance test. Thus, the null hypothesis was incorrect.
Stevia supplementation showed positive effects among 3
subjects (C,D,E) showing a mean decrease of 20 mg/dL blood
glucose concentration during the 100 minute time period. All test
subjects showed greater stability in blood glucose levels,
decreasing the major spikes of glucose concentrations in the
blood. The decrease in blood glucose concentration can be
directly related to the body insulin response.
RESULTS AND DISCUSSION
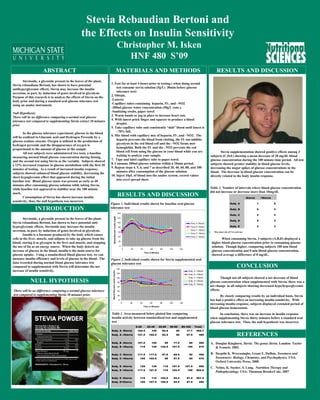
Figure 1. Individual results shown for baseline oral glucose
tolerance test
Table 2: Number of intervals where blood glucose concentration
did not increase or decrease more than 10mg/dL
1. Max intervals of 5 in each test
0
20
40
60
80
100
120
140
0 20 40 60 80 100 120
Time in Minutes
BloodGlucoseLevels(mg/dL)
Subj. A +Stevia
Subj. B +Stevia
Subj. C +Stevia
Subj. D +Stevia
Subj. E +Stevia
0
20
40
60
80
100
120
140
0 20 40 60 80 100 120
Time in Minutes
BloodGlucoseLevels(mg/dL)
Subj. A -Stevia
Subj. B -Stevia
Subj. C -Stevia
Subj. D -Stevia
Subj. E -Stevia
Figure 2. Individual results shown for Stevia supplemented oral
glucose tolerance test
0-20 20-40 40-60 60-80 80-100 Total
Subj. A -Stevia 102.5 105 92.5 85 77.7 462.7
Subj. A +Stevia 107.5 102.5 92.5 90 87.5 480
Subj. B -Stevia 107.5 125 95 77.5 80 485
Subj. B +Stevia 115 125 122.5 107.5 105 575
Subj. C -Stevia 117.5 117.5 87.5 82.5 90 495
Subj. C +Stevia 105 102.5 85 87.5 90 470
Subj. D -Stevia 125 135 115 107.5 107.5 590
Subj. D +Stevia 117.5 127.5 110 102.5 105 562.5
Subj. E -Stevia 110 115 102.5 92.5 87.5 507.5
Subj. E+Steiva 100 107.5 102.5 92.5 87.5 490
Table 1. Area measured below plotted line comparing
insulin activity between standardized test and supplemented
test
-Stevia +Stevia
Subj. A 1 5
Subj. B 0 3
Subj. C 2 3
Subj. D 2 3
Subj. E 3 3
When consuming Stevia, 3 subjects (A,B,D) displayed a
higher blood glucose concentration prior to consuming glucose
solution. Though higher, comparing subjects 100 min blood
glucose concentration and 0 min blood glucose concentration,
showed average a difference of 8 mg/dL.