1. Copyright 2004, Society of Petroleum Engineers Inc.
This paper was prepared for presentation at The Seventh SPE International Conference on
Health, Safety, and Environment in Oil and Gas Exploration and Production held in Calgary,
Alberta, Canada, 29–31 March 2004.
This paper was selected for presentation by an SPE Program Committee following review of
information contained in a proposal submitted by the author(s). Contents of the paper, as
presented, have not been reviewed by the Society of Petroleum Engineers and are subject to
correction by the author(s). The material, as presented, does not necessarily reflect any
position of the Society of Petroleum Engineers, its officers, or members. Papers presented at
SPE meetings are subject to publication review by Editorial Committees of the Society of
Petroleum Engineers. Electronic reproduction, distribution, or storage of any part of this paper
for commercial purposes without the written consent of the Society of Petroleum Engineers is
prohibited. Permission to reproduce in print is restricted to a proposal of not more than 300
words; illustrations may not be copied. The proposal must contain conspicuous
acknowledgment of where and by whom the paper was presented. Write Librarian, SPE, P.O.
Box 833836, Richardson, TX 75083-3836, U.S.A., fax 01-972-952-9435.
Proposal
As part of the Shell Exploration and Production Hearts and
Minds research programme, four operating companies across
the globe took part in a study investigating the attitudes that
lead to risk-taking behaviour among drivers. Initially, depth
interviews were carried out in Holland, Nigeria, Thailand and
the Sultanate of Oman with a range of professional drivers,
both company employed and contracted. The interviews
focused on four problem behaviours: use of seatbelts; driving
while fatigued; overloading/unsafe loading; and driving with
excess speed for the conditions. Several perceived barriers to
safe driving were identified, as well as factors that encouraged
correct behaviour. These factors were further investigated in a
follow up survey, which also assessed several types of biased
thinking that can lead to risky driving. 400 professional
drivers in the same four locations in summer 2003 completed
the questionnaire. The output analysis of this work is intended
to provide the areas to focus on with drivers, supervisors and
management in the planned Hearts and Minds tool with the
working title “Driving Safely” that is to be published in 2004.
Introduction
Keeping a global upstream company on the move through
driving is an enormous task. Every day, right across the globe,
there are thousands of vehicle movements. Some of this
driving is done in inhospitable, and potentially dangerous
driving environments. Driving accidents are the biggest killer
in the Shell Exploration and Production with 50% of all fatal
accidents being driving related.
Most of the time vehicles used by Shell companies are
driven on public roads and in countries where driving is a
high-risk activity in general, and therefore it is also high risk
activity for the company and its contractors. In 1997, the
World Health Organisation (WHO) reported that traffic
accidents caused as many as 4% of all deaths worldwide. In
1998, 1.1 million people died as a direct result of injuries
sustained in a road traffic accident. In the same year, people
involved in road traffic accidents received almost 39 million
injuries. It has been predicted by the WHO that road traffic
accidents will rise from the 7th to 2nd most frequent cause of
death by 2020.
In Shell Exploration and Production we are concerned by
this particularly as driving a vehicle is one of the few activities
in our operations that is unsupervised once a journey
commences (Malone 2004). In this unsupervised state you are
very much relying on the attitude and behaviour of the driver
to be intrinsically motivated to conduct the journey safely.
These attitudes and behaviours cannot be ignored and
therefore a study was kicked off to understand the attitude and
behaviours of drivers globally.
Survey Results
In the follow-up survey drivers were asked how far they
agreed with 25 attitude statements, developed to reflect the
opinions expressed by the population of drivers who were
originally interviewed.
The attitude statements were then reduced to a set of
eight underlying dimensions, using a multivariate statistical
analysis technique called factor analysis. Table 1 in Appendix
1 shows these eight dimensions, the attitude statements they
included, and the percentage of drivers agreeing with each.
Survey Findings
The following were the key findings from the study:
1. The vast majority of the drivers surveyed intend to
drive safely and follow all the rules. However, the
interviews suggested that for many drivers, this
actually reflects the belief that they have to look out
for themselves, as nobody else will.
2. Several interviewees indicated that, from time to
time, their company places schedules and workloads
on them that require them to drive in ways that
compromise their safety. When this happens they
simply refuse.
3. More then half of all drivers felt that that they are
good enough drivers to avoid accidents as long as
they are careful, and that they can decide whether or
not to follow the driving safety rules.
SPE 86842
Influencing Driver Attitudes and Behaviour
Dianne Parker, University of Manchester & Charles Malone, Shell Exploration and Production
2. 2 SPE 86842
4. Of concern was that almost half said that some
driving safety procedures just get ignored, and
everyone knows it.
5. Some drivers said that, even when they are tired, their
driving performance is not affected. However,
fatigue always leads to problems, and drivers need to
be made aware that they are no exception.
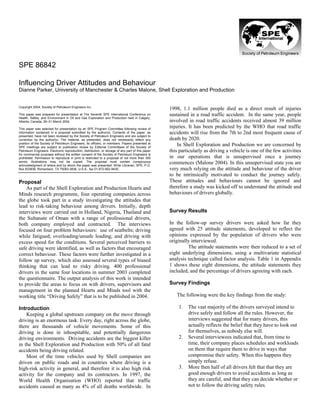
6. As might be expected and illustrated in figure 1, there
were differences in attitudes between Shell company
drivers and contractor drivers. Shell company drivers
perceived safety efforts to be correctly focused
whereas contractors were indifferent towards the
accuracy of this focus.
7. Those driving for contractors had more of a sense of
powerfulness than Shell company drivers, which
means they were more likely to feel relatively
invulnerable and in control. When driving this is not
a desirable way to feel, as a state of ‘chronic unease’
is better preparation for an unexpected event.
8. Contractors more readily acknowledged the negative
effects of both fatigue and overwork than Shell
company staff. This may reflect actual differences in
pressure of work or the contractor drivers may be
more aware of or willing to acknowledge the fact that
their personal safety is compromised when they are
fatigued and/or overworked.
9. With reference to table 2 in Appendix 1 more drivers
believe themselves to be better and safer than the
average professional driver than can actually be
possible. Given a normal distribution for
professional drivers, only 50% of drivers can be
above average. Over sixty percent of drivers rated
themselves more skilled than average and over
seventy percent as safer than average. Similarly,
over three quarters of all drivers thought they were
less likely to be involved in an accident than the
average professional driver.
Conclusions
There is clearly a lot of work to be done in changing some
of the attitudes observed from the survey. Most of the issues
identified were to do with what the drivers think about the way
their job is organised, and the things they are expected to do.
Changing these attitudes will require change from
management and supervisors.
It is now planned to develop a Hearts and Minds tool with
the current working title “Driving Safely”. The focus of the
tool will be to take not only the drivers, but also the
management and supervisors of drivers, through the safe
behaviour model (Bryden et al, 2004) addressing the attitudes
observed in the survey findings reported in this paper. The
objectives of this tool are to intrinsically motivate drivers to
conduct a safe journey and to work with supervisors and
management of these drivers to create the environment for this
to happen. The “Driving Safely” tool is planned to be
published in 2004.
Acknowledgements
Appreciation and thanks are given to the drivers working
for and contracted to The Shell Petroleum Development
Company of Nigeria Limited, Nederlandse Aardolie
Maatschappij B.V. (Netherlands), Petroleum Development
Oman LLC (Sultanate of Oman) and Thai Shell Exploration
and Production Co., Ltd. for participating in the interviews
and the follow-up survey questionnaires for this study.
References
1. Malone, C., “Tackling Road Safety In a Global Upstream
Business: An integrated and long-term approach”, Paper
SPE 86751 presented at 2004 SPE Conference on HSE in
Oil and Gas Exploration and Production, Calgary, 2004.
2. Bryden, R., S., Hudson, PTW., Van der Graaf, G. & Vuijk,
M., “Why did I do that?: From unsafe acts to working
safely”, Paper SPE 86876 presented at 2004 SPE
Conference on HSE in Oil and Gas Exploration and
Production, Calgary, 2004.
Figure 1: Significant Shell - contractor
differences
1
1.5
2
2.5
3
3.5
4
Focus
Pow
erfulness
O
verw
ork
Fatigue
Contractors
Shell drivers
3. SPE 86842 3
Appendix 1
Table 1: Underlying attitude dimensions
Dimension Agreement %
Willingness to take personal responsibility for my own safety 90.8
As a professional driver it is my responsibility to make sure that I always drive in a safe way
I intend to follow the safety rules every time I make a journey for work
Part of being a professional driver is always following all of the safety procedures
This company genuinely wants all of its drivers to follow all of the rules all of the time
The belief that overwork compromises my safety 14.3
If I tried to follow all of the safety rules when it is very busy, there would be a lot of pressure
just to get the job done
My line manager knows that I am sometimes given too much to do during a shift and still drive
safely
If I complained about being given too much to do, I would just be told to get on with it
The belief that safety violations are unavoidable 6.7
I do not expect to follow all of the driving safety rules on every journey
Some of the safety rules we have to comply with are ridiculous and inappropriate
I have no choice but to drive when I am feeling very tired sometimes
A feeling of powerfulness 54.6
It is mainly up to me to decide whether to follow the driving safety rules
As long as I am careful I will not be involved in any driving accidents
The Company is responsible for ensuring my safety while I am driving for them
Traffic accidents are always avoidable if you are a good enough driver
The belief that the focus of the safety effort is incorrect 15.8
Management in this company turn a blind eye to the safety rules when it suits them
When a professional driver is involved in an accident, it is usually not their fault
Too much attention is paid to unimportant aspects of safety, while some more important ones
get ignored
The belief that the Company genuinely cares about driving safety 62.8
If we had concerns about a driving safety issue the Company would always listen
You can always get the job done within the time allowed if you follow all the safety rules
The belief that fatigue compromises my safety 12.8
Even if I am feeling tired, it does not affect my driving performance
Even when I have to drive very long hours, fatigue is not a problem for me
The belief that some safety rules are just ignored 44.3
People in the Company know perfectly well that some safety rules get broken on a regular basis
There are some safety rules here that most people just ignore
Table 2: Percentage of drivers believing that they are MORE or MUCH MORE skillful and safe than the average professional driver.
How skillful, compared to average? 62.4%
How safe, compared to average? 71.8%
How likely to have an accident, compared to average? 24.9%