1. Revealing the Role of Cancer Testes Antigens in HIF Signaling
Charles Okechukwu1, Joshua Wooten2, Kathleen Corcoran2, PhD., Rebecca Sinnott2, Patrick Taus2, Kimberly Maxfield2,
Angelique Whitehurst, PhD 2.
1Partners program, Departments of Chemistry and Pharmaceutical science, North Carolina Central University, Durham, NC; 2Department of Pharmacology, University of North Carolina at
Chapel Hill, NC.
Abstract
The hypoxia –inducible factor-1 (HIF-1α), is a transcription
factor that responds to changes in oxygen homeostasis1.
Furthermore, the HIF pathway has been observed to
contribute to tumor aggressiveness. The overexpression of
HIF proteins has been observed to increase malignancy in
tumor cells. Identifying the mechanisms that regulate HIF is
essential to developing therapeutic strategies to inhibit its
function. Here, we asked whether any members of the
cancer-testes (CT)-antigen (CTA) family support HIF
signaling. We combined an siRNA mediated loss of function
approach with a luciferase reporter fused to a HIF Response
Element (HRE) to determine consequences on HIF signaling
following individual depletion of 120 CTAs. This screen
revealed a subset of CT-antigens play a role in Hif1α protein
binding to HRE. It was then shown that depletion of this
subset of CTAs; MAGEA3/6 and IGF2BP3, lead to
decreased Hif1α protein by western blot. These findings
suggest that CTAs may support stress signaling, particularly
under hypoxic conditions, and further demonstrate that CTAs
may be playing functional roles in supporting tumor cell
survival.
Introduction
References
Hypoxia inducible factor-1(HIF-1) is a transcription
factor that responds to changes in available oxygen. This
is especially observed with an oxygen decrease. They are
heterodimeric proteins that are made up of HIF-1α and
HIF-1β subunits. We were looking at the HIF-1α subunit
in this project. In a normal cell, HIF-1α is constitutively
degraded. In tumor cells it has been observed that the
overexpression of HIF-1α leads to very aggressive
tumors. Also, when HIF-1α is knocked down, the
growth of tumor growth slows down. HIF-1α has been
shown to be overexpressed in many tumor cells and thus
the Hif pathway is of importance in anticancer
therapeutics. Understanding the tumor-specific
mechanisms that regulate the HIF pathway is essential
for revealing new molecular targets for inhibiting tumor
growth by disrupting this pathway.
Using a loss of functions screening approach, we
identified modulators of the HIF pathway. The focus was
on a set of genes, CT-antigens, that are selectively
expressed in tumors and testes. To measure HIF
dependent transcription, a luciferase gene, fused to a HIF
Response Element (HRE) was used. Genes that led to
changes in the luciferase signal when knocked down
using siRNAs were deemed “hits” in this assay.
1.Semenza G. Hydroxylation of HIF-1: Oxygen sensing
at the molecular level. Physiology. 19: 176-182, 2004.
Experimental Approach
Results
The hits were chosen based on their Z scores from the
screen.
Hypothesis or Questions
Determine if hits from screen that impact Hif1α
gene expression alter Hif1α protein expression.
Conclusions & Areas for
Further Study
We conclude that knocking down MAGEA3,
IGF2BP3, and MAGEA6 were shown by western blot
to decrease the amount of Hif1α present in the cell.
Acknowledgements
CO was supported by the PARTNERS Research and
Training Program in Health Disparities, funded
through grant 5-U54-CA156733 from the National
Cancer Institute. This work was funded by an
Innovative Research Grant from Stand Up to Cancer.
Special thanks to Dr. Angelique Whitehurst, Ph.D.
Western blot was used to validate the hits from the
screen.
Harvested cell lysates using 2X sample buffer to lyse
the cells.
Separated proteins by size using gel electrophoresis.
Transfer to PVDF membrane.
Blocked with 5% milk.
Detection with primary and secondary antibodies.
Analysis using chemilumescent detection.
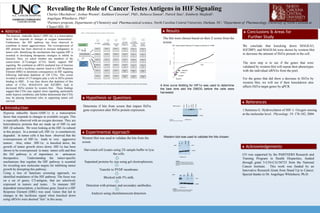
Western blot was used to validate the hits chosen:
Hif1α
MAGEA3
GAGEC1
siRNA: α HIF1α
α GAPDH
FIGURE 3.
Knockdown of MAGEA3 lowered HIF1α protein
expression in H1299 cells as seen in the screen.
GAGEC1 did not match the phenotype observed in
the screen.
A time curve blotting for HIF1α was used to determine
the best time add the DMOG before the cells were
harvested.
0hours
0.5hours
1hour
3hours
16hours
24hours
DMOG Treatment:
H1299 Cell Line
α Hif1α
α GAPDH
H1299 Cell LineFIGURE 2.
DMOG dose curve for H1299 cells.
MM
Hif1α
MAGEA6
IGF2BP3
siRNA:
α Hif1α
α GAPDH
FIGURE 4.
MAGEA6 and IGF2BP3 showed similar phenotypes
by western blot to what was seen in the screen.
H1299 Cell Line
The next step is to see if the genes that were
validated by western blot will repeat their phenotypes
with the individual siRNAs from the pool.
For the genes that did show a decrease in Hif1α by
western blot, we will see if their knockdown also
affects Hif1α target genes by qPCR.
5uM siRNA
Intermediate plate
10
ul/well
10 ul/well
RPMI/duofect
80ul/well
cells
30 ul/well
175 ul RPMI
+ 100ng
HRE + 2ng
pRL/well
1
2
3 4 5
6
Assay 1
Assay 2
Assay 3
Assay 4
Assay 5
Assay 6
Assay 1
Assay 2
Assay 3
Assay 4
Assay 5
Assay 6
Assay 1
Assay 2
Assay 3
Assay 4
Assay 5
Assay 6
Assay 1
T
Assay 2
T
Assay 3
T
Assay 4
UT
Assay 5
UT
Assay 6
UT
7
20 ul/well
Recombinatant
Firefly
Luciferase
Assay 1
T
Assay 2
T
Assay 3
T
Assay 4
UT
Assay 5
UT
Assay 6
UT
8
20 ul/well
Renilla
Luciferase
Assay 1
T
Assay 2
T
Assay 3
T
Assay 4
UT
Assay 5
UT
Assay 6
UT
40 ul/well
DMSO (UT)
or DMOG (T)
We determined the induction of Hif-1 using measurements obtained from luminescence of firefly and renilla luciferase.
FIGURE 1. Schematic of High-throughput screen using siRNA and luciferase reporters.