SlideShare a Scribd company logo
1 of 5
Download to read offline
Financial Statement Model for BlackStone Group Author: Chan Oh
All figures in thousands, except per share data
Scenario selected: Base case
DO NOT TOUCH
General assuamptions Select scenario 2
Company Name BlackStone Group Pre-tax 2004 2005 2006 1 Best case
Latest Fiscal year end (mm/dd/yy) 12/31/12 Nonrecurring expense/(income) in COGS 2 Base case
Current share price $22.23 Nonrecurring expense/(income) in SG&A and Other 3 Weak case
Current date 9/16/13 Nonrecurring expense/(income) in nonoperating (income)/loss
After-tax - LEAVE BLANK IF NO AFTER-TAX DATA PROVIDED BY CO. EXPLICITLY
Firstcall Consensus EPS estimates Nonrecurring items in COGS
12/31/12 $0.41 Nonrecurring items in SG&A
12/31/13 $0.59 Nonrecurring items in nonoperating (income)/loss
12/31/14 $0.74 Total nonrecurring charges per share
Expected EPS growth rate 16%
Circularity breaker
Circular reference breaker
Off=1, On=0 1
Income Statement
2010 2011 2012 2013 2014 2015 2016 2017 2018 2019 2020 2021
12/31/10 12/31/11 12/31/12 12/31/13 12/31/14 12/31/15 12/31/16 12/31/17 12/31/18 12/31/19 12/31/20 12/31/21
Total Revenues 3119342.0 3252576.0 4019441.0 5295211.6 6370139.5 6752347.9 7157488.8 7586938.1 8042154.4 8524683.6 9036164.7 9578334.5
Compensation and Benefits - REPORTED 3610189.0 2738425.0 2605244.0
Compensation and Benefits - PRO FORMA 3610189.0 2738425.0 2605244.0 3432148.4 4128874.6 4376607.1 4639203.5 4917555.7 5212609.0 5525365.6 5856887.5 6208300.8
SG&A and Other - REPORTED 466358.0 566313.0 548738.0
SG&A and Other - PRO FORMA 466358.0 566313.0 548738.0 722907.4 869657.7 921837.1 977147.3 1035776.2 1097922.7 1163798.1 1233626.0 1307643.6
Operating profit - EBIT (957205.0) (52162.0) 865459.0 1140155.7 1371607.3 1453903.7 1541138.0 1633606.2 1731622.6 1835520.0 1945651.2 2062390.2
Interest expense 41229.0 57824.0 72870.0 83805.5 81815.4 80845.0 79874.7 78904.3 77934.0 77222.1 76768.8 76315.5
Fund expense 26214.0 25507.0 33829.0 33829.0 33829.0 33829.0 33829.0 33829.0 33829.0 33829.0 33829.0 33829.0
Nonoperating income / (loss) - REPORTED 501994.0 212751.0 256145.0
Nonoperating income / (loss) - PRO FORMA 501994.0 212751.0 256145.0 256145.0 256145.0 256145.0 256145.0 256145.0 256145.0 256145.0 256145.0 256145.0
Pretax income - EBT (522654.0) 77258.0 1014905.0 1278666.2 1512107.9 1595374.7 1683579.3 1777017.9 1876004.6 1980613.8 2091198.4 2208390.8
Taxes - REPORTED 84669.0 345711.0 185023.0
Taxes - PRO FORMA 84669.0 345711.0 185023.0 233108.2 275665.9 290846.0 306926.2 323960.6 342006.4 361077.3 381237.5 402602.3
Net Income (607323.0) (268453.0) 829882.0 1045558.0 1236442.0 1304528.7 1376653.1 1453057.4 1533998.2 1619536.6 1709960.9 1805788.5
Net Income Attributable to Redeemable Non-Controlling Interests in Consolidated Entities87651.0 (24869.0) 103598.0 111885.8 120277.3 128696.7 137062.0 145285.7 154002.8 163243.0 173037.6 183419.8
Net Income Attributable to Non-Controlling Interests in Consolidated Entities343498.0 7953.0 99959.0 107955.7 116052.4 124176.1 132247.5 140182.4 148593.3 157508.9 166959.4 176977.0
Net Income Attributable to Non-Controlling Interests in Blackstone Holdings(668444.0) (83234.0) 407727.0 440345.2 473371.0 506507.0 539430.0 571795.8 606103.5 642469.7 681017.9 721879.0
Minority interest expense, after tax (enter as - ) 0.0 0.0 0.0 0.0 0.0 0.0 0.0 0.0 0.0 0.0 0.0 0.0
Net Income (Loss) Attributable to The Blackstone Group L.P.(370028.0) (168303.0) 218598.0 385371.3 526741.2 545149.0 567913.7 595793.5 625298.6 656314.9 688946.0 723512.6
Common dividends 599390.0 702832.0 614530.0 513854.8 519343.6 523877.5 527786.0 531155.5 534060.2 536564.2 538722.9 540583.8
Pro Forma EBITDA Reconciliation
EBT (522654.0) 77258.0 1014905.0 1278666.2 1512107.9 1595374.7 1683579.3 1777017.9 1876004.6 1980613.8 2091198.4 2208390.8
Economic Income 1580770.0 1584971.0 2041007.0 2688822.6 3234653.6 3428732.8 3634456.8 3852524.2 4083675.7 4328696.2 4588418.0 4863723.1
Economic Net Income 1551838.0 1539208.0 1995299.0 2628606.9 3162214.1 3351947.0 3553063.8 3766247.6 3992222.4 4231755.8 4485661.1 4754800.8
Fee Related Earnings 478171.0 546493.0 700313.0 922592.3 1109878.6 1176471.3 1247059.6 1321883.2 1401196.2 1485267.9 1574384.0 1668847.0
Distributable Earnings 701784.0 696724.0 1033925.0 1362092.8 1638597.6 1736913.5 1841128.3 1951596.0 2068691.8 2192813.3 2324382.1 2463845.0
Interest 36666.0 53201.0 69152.0 79529.5 77641.0 76720.1 75799.3 74878.4 73957.6 73282.1 72851.9 72421.7
Taxes and Related Payables Including Payable Under Tax Receivable Agreement48867.0 74696.0 132325.0 183198.9 229432.1 258090.8 273576.2 289990.8 307390.2 325833.6 345383.7 366106.7
EBIT 787317.0 824621.0 1235402.0 1624821.2 1945670.7 2071724.4 2190503.8 2316465.2 2450039.6 2591929.0 2742617.6 2902373.3
Depreciation & amortization 192007.0 253629.0 192383.0 179249.2 167076.6 157515.8 150024.2 144171.8 139618.3 136094.3 133386.2 131325.2
EBITDA 979324.0 1078250.0 1427785.0 1804070.4 2112747.2 2229240.2 2340527.9 2460637.0 2589657.9 2728023.2 2876003.8 3033698.5
Pro Forma Basic EPS Reconcilliation
Preferred dividends 0.0 0.0 0.0 0.0 0.0 0.0 0.0 0.0 0.0 0.0 0.0 0.0
Net income for basic EPS (370028.0) (168303.0) 218598.0 385371.3 526741.2 545149.0 567913.7 595793.5 625298.6 656314.9 688946.0 723512.6
Basic shares outstanding 364021.4 475582.7 533703.6 558537.8 564503.9 569432.0 573680.5 577342.9 580500.2 583222.0 585568.3 587591.1
Basic EPS (1.02) (0.35) 0.41 0.69 0.93 0.96 0.99 1.03 1.08 1.13 1.18 1.23
Pro Forma Diluted EPS Reconciliation
Adjustment to net income for diluted EPS calc. 0.0 0.0 0.0 0.0 0.0 0.0 0.0 0.0 0.0 0.0 0.0 0.0
Net income for diluted EPS (370028.0) (168303.0) 218598.0 385371.3 526741.2 545149.0 567913.7 595793.5 625298.6 656314.9 688946.0 723512.6
Stock options, restricted stock, and converts 0.0 0.0 4965.4 4965.4 4965.4 4965.4 4965.4 4965.4 4965.4 4965.4 4965.4 4965.4
Diluted shares outstanding 364021.4 475582.7 538669.0 563503.2 569469.3 574397.4 578645.9 582308.3 585465.6 588187.3 590533.7 592556.4
Diluted EPS ($1.02) ($0.35) $0.41 $0.68 $0.92 $0.95 $0.98 $1.02 $1.07 $1.12 $1.17 $1.22
Actual Projected Annual Forecast
Nonrecurring items
2
Firstcall consensus EPS $0.41 $0.59 $0.74 $0.86 $1.00 $1.16 $1.34 $1.55 $1.80 $2.09
Model variance from consensus ($0.00) $0.09 $0.18 $0.09 ($0.01) ($0.13) ($0.27) ($0.44) ($0.64) ($0.87)
Income statement assumptions
Revenue growth (%) 4.3% 23.6% 31.7% 20.3% 6.0% 6.0% 6.0% 6.0% 6.0% 6.0% 6.0%
Gross profit margin (%) (15.7%) 15.8% 35.2% 35.2% 35.2% 35.2% 35.2% 35.2% 35.2% 35.2% 35.2% 35.2%
SG&A and Other margin 15.0% 17.4% 13.7% 13.7% 13.7% 13.7% 13.7% 13.7% 13.7% 13.7% 13.7% 13.7%
EBIT margin (%) (30.7%) (1.6%) 21.5% 21.5% 21.5% 21.5% 21.5% 21.5% 21.5% 21.5% 21.5% 21.5%
Effective tax rate (%) (16.2%) 447.5% 18.2% 18.2% 18.2% 18.2% 18.2% 18.2% 18.2% 18.2% 18.2% 18.2%
D&A a % of depreciable assets (default) 20.8% 20.8% 20.8% 20.8% 20.8% 20.8% 20.8% 20.8% 20.8% 20.8%
Income in equity affiliates growth (%) (128.4%) (516.6%) 8.0% 7.5% 7.0% 6.5% 6.0% 6.0% 6.0% 6.0% 6.0%
Minority interest growth (%) 0.0% 0.0% 8.0% 7.5% 7.0% 6.5% 6.0% 6.0% 6.0% 6.0% 6.0%
Dividend payout ratio (162.0%) (417.6%) 281.1% 133.3% 98.6% 96.1% 92.9% 89.2% 85.4% 81.8% 78.2% 74.7%
Select a case (1=best, 2=base, 3=weak)
Balance Sheet
12/31/11 12/31/12 12/31/13 12/31/14 12/31/15 12/31/16 12/31/17 12/31/18 12/31/19 12/31/20 12/31/21
Cash and equivalents (inc. investment securities) 7,785,330 10,888,590 9,862,481.9 9,263,018.5 8,618,547.9 7,935,717.3 7,222,652.8 6,479,829.1 5,800,884.7 5,091,850.0 4,351,820.4
Accounts receivable 406,140 638,164 840,717.3 1,011,382.9 1,072,065.8 1,136,389.8 1,204,573.2 1,276,847.6 1,353,458.4 1,434,665.9 1,520,745.9
Deferred income taxes 1,258,699 1,285,611 1,619,725.4 1,915,433.0 2,020,909.6 2,132,641.0 2,251,002.6 2,376,392.1 2,508,903.7 2,648,984.5 2,797,435.7
Prepaid expenses 81,701.0 81,498.0 107,365.5 129,160.7 136,910.3 145,124.9 153,832.4 163,062.4 172,846.1 183,216.9 194,209.9
Other current assets 106,005 152,484 152,484.0 152,484.0 152,484.0 152,484.0 152,484.0 152,484.0 152,484.0 152,484.0 152,484.0
Equity in affiliates 8,961,960 12,320,611 12,980,797.7 13,690,498.4 14,449,878.2 15,258,617.7 16,115,881.5 17,024,581.2 17,987,802.8 19,008,817.7 20,091,093.6
Furniture, Equipment and Leasehold Improvements, net 149,690.0 142,390.0 98,481.5 71,870.1 58,547.6 58,448.7 47,838.0 51,820.3 69,370.1 99,675.4 138,232.9
Goodwill 1,703,602 1,703,602 1,703,602.0 1,703,602.0 1,703,602.0 1,703,602.0 1,703,602.0 1,703,602.0 1,703,602.0 1,703,602.0 1,703,602.0
Intangibles 595,488 598,535 583,579.0 563,872.4 540,815.4 512,407.8 500,749.7 479,441.0 448,481.8 407,872.2 361,472.2
Other non-current assets 860,514.0 1,120,067.0 1,120,067.0 1,120,067.0 1,120,067.0 1,120,067.0 1,120,067.0 1,120,067.0 1,120,067.0 1,120,067.0 1,120,067.0
Total Assets 21,909,129.0 28,931,552.0 29,069,301.2 29,621,389.0 29,873,827.8 30,155,500.2 30,472,683.1 30,828,126.5 31,317,900.7 31,851,235.5 32,431,163.5
Accounts payable 584,385 520,232 685,353.6 824,480.4 873,949.3 926,386.2 981,969.4 1,040,887.5 1,103,340.8 1,169,541.2 1,239,713.7
Accrued expenses 903,260 1,254,978 1,653,308.0 1,988,929.5 2,108,265.3 2,234,761.2 2,368,846.9 2,510,977.7 2,661,636.4 2,821,334.6 2,990,614.6
Other current liabilities (non-debt) 244,345.0 467,435.0 467,435.0 467,435.0 467,435.0 467,435.0 467,435.0 467,435.0 467,435.0 467,435.0 467,435.0
Current portion of long-term debt 125,380.0 175,425.7 175,425.7 175,425.7 175,425.7 175,425.7 175,425.7 81,954.0 81,954.0 81,954.0 41,954.0
Short term debt (Revolving credit facility) 245,674.0 368,691.0 0.0 0.0 0.0 0.0 0.0 0.0 0.0 0.0 0.0
Long term debt 10,553,656.0 14,878,622.3 14,703,196.6 14,527,770.9 14,352,345.2 14,176,919.5 14,001,493.8 13,919,539.8 13,837,585.8 13,755,631.8 13,713,677.8
Convertible debt 0 0 0.0 0.0 0.0 0.0 0.0 0.0 0.0 0.0 0.0
Deferred income taxes 143.0 51,221.0 64,532.7 76,314.2 80,516.6 84,968.2 89,683.9 94,679.6 99,959.1 105,540.2 111,454.8
Other non-current liabilities 0 0 0.0 0.0 0.0 0.0 0.0 0.0 0.0 0.0 0.0
Total Liabilities 12,656,843.0 17,716,605.0 17,749,251.7 18,060,355.8 18,057,937.1 18,065,895.8 18,084,854.7 18,115,473.7 18,251,911.1 18,401,436.8 18,564,849.9
Redeemable Non-Controlling Interests in Consolidated Entities 1,091,833.0 1,556,185.0 1,556,185.0 1,556,185.0 1,556,185.0 1,556,185.0 1,556,185.0 1,556,185.0 1,556,185.0 1,556,185.0 1,556,185.0
Minority interest 0.0 0.0 0.0 0.0 0.0 0.0 0.0 0.0 0.0 0.0 0.0
Convertible Preferred Stock 0.0 0.0 0.0 0.0 0.0 0.0 0.0 0.0 0.0 0.0 0.0
Common Stock and APIC 4,668,705.0 5,464,677.0 5,699,463.0 5,934,249.0 6,169,035.0 6,403,821.0 6,638,607.0 6,873,393.0 7,108,179.0 7,342,965.0 7,577,751.0
Treasury stock (contra account) 0.0 0.0 (1,200.0) (2,400.0) (3,600.0) (4,800.0) (6,000.0) (7,200.0) (8,400.0) (9,600.0) (10,800.0)
Comprehensive (accumulated) loss 1,958.0 2,170.0 2,170.0 2,170.0 2,170.0 2,170.0 2,170.0 2,170.0 2,170.0 2,170.0 2,170.0
Non-Controlling Interests in Consolidated Entities 1,029,270.0 1,443,559.0 1,443,559.0 1,443,559.0 1,443,559.0 1,443,559.0 1,443,559.0 1,443,559.0 1,443,559.0 1,443,559.0 1,443,559.0
Non-Controlling Interests in Blackstone Holdings 2,460,520.0 2,748,356.0 2,748,356.0 2,748,356.0 2,748,356.0 2,748,356.0 2,748,356.0 2,748,356.0 2,748,356.0 2,748,356.0 2,748,356.0
Retained earnings 0.0 0.0 (128,483.4) (121,085.8) (99,814.3) (59,686.6) 4,951.4 96,189.8 215,940.6 366,163.7 549,092.6
Total Shareholders' Equity 8,160,453.0 9,658,762.0 9,763,864.6 10,004,848.2 10,259,705.7 10,533,419.4 10,831,643.4 11,156,467.8 11,509,804.6 11,893,613.7 12,310,128.6
Total Liabilities + Shareholders' Equity 21,909,129.0 28,931,552.0 29,069,301.2 29,621,389.0 29,873,827.8 30,155,500.2 30,472,683.1 30,828,126.5 31,317,900.7 31,851,235.5 32,431,163.5
Balance check 0.0 0.0 0.0 0.0 0.0 0.0 0.0 0.0 0.0 0.0 0.0
Supporting Schedules
12/31/11 12/31/12 12/31/13 12/31/14 12/31/15 12/31/16 12/31/17 12/31/18 12/31/19 12/31/20 12/31/21
Working Capital
1. Grow with revenues (default)
2. Override i: Days of revenues (Avg. collection period) 45.6 58.1
3. Overide ii: Absolute projection
Accounts receivable 406,140.0 638,164.0 840,717.3 1,011,382.9 1,072,065.8 1,136,389.8 1,204,573.2 1,276,847.6 1,353,458.4 1,434,665.9 1,520,745.9
1. Grow with SG&A (default)
2. Overide: Absolute projection
Prepaid expenses 81,701.0 81,498.0 107,365.5 129,160.7 136,910.3 145,124.9 153,832.4 163,062.4 172,846.1 183,216.9 194,209.9
1. Straight-line (default)
2. Overide: Absolute projection
Other current assets 106,005.0 152,484.0 152,484.0 152,484.0 152,484.0 152,484.0 152,484.0 152,484.0 152,484.0 152,484.0 152,484.0
1. Grow with COGS (default)
2. Override i. Payables Payment Period 77.9 73.1
3. Overide ii: Absolute projection
Accounts payable 584,385.0 520,232.0 685,353.6 824,480.4 873,949.3 926,386.2 981,969.4 1,040,887.5 1,103,340.8 1,169,541.2 1,239,713.7
1. Grow with SG&A (default)
2. Overide: Absolute projection
Accrued expenses 903,260.0 1,254,978.0 1,653,308.0 1,988,929.5 2,108,265.3 2,234,761.2 2,368,846.9 2,510,977.7 2,661,636.4 2,821,334.6 2,990,614.6
1. Straight-line (default)
2. Overide: Absolute projection
Other current liabilities (non-debt) 244,345.0 467,435.0 467,435.0 467,435.0 467,435.0 467,435.0 467,435.0 467,435.0 467,435.0 467,435.0 467,435.0
Intangible assets
Purchase of intangible assets 23,768.0 142,221.0 82,994.5 82,994.5 82,994.5 82,994.5 82,994.5 82,994.5 82,994.5 82,994.5 82,994.5
Amortization (enter as -) (207,591.0) (139,174.0) (97,950.5) (102,701.0) (106,051.6) (111,402.1) (94,652.6) (104,303.1) (113,953.7) (123,604.2) (129,394.5)
Intangibles 595,488.0 598,535.0 583,579.0 563,872.4 540,815.4 512,407.8 500,749.7 479,441.0 448,481.8 407,872.2 361,472.2
Furniture, Equipment and Leasehold Improvements
Capital expenditures 36,484.0 37,020.0 37,390.2 37,764.1 38,141.7 38,523.2 38,908.4 39,297.5 39,690.5 40,087.4 40,488.2
Recurring asset sales (enter as -) 0.0 0.0 0.0 0.0 0.0 0.0 0.0 0.0 0.0
Depreciation (46,038.0) (53,209.0) (81,298.7) (64,375.5) (51,464.2) (38,622.1) (49,519.2) (35,315.2) (22,140.6) (9,782.0) (1,930.7)
PP&E 149,690.0 142,390.0 98,481.5 71,870.1 58,547.6 58,448.7 47,838.0 51,820.3 69,370.1 99,675.4 138,232.9
Diluted Shares outstanding
Treasury share $ repurchases (2,100.0) 0.0 (1,200.0) (1,200.0) (1,200.0) (1,200.0) (1,200.0) (1,200.0) (1,200.0) (1,200.0) (1,200.0)
Value of shares issued 238,632.0 234,786.0 234,786.0 234,786.0 234,786.0 234,786.0 234,786.0 234,786.0 234,786.0 234,786.0 234,786.0
Expected average share price $24.45 $35.18 $44.13 $51.19 $59.38 $68.88 $79.90 $92.69 $107.52 $124.72
Consensus EPS growth 43.9% 25.4% 16.0% 16.0% 16.0% 16.0% 16.0% 16.0% 16.0%
Shares repurchased (34.1) (27.2) (23.4) (20.2) (17.4) (15.0) (12.9) (11.2) (9.6)
Shares issued 6,673.1 5,320.4 4,586.6 3,953.9 3,408.6 2,938.4 2,533.1 2,183.7 1,882.5
End of period basic shares outstanding 555,218.3 561,857.3 567,150.5 571,713.6 575,647.3 579,038.5 581,961.9 584,482.0 586,654.6 588,527.5
Weighted average basic shares outstanding 475,582.7 533,703.6 558,537.8 564,503.9 569,432.0 573,680.5 577,342.9 580,500.2 583,222.0 585,568.3 587,591.1
Investments in affiliates (Equity method)
Equity in income of affiliates 660,186.7 709,700.7 759,379.8 808,739.5 857,263.8 908,699.7 963,221.6 1,021,014.9 1,082,275.8
Dividends (enter as -)
Equity in affiliates (from balance sheet) 8,961,960.0 12,320,611.0 12,980,797.7 13,690,498.4 14,449,878.2 15,258,617.7 16,115,881.5 17,024,581.2 17,987,802.8 19,008,817.7 20,091,093.6
Minority interest (Consolidation method)
Minority interest expense 0.0 0.0 0.0 0.0 0.0 0.0 0.0 0.0 0.0
Dividends (enter as -)
Minority interest (from balance sheet) 0.0 0.0 0.0 0.0 0.0 0.0 0.0 0.0 0.0 0.0 0.0
Cash Flow Statement
12/31/13 12/31/14 12/31/15 12/31/16 12/31/17 12/31/18 12/31/19 12/31/20 12/31/21
Net Income 385,371.3 526,741.2 545,149.0 567,913.7 595,793.5 625,298.6 656,314.9 688,946.0 723,512.6
Depreciation & amortization 179,249.2 167,076.6 157,515.8 150,024.2 144,171.8 139,618.3 136,094.3 133,386.2 131,325.2
Changes in working capital
Accounts receivable (202,553.3) (170,665.6) (60,683.0) (64,323.9) (68,183.4) (72,274.4) (76,610.9) (81,207.5) (86,080.0)
Deferred tax assets (334,114.4) (295,707.7) (105,476.6) (111,731.4) (118,361.6) (125,389.5) (132,511.7) (140,080.8) (148,451.2)
Prepaid expenses (25,867.5) (21,795.2) (7,749.6) (8,214.6) (8,707.5) (9,229.9) (9,783.7) (10,370.8) (10,993.0)
Other current assets 0.0 0.0 0.0 0.0 0.0 0.0 0.0 0.0 0.0
Accounts payable 165,121.6 139,126.8 49,468.8 52,437.0 55,583.2 58,918.2 62,453.3 66,200.4 70,172.5
Accrued expenses 398,330.0 335,621.5 119,335.8 126,495.9 134,085.7 142,130.8 150,658.7 159,698.2 169,280.1
Other current liabilities 0.0 0.0 0.0 0.0 0.0 0.0 0.0 0.0 0.0
Deferred tax liabilities 13,311.7 11,781.5 4,202.4 4,451.6 4,715.7 4,995.7 5,279.5 5,581.1 5,914.6
Equity income in affiliates (660,186.7) (709,700.7) (759,379.8) (808,739.5) (857,263.8) (908,699.7) (963,221.6) (1,021,014.9) (1,082,275.8)
Dividends received from affiliates 0.0 0.0 0.0 0.0 0.0 0.0 0.0 0.0 0.0
Minority interest expense 0.0 0.0 0.0 0.0 0.0 0.0 0.0 0.0 0.0
Cash from operations (81,337.9) (17,521.5) (57,617.2) (91,687.2) (118,166.4) (144,631.9) (171,327.2) (198,862.1) (227,595.0)
Purchase of fixed assets (capital expenditures) (37,390.2) (37,764.1) (38,141.7) (38,523.2) (38,908.4) (39,297.5) (39,690.5) (40,087.4) (40,488.2)
Proceeds from sale of fixed assets 0.0 0.0 0.0 0.0 0.0 0.0 0.0 0.0 0.0
Purchases of intangible assets (82,994.5) (82,994.5) (82,994.5) (82,994.5) (82,994.5) (82,994.5) (82,994.5) (82,994.5) (82,994.5)
Purchases/Proceeds from other long-term assets 0.0 0.0 0.0 0.0 0.0 0.0 0.0 0.0 0.0
Cash from investing (120,384.7) (120,758.6) (121,136.2) (121,517.7) (121,902.9) (122,292.0) (122,685.0) (123,081.9) (123,482.7)
Convertible preferred stock 0.0 0.0 0.0 0.0 0.0 0.0 0.0 0.0 0.0
Common stock and APIC 234,786.0 234,786.0 234,786.0 234,786.0 234,786.0 234,786.0 234,786.0 234,786.0 234,786.0
Treasury stock repurchases (1,200.0) (1,200.0) (1,200.0) (1,200.0) (1,200.0) (1,200.0) (1,200.0) (1,200.0) (1,200.0)
Comprehensive accumulated loss 0.0 0.0 0.0 0.0 0.0 0.0 0.0 0.0 0.0
Other equity account 0.0 0.0 0.0 0.0 0.0 0.0 0.0 0.0 0.0
Common and preferred dividends (513,854.8) (519,343.6) (523,877.5) (527,786.0) (531,155.5) (534,060.2) (536,564.2) (538,722.9) (540,583.8)
Dividends to minority interests 0.0 0.0 0.0 0.0 0.0 0.0 0.0 0.0 0.0
Increases / (decreases) in debt (544,116.7) (175,425.7) (175,425.7) (175,425.7) (175,425.7) (175,425.7) (81,954.0) (81,954.0) (81,954.0)
Cash from financing (824,385.5) (461,183.3) (465,717.2) (469,625.7) (472,995.2) (475,899.9) (384,932.2) (387,090.9) (388,951.8)
Total increase/decrease of cash (1,026,108.1) (599,463.4) (644,470.6) (682,830.6) (713,064.4) (742,823.7) (678,944.4) (709,034.8) (740,029.5)
Debt
Current portion of LTD 125,380.0 175,425.7 175,425.7 175,425.7 175,425.7 175,425.7 175,425.7 81954.0 81954.0 81954.0 41954.0
Reclassification of LTD to CP of LTD (175,425.7) (175,425.7) (175,425.7) (175,425.7) (175,425.7) (81,954.0) (81,954.0) (81,954.0) (41,954.0)
Discretionary (paydown)/borrowing of long term debt
Long term debt 10,553,656.0 14,878,622.3 14,703,196.6 14,527,770.9 14,352,345.2 14,176,919.5 14,001,493.8 13,919,539.8 13,837,585.8 13,755,631.8 13,713,677.8
Discretionary (paydown)/borrowing of convertible debt
Convertible debt 0.0 0.0 0.0 0.0 0.0 0.0 0.0 0.0 0.0 0.0 0.0
Calculation of short term debt
Cash @ beginning of the year (end of last year) 10,888,590.0 9,862,481.9 9,263,018.5 8,618,547.9 7,935,717.3 7,222,652.8 6,479,829.1 5,800,884.7 5,091,850.0
Plus: Free cash flows prior to debt during year avg. of (revenue / cash) (481,991.4) (424,037.7) (469,044.9) (507,404.9) (537,638.7) (567,398.0) (596,990.4) (627,080.8) (658,075.5)
Less: Minimum cash balance 20.0% 1,059,042.3 1,274,027.9 1,350,469.6 1,431,497.8 1,517,387.6 1,608,430.9 1,704,936.7 1,807,232.9 1,915,666.9
Total cash available / (debt required) for short term debt paydown 9,172,130.6 7,988,990.6 7,268,078.3 6,504,219.5 5,705,265.2 4,871,398.3 4,095,948.0 3,284,617.0 2,436,153.5
Short term debt 245,674.0 368,691.0 0.0 0.0 0.0 0.0 0.0 0.0 0.0 0.0 0.0
Interest expense
Current portion of long-term debt 125,380.0 175,425.7 175,425.7 175,425.7 175,425.7 175,425.7 175,425.7 81,954.0 81,954.0 81,954.0 41,954.0
Short term debt 245,674.0 368,691.0 0.0 0.0 0.0 0.0 0.0 0.0 0.0 0.0 0.0
Long term debt 10,553,656.0 14,878,622.3 14,703,196.6 14,527,770.9 14,352,345.2 14,176,919.5 14,001,493.8 13,919,539.8 13,837,585.8 13,755,631.8 13,713,677.8
Convertible debt 0.0 0.0 0.0 0.0 0.0 0.0 0.0 0.0 0.0 0.0 0.0
Total debt 10,924,710.0 15,422,739.0 14,878,622.3 14,703,196.6 14,527,770.9 14,352,345.2 14,176,919.5 14,001,493.8 13,919,539.8 13,837,585.8 13,755,631.8
Interest expense 57,824.0 72,870.0 83,805.5 81,815.4 80,845.0 79,874.7 78,904.3 77,934.0 77,222.1 76,768.8 76,315.5
Average interest rate 0.6% 0.6% 0.6% 0.6% 0.6% 0.6% 0.6% 0.6% 0.6% 0.6%
Ratio analysis
12/31/13 12/31/14 12/31/15 12/31/16 12/31/17 12/31/18 12/31/19 12/31/20 12/31/21
Capital Structure
Market Debt / Equity 75.0% 58.5% 49.4% 41.8% 35.3% 29.9% 25.5% 21.8% 18.6%
Financial Risk Ratios
EBITDA / Total Interest 21.5x 25.8x 27.6x 29.3x 31.2x 33.2x 35.3x 37.5x 39.8x
(EBITDA - Capex) / Total Interest 21.1x 25.4x 27.1x 28.8x 30.7x 32.7x 34.8x 36.9x 39.2x
Total Debt / EBITDA 8.2x 7.0x 6.5x 6.1x 5.8x 5.4x 5.1x 4.8x 4.5x
Total Debt / Total Capitalization (Bk. Equity) 60.4% 59.5% 58.6% 57.7% 56.7% 55.7% 54.7% 53.8% 52.8%
Net Debt / EBITDA 2.8x 2.6x 2.7x 2.7x 2.8x 2.9x 3.0x 3.0x 3.1x
Interest Coverage (EBIT/Interest expense) 13.6x 16.8x 18.0x 19.3x 20.7x 22.2x 23.8x 25.3x 27.0x
Internal Liquidity
Current Ratio (Curr. Assets / Curr. Liab.) 4.5x 3.8x 3.5x 3.2x 2.9x 2.6x 2.4x 2.1x 1.9x
Cash Ratio (Cash / Current Liab.) 3.5x 2.8x 2.5x 2.2x 1.9x 1.6x 1.4x 1.1x 0.9x
Operating Efficiency
Return on Capital (ROIC) 4.2% 5.0% 5.3% 5.5% 5.8% 6.1% 6.4% 6.7% 7.0%
Dupont Analysis
Operating Profit Margin 21.5% 21.5% 21.5% 21.5% 21.5% 21.5% 21.5% 21.5% 21.5%
Asset Turnover (Sales/ Assets) 0.2x 0.2x 0.2x 0.2x 0.2x 0.3x 0.3x 0.3x 0.3x
Interest (inc. interest income)/ Sales 1.6% 1.3% 1.2% 1.1% 1.0% 1.0% 0.9% 0.8% 0.8%
Equity multiplier (Assets / Equity) 3.0x 3.0x 2.9x 2.9x 2.8x 2.8x 2.7x 2.7x 2.6x
Tax Retention Rate 81.8% 81.8% 81.8% 81.8% 81.8% 81.8% 81.8% 81.8% 81.8%
ROE 5.7% 8.1% 8.7% 9.4% 9.9% 10.5% 11.0% 11.5% 12.0%
Operating scenarios - sensitivity analysis
Revenue growth (%)
Strong case 1 32.7% 21.3% 7.0% 7.0% 7.0% 7.0% 7.0% 7.0% 7.0%
Base case 2 31.7% 20.3% 6.0% 6.0% 6.0% 6.0% 6.0% 6.0% 6.0%
Weak case 3 30.7% 19.3% 5.0% 5.0% 5.0% 5.0% 5.0% 5.0% 5.0%
Gross Profit margin (%)
Strong case 1 35.7% 35.7% 35.7% 35.7% 35.7% 35.7% 35.7% 35.7% 35.7%
Base case 2 35.2% 35.2% 35.2% 35.2% 35.2% 35.2% 35.2% 35.2% 35.2%
Weak case 3 34.7% 34.7% 34.7% 34.7% 34.7% 34.7% 34.7% 34.7% 34.7%
SG&A and Other margin (%)
Strong case 1 12.7% 12.7% 12.7% 12.7% 12.7% 12.7% 12.7% 12.7% 12.7%
Base case 2 13.7% 13.7% 13.7% 13.7% 13.7% 13.7% 13.7% 13.7% 13.7%
Weak case 3 14.7% 14.7% 14.7% 14.7% 14.7% 14.7% 14.7% 14.7% 14.7%
Taxes
1. Straight line (default) 18.2% 18.2% 18.2% 18.2% 18.2% 18.2% 18.2% 18.2% 18.2%
2. Override i. Use marginal tax rate
3. Overide ii: Absolute projection
Capex as a % of revenues
Strong case 1 1.5% 1.5% 1.5% 1.5% 1.5% 1.5% 1.5% 1.5% 1.5%
Base case 2 1.0% 1.0% 1.0% 1.0% 1.0% 1.0% 1.0% 1.0% 1.0%
Weak case 3 0.5% 0.5% 0.5% 0.5% 0.5% 0.5% 0.5% 0.5% 0.5%
Income in equity affiliates growth (%)
Strong case 1 10.0% 9.5% 9.0% 8.5% 8.0% 8.0% 8.0% 8.0% 8.0%
Base case 2 8.0% 7.5% 7.0% 6.5% 6.0% 6.0% 6.0% 6.0% 6.0%
Weak case 3 6.0% 5.5% 5.0% 4.5% 4.0% 4.0% 4.0% 4.0% 4.0%
Minority interest growth (%)
Strong case 1 10.0% 9.5% 9.0% 8.5% 8.0% 8.0% 8.0% 8.0% 8.0%
Base case 2 8.0% 7.5% 7.0% 6.5% 6.0% 6.0% 6.0% 6.0% 6.0%
Weak case 3 6.0% 5.5% 5.0% 4.5% 4.0% 4.0% 4.0% 4.0% 4.0%
Data tables
Display 2013 EPS based on various revenue growth assumptions (column) and gross profit margin assumptions (row)
2013 gross profit margin
$0.68 33.2% 34.2% 35.2% 36.2% 37.2%
33.7% 0.68 0.68 0.68 0.68 0.68
32.7% 0.68 0.68 0.68 0.68 0.68
2013 Revenue growth range 31.7% 0.68 0.68 0.68 0.68 0.68
30.7% 0.68 0.68 0.68 0.68 0.68
29.7% 0.68 0.68 0.68 0.68 0.68
28.7% 0.68 0.68 0.68 0.68 0.68

More Related Content

What's hot

Best Buy Audit Plan (4.20.15)
Best Buy Audit Plan (4.20.15)Best Buy Audit Plan (4.20.15)
Best Buy Audit Plan (4.20.15)Richard Johnson
 
Topic 10 Financial Statement Analysis
Topic 10 Financial Statement AnalysisTopic 10 Financial Statement Analysis
Topic 10 Financial Statement Analysisguest441011
 
Conta minjangos
Conta minjangosConta minjangos
Conta minjangosDaucus
 
regions 1Q 08 SUPP
regions 1Q 08 SUPPregions 1Q 08 SUPP
regions 1Q 08 SUPPfinance25
 
Financial Annual Report Common Size
Financial Annual Report Common SizeFinancial Annual Report Common Size
Financial Annual Report Common SizeTaylor Wiley
 
Digital realty 2017 investor day
Digital realty 2017 investor dayDigital realty 2017 investor day
Digital realty 2017 investor dayir_digitalrealty
 
Financial_analysis_CTc
Financial_analysis_CTcFinancial_analysis_CTc
Financial_analysis_CTcJan Zika
 
danaher 04-2Q-REL
danaher 04-2Q-RELdanaher 04-2Q-REL
danaher 04-2Q-RELfinance24
 
u.s.bancorp 4Q 2005 Business Line Schedules
u.s.bancorp 4Q 2005 Business Line Schedules u.s.bancorp 4Q 2005 Business Line Schedules
u.s.bancorp 4Q 2005 Business Line Schedules finance13
 
Financial Forecasting
Financial ForecastingFinancial Forecasting
Financial ForecastingTravonnLee
 
4th Qtr 2009 Press Release
4th Qtr 2009 Press Release4th Qtr 2009 Press Release
4th Qtr 2009 Press Releasemidwesco
 
Ccal 2 q13_ing
Ccal 2 q13_ingCcal 2 q13_ing
Ccal 2 q13_ingItauRI
 

What's hot (14)

Best Buy Audit Plan (4.20.15)
Best Buy Audit Plan (4.20.15)Best Buy Audit Plan (4.20.15)
Best Buy Audit Plan (4.20.15)
 
Topic 10 Financial Statement Analysis
Topic 10 Financial Statement AnalysisTopic 10 Financial Statement Analysis
Topic 10 Financial Statement Analysis
 
Conta minjangos
Conta minjangosConta minjangos
Conta minjangos
 
regions 1Q 08 SUPP
regions 1Q 08 SUPPregions 1Q 08 SUPP
regions 1Q 08 SUPP
 
Financial Annual Report Common Size
Financial Annual Report Common SizeFinancial Annual Report Common Size
Financial Annual Report Common Size
 
Digital realty 2017 investor day
Digital realty 2017 investor dayDigital realty 2017 investor day
Digital realty 2017 investor day
 
itw_041019
itw_041019itw_041019
itw_041019
 
Financial_analysis_CTc
Financial_analysis_CTcFinancial_analysis_CTc
Financial_analysis_CTc
 
CF Project
CF ProjectCF Project
CF Project
 
danaher 04-2Q-REL
danaher 04-2Q-RELdanaher 04-2Q-REL
danaher 04-2Q-REL
 
u.s.bancorp 4Q 2005 Business Line Schedules
u.s.bancorp 4Q 2005 Business Line Schedules u.s.bancorp 4Q 2005 Business Line Schedules
u.s.bancorp 4Q 2005 Business Line Schedules
 
Financial Forecasting
Financial ForecastingFinancial Forecasting
Financial Forecasting
 
4th Qtr 2009 Press Release
4th Qtr 2009 Press Release4th Qtr 2009 Press Release
4th Qtr 2009 Press Release
 
Ccal 2 q13_ing
Ccal 2 q13_ingCcal 2 q13_ing
Ccal 2 q13_ing
 

Similar to Three statements model on BX

alltel 4q05supplement
alltel  4q05supplementalltel  4q05supplement
alltel 4q05supplementfinance27
 
alltel 2Q06_Supplement
alltel  2Q06_Supplementalltel  2Q06_Supplement
alltel 2Q06_Supplementfinance27
 
nationwide 1Q07 Statistical Supplement
nationwide 	1Q07 Statistical Supplementnationwide 	1Q07 Statistical Supplement
nationwide 1Q07 Statistical Supplementfinance11
 
Wassim Zhani Kroger Value.pdf
Wassim Zhani Kroger Value.pdfWassim Zhani Kroger Value.pdf
Wassim Zhani Kroger Value.pdfWassim Zhani
 
nationwide 4Q06 Statistical Supplement
nationwide 4Q06 Statistical Supplementnationwide 4Q06 Statistical Supplement
nationwide 4Q06 Statistical Supplementfinance11
 
Example Presentation Of Financial Reports Powerpoint Presentation Slides
Example Presentation Of Financial Reports Powerpoint Presentation SlidesExample Presentation Of Financial Reports Powerpoint Presentation Slides
Example Presentation Of Financial Reports Powerpoint Presentation SlidesSlideTeam
 
dover Release_3Q07_18442
dover Release_3Q07_18442dover Release_3Q07_18442
dover Release_3Q07_18442finance30
 
Third Quarter of Fiscal Year Ending March 2021 (FY2020) Financial Highlights
Third Quarter of Fiscal Year Ending March 2021 (FY2020) Financial HighlightsThird Quarter of Fiscal Year Ending March 2021 (FY2020) Financial Highlights
Third Quarter of Fiscal Year Ending March 2021 (FY2020) Financial HighlightsRicohLease
 
Conference Call 3Q16
Conference Call 3Q16Conference Call 3Q16
Conference Call 3Q16ItauRI
 
Financials1 P
Financials1 PFinancials1 P
Financials1 Pemronly
 
Williams sonoma model
Williams sonoma model Williams sonoma model
Williams sonoma model Trishala Rasya
 
Example Presentation Of Financial Reports PowerPoint Presentation Slides
Example Presentation Of Financial Reports PowerPoint Presentation Slides Example Presentation Of Financial Reports PowerPoint Presentation Slides
Example Presentation Of Financial Reports PowerPoint Presentation Slides SlideTeam
 

Similar to Three statements model on BX (20)

alltel 4q05supplement
alltel  4q05supplementalltel  4q05supplement
alltel 4q05supplement
 
alltel 2Q06_Supplement
alltel  2Q06_Supplementalltel  2Q06_Supplement
alltel 2Q06_Supplement
 
Hansson
HanssonHansson
Hansson
 
nationwide 1Q07 Statistical Supplement
nationwide 	1Q07 Statistical Supplementnationwide 	1Q07 Statistical Supplement
nationwide 1Q07 Statistical Supplement
 
Excel Model of Trading Firm
Excel Model of Trading FirmExcel Model of Trading Firm
Excel Model of Trading Firm
 
Profit and loss
Profit and lossProfit and loss
Profit and loss
 
Wassim Zhani Kroger Value.pdf
Wassim Zhani Kroger Value.pdfWassim Zhani Kroger Value.pdf
Wassim Zhani Kroger Value.pdf
 
Example print out-efm-de
Example print out-efm-deExample print out-efm-de
Example print out-efm-de
 
Third Quarter 2006 Earnings Presentation
Third Quarter 2006 Earnings PresentationThird Quarter 2006 Earnings Presentation
Third Quarter 2006 Earnings Presentation
 
nationwide 4Q06 Statistical Supplement
nationwide 4Q06 Statistical Supplementnationwide 4Q06 Statistical Supplement
nationwide 4Q06 Statistical Supplement
 
Example Presentation Of Financial Reports Powerpoint Presentation Slides
Example Presentation Of Financial Reports Powerpoint Presentation SlidesExample Presentation Of Financial Reports Powerpoint Presentation Slides
Example Presentation Of Financial Reports Powerpoint Presentation Slides
 
dover Release_3Q07_18442
dover Release_3Q07_18442dover Release_3Q07_18442
dover Release_3Q07_18442
 
Third Quarter of Fiscal Year Ending March 2021 (FY2020) Financial Highlights
Third Quarter of Fiscal Year Ending March 2021 (FY2020) Financial HighlightsThird Quarter of Fiscal Year Ending March 2021 (FY2020) Financial Highlights
Third Quarter of Fiscal Year Ending March 2021 (FY2020) Financial Highlights
 
Conference Call 3Q16
Conference Call 3Q16Conference Call 3Q16
Conference Call 3Q16
 
2 q08erf supplement
2 q08erf supplement2 q08erf supplement
2 q08erf supplement
 
CBO's Current Revenue Forecast
CBO's Current Revenue ForecastCBO's Current Revenue Forecast
CBO's Current Revenue Forecast
 
bKash equity valuation 2018
bKash equity valuation 2018bKash equity valuation 2018
bKash equity valuation 2018
 
Financials1 P
Financials1 PFinancials1 P
Financials1 P
 
Williams sonoma model
Williams sonoma model Williams sonoma model
Williams sonoma model
 
Example Presentation Of Financial Reports PowerPoint Presentation Slides
Example Presentation Of Financial Reports PowerPoint Presentation Slides Example Presentation Of Financial Reports PowerPoint Presentation Slides
Example Presentation Of Financial Reports PowerPoint Presentation Slides
 

Three statements model on BX

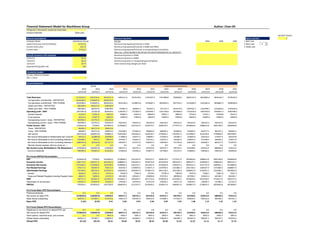
  • 1. Financial Statement Model for BlackStone Group Author: Chan Oh All figures in thousands, except per share data Scenario selected: Base case DO NOT TOUCH General assuamptions Select scenario 2 Company Name BlackStone Group Pre-tax 2004 2005 2006 1 Best case Latest Fiscal year end (mm/dd/yy) 12/31/12 Nonrecurring expense/(income) in COGS 2 Base case Current share price $22.23 Nonrecurring expense/(income) in SG&A and Other 3 Weak case Current date 9/16/13 Nonrecurring expense/(income) in nonoperating (income)/loss After-tax - LEAVE BLANK IF NO AFTER-TAX DATA PROVIDED BY CO. EXPLICITLY Firstcall Consensus EPS estimates Nonrecurring items in COGS 12/31/12 $0.41 Nonrecurring items in SG&A 12/31/13 $0.59 Nonrecurring items in nonoperating (income)/loss 12/31/14 $0.74 Total nonrecurring charges per share Expected EPS growth rate 16% Circularity breaker Circular reference breaker Off=1, On=0 1 Income Statement 2010 2011 2012 2013 2014 2015 2016 2017 2018 2019 2020 2021 12/31/10 12/31/11 12/31/12 12/31/13 12/31/14 12/31/15 12/31/16 12/31/17 12/31/18 12/31/19 12/31/20 12/31/21 Total Revenues 3119342.0 3252576.0 4019441.0 5295211.6 6370139.5 6752347.9 7157488.8 7586938.1 8042154.4 8524683.6 9036164.7 9578334.5 Compensation and Benefits - REPORTED 3610189.0 2738425.0 2605244.0 Compensation and Benefits - PRO FORMA 3610189.0 2738425.0 2605244.0 3432148.4 4128874.6 4376607.1 4639203.5 4917555.7 5212609.0 5525365.6 5856887.5 6208300.8 SG&A and Other - REPORTED 466358.0 566313.0 548738.0 SG&A and Other - PRO FORMA 466358.0 566313.0 548738.0 722907.4 869657.7 921837.1 977147.3 1035776.2 1097922.7 1163798.1 1233626.0 1307643.6 Operating profit - EBIT (957205.0) (52162.0) 865459.0 1140155.7 1371607.3 1453903.7 1541138.0 1633606.2 1731622.6 1835520.0 1945651.2 2062390.2 Interest expense 41229.0 57824.0 72870.0 83805.5 81815.4 80845.0 79874.7 78904.3 77934.0 77222.1 76768.8 76315.5 Fund expense 26214.0 25507.0 33829.0 33829.0 33829.0 33829.0 33829.0 33829.0 33829.0 33829.0 33829.0 33829.0 Nonoperating income / (loss) - REPORTED 501994.0 212751.0 256145.0 Nonoperating income / (loss) - PRO FORMA 501994.0 212751.0 256145.0 256145.0 256145.0 256145.0 256145.0 256145.0 256145.0 256145.0 256145.0 256145.0 Pretax income - EBT (522654.0) 77258.0 1014905.0 1278666.2 1512107.9 1595374.7 1683579.3 1777017.9 1876004.6 1980613.8 2091198.4 2208390.8 Taxes - REPORTED 84669.0 345711.0 185023.0 Taxes - PRO FORMA 84669.0 345711.0 185023.0 233108.2 275665.9 290846.0 306926.2 323960.6 342006.4 361077.3 381237.5 402602.3 Net Income (607323.0) (268453.0) 829882.0 1045558.0 1236442.0 1304528.7 1376653.1 1453057.4 1533998.2 1619536.6 1709960.9 1805788.5 Net Income Attributable to Redeemable Non-Controlling Interests in Consolidated Entities87651.0 (24869.0) 103598.0 111885.8 120277.3 128696.7 137062.0 145285.7 154002.8 163243.0 173037.6 183419.8 Net Income Attributable to Non-Controlling Interests in Consolidated Entities343498.0 7953.0 99959.0 107955.7 116052.4 124176.1 132247.5 140182.4 148593.3 157508.9 166959.4 176977.0 Net Income Attributable to Non-Controlling Interests in Blackstone Holdings(668444.0) (83234.0) 407727.0 440345.2 473371.0 506507.0 539430.0 571795.8 606103.5 642469.7 681017.9 721879.0 Minority interest expense, after tax (enter as - ) 0.0 0.0 0.0 0.0 0.0 0.0 0.0 0.0 0.0 0.0 0.0 0.0 Net Income (Loss) Attributable to The Blackstone Group L.P.(370028.0) (168303.0) 218598.0 385371.3 526741.2 545149.0 567913.7 595793.5 625298.6 656314.9 688946.0 723512.6 Common dividends 599390.0 702832.0 614530.0 513854.8 519343.6 523877.5 527786.0 531155.5 534060.2 536564.2 538722.9 540583.8 Pro Forma EBITDA Reconciliation EBT (522654.0) 77258.0 1014905.0 1278666.2 1512107.9 1595374.7 1683579.3 1777017.9 1876004.6 1980613.8 2091198.4 2208390.8 Economic Income 1580770.0 1584971.0 2041007.0 2688822.6 3234653.6 3428732.8 3634456.8 3852524.2 4083675.7 4328696.2 4588418.0 4863723.1 Economic Net Income 1551838.0 1539208.0 1995299.0 2628606.9 3162214.1 3351947.0 3553063.8 3766247.6 3992222.4 4231755.8 4485661.1 4754800.8 Fee Related Earnings 478171.0 546493.0 700313.0 922592.3 1109878.6 1176471.3 1247059.6 1321883.2 1401196.2 1485267.9 1574384.0 1668847.0 Distributable Earnings 701784.0 696724.0 1033925.0 1362092.8 1638597.6 1736913.5 1841128.3 1951596.0 2068691.8 2192813.3 2324382.1 2463845.0 Interest 36666.0 53201.0 69152.0 79529.5 77641.0 76720.1 75799.3 74878.4 73957.6 73282.1 72851.9 72421.7 Taxes and Related Payables Including Payable Under Tax Receivable Agreement48867.0 74696.0 132325.0 183198.9 229432.1 258090.8 273576.2 289990.8 307390.2 325833.6 345383.7 366106.7 EBIT 787317.0 824621.0 1235402.0 1624821.2 1945670.7 2071724.4 2190503.8 2316465.2 2450039.6 2591929.0 2742617.6 2902373.3 Depreciation & amortization 192007.0 253629.0 192383.0 179249.2 167076.6 157515.8 150024.2 144171.8 139618.3 136094.3 133386.2 131325.2 EBITDA 979324.0 1078250.0 1427785.0 1804070.4 2112747.2 2229240.2 2340527.9 2460637.0 2589657.9 2728023.2 2876003.8 3033698.5 Pro Forma Basic EPS Reconcilliation Preferred dividends 0.0 0.0 0.0 0.0 0.0 0.0 0.0 0.0 0.0 0.0 0.0 0.0 Net income for basic EPS (370028.0) (168303.0) 218598.0 385371.3 526741.2 545149.0 567913.7 595793.5 625298.6 656314.9 688946.0 723512.6 Basic shares outstanding 364021.4 475582.7 533703.6 558537.8 564503.9 569432.0 573680.5 577342.9 580500.2 583222.0 585568.3 587591.1 Basic EPS (1.02) (0.35) 0.41 0.69 0.93 0.96 0.99 1.03 1.08 1.13 1.18 1.23 Pro Forma Diluted EPS Reconciliation Adjustment to net income for diluted EPS calc. 0.0 0.0 0.0 0.0 0.0 0.0 0.0 0.0 0.0 0.0 0.0 0.0 Net income for diluted EPS (370028.0) (168303.0) 218598.0 385371.3 526741.2 545149.0 567913.7 595793.5 625298.6 656314.9 688946.0 723512.6 Stock options, restricted stock, and converts 0.0 0.0 4965.4 4965.4 4965.4 4965.4 4965.4 4965.4 4965.4 4965.4 4965.4 4965.4 Diluted shares outstanding 364021.4 475582.7 538669.0 563503.2 569469.3 574397.4 578645.9 582308.3 585465.6 588187.3 590533.7 592556.4 Diluted EPS ($1.02) ($0.35) $0.41 $0.68 $0.92 $0.95 $0.98 $1.02 $1.07 $1.12 $1.17 $1.22 Actual Projected Annual Forecast Nonrecurring items 2
  • 2. Firstcall consensus EPS $0.41 $0.59 $0.74 $0.86 $1.00 $1.16 $1.34 $1.55 $1.80 $2.09 Model variance from consensus ($0.00) $0.09 $0.18 $0.09 ($0.01) ($0.13) ($0.27) ($0.44) ($0.64) ($0.87) Income statement assumptions Revenue growth (%) 4.3% 23.6% 31.7% 20.3% 6.0% 6.0% 6.0% 6.0% 6.0% 6.0% 6.0% Gross profit margin (%) (15.7%) 15.8% 35.2% 35.2% 35.2% 35.2% 35.2% 35.2% 35.2% 35.2% 35.2% 35.2% SG&A and Other margin 15.0% 17.4% 13.7% 13.7% 13.7% 13.7% 13.7% 13.7% 13.7% 13.7% 13.7% 13.7% EBIT margin (%) (30.7%) (1.6%) 21.5% 21.5% 21.5% 21.5% 21.5% 21.5% 21.5% 21.5% 21.5% 21.5% Effective tax rate (%) (16.2%) 447.5% 18.2% 18.2% 18.2% 18.2% 18.2% 18.2% 18.2% 18.2% 18.2% 18.2% D&A a % of depreciable assets (default) 20.8% 20.8% 20.8% 20.8% 20.8% 20.8% 20.8% 20.8% 20.8% 20.8% Income in equity affiliates growth (%) (128.4%) (516.6%) 8.0% 7.5% 7.0% 6.5% 6.0% 6.0% 6.0% 6.0% 6.0% Minority interest growth (%) 0.0% 0.0% 8.0% 7.5% 7.0% 6.5% 6.0% 6.0% 6.0% 6.0% 6.0% Dividend payout ratio (162.0%) (417.6%) 281.1% 133.3% 98.6% 96.1% 92.9% 89.2% 85.4% 81.8% 78.2% 74.7% Select a case (1=best, 2=base, 3=weak) Balance Sheet 12/31/11 12/31/12 12/31/13 12/31/14 12/31/15 12/31/16 12/31/17 12/31/18 12/31/19 12/31/20 12/31/21 Cash and equivalents (inc. investment securities) 7,785,330 10,888,590 9,862,481.9 9,263,018.5 8,618,547.9 7,935,717.3 7,222,652.8 6,479,829.1 5,800,884.7 5,091,850.0 4,351,820.4 Accounts receivable 406,140 638,164 840,717.3 1,011,382.9 1,072,065.8 1,136,389.8 1,204,573.2 1,276,847.6 1,353,458.4 1,434,665.9 1,520,745.9 Deferred income taxes 1,258,699 1,285,611 1,619,725.4 1,915,433.0 2,020,909.6 2,132,641.0 2,251,002.6 2,376,392.1 2,508,903.7 2,648,984.5 2,797,435.7 Prepaid expenses 81,701.0 81,498.0 107,365.5 129,160.7 136,910.3 145,124.9 153,832.4 163,062.4 172,846.1 183,216.9 194,209.9 Other current assets 106,005 152,484 152,484.0 152,484.0 152,484.0 152,484.0 152,484.0 152,484.0 152,484.0 152,484.0 152,484.0 Equity in affiliates 8,961,960 12,320,611 12,980,797.7 13,690,498.4 14,449,878.2 15,258,617.7 16,115,881.5 17,024,581.2 17,987,802.8 19,008,817.7 20,091,093.6 Furniture, Equipment and Leasehold Improvements, net 149,690.0 142,390.0 98,481.5 71,870.1 58,547.6 58,448.7 47,838.0 51,820.3 69,370.1 99,675.4 138,232.9 Goodwill 1,703,602 1,703,602 1,703,602.0 1,703,602.0 1,703,602.0 1,703,602.0 1,703,602.0 1,703,602.0 1,703,602.0 1,703,602.0 1,703,602.0 Intangibles 595,488 598,535 583,579.0 563,872.4 540,815.4 512,407.8 500,749.7 479,441.0 448,481.8 407,872.2 361,472.2 Other non-current assets 860,514.0 1,120,067.0 1,120,067.0 1,120,067.0 1,120,067.0 1,120,067.0 1,120,067.0 1,120,067.0 1,120,067.0 1,120,067.0 1,120,067.0 Total Assets 21,909,129.0 28,931,552.0 29,069,301.2 29,621,389.0 29,873,827.8 30,155,500.2 30,472,683.1 30,828,126.5 31,317,900.7 31,851,235.5 32,431,163.5 Accounts payable 584,385 520,232 685,353.6 824,480.4 873,949.3 926,386.2 981,969.4 1,040,887.5 1,103,340.8 1,169,541.2 1,239,713.7 Accrued expenses 903,260 1,254,978 1,653,308.0 1,988,929.5 2,108,265.3 2,234,761.2 2,368,846.9 2,510,977.7 2,661,636.4 2,821,334.6 2,990,614.6 Other current liabilities (non-debt) 244,345.0 467,435.0 467,435.0 467,435.0 467,435.0 467,435.0 467,435.0 467,435.0 467,435.0 467,435.0 467,435.0 Current portion of long-term debt 125,380.0 175,425.7 175,425.7 175,425.7 175,425.7 175,425.7 175,425.7 81,954.0 81,954.0 81,954.0 41,954.0 Short term debt (Revolving credit facility) 245,674.0 368,691.0 0.0 0.0 0.0 0.0 0.0 0.0 0.0 0.0 0.0 Long term debt 10,553,656.0 14,878,622.3 14,703,196.6 14,527,770.9 14,352,345.2 14,176,919.5 14,001,493.8 13,919,539.8 13,837,585.8 13,755,631.8 13,713,677.8 Convertible debt 0 0 0.0 0.0 0.0 0.0 0.0 0.0 0.0 0.0 0.0 Deferred income taxes 143.0 51,221.0 64,532.7 76,314.2 80,516.6 84,968.2 89,683.9 94,679.6 99,959.1 105,540.2 111,454.8 Other non-current liabilities 0 0 0.0 0.0 0.0 0.0 0.0 0.0 0.0 0.0 0.0 Total Liabilities 12,656,843.0 17,716,605.0 17,749,251.7 18,060,355.8 18,057,937.1 18,065,895.8 18,084,854.7 18,115,473.7 18,251,911.1 18,401,436.8 18,564,849.9 Redeemable Non-Controlling Interests in Consolidated Entities 1,091,833.0 1,556,185.0 1,556,185.0 1,556,185.0 1,556,185.0 1,556,185.0 1,556,185.0 1,556,185.0 1,556,185.0 1,556,185.0 1,556,185.0 Minority interest 0.0 0.0 0.0 0.0 0.0 0.0 0.0 0.0 0.0 0.0 0.0 Convertible Preferred Stock 0.0 0.0 0.0 0.0 0.0 0.0 0.0 0.0 0.0 0.0 0.0 Common Stock and APIC 4,668,705.0 5,464,677.0 5,699,463.0 5,934,249.0 6,169,035.0 6,403,821.0 6,638,607.0 6,873,393.0 7,108,179.0 7,342,965.0 7,577,751.0 Treasury stock (contra account) 0.0 0.0 (1,200.0) (2,400.0) (3,600.0) (4,800.0) (6,000.0) (7,200.0) (8,400.0) (9,600.0) (10,800.0) Comprehensive (accumulated) loss 1,958.0 2,170.0 2,170.0 2,170.0 2,170.0 2,170.0 2,170.0 2,170.0 2,170.0 2,170.0 2,170.0 Non-Controlling Interests in Consolidated Entities 1,029,270.0 1,443,559.0 1,443,559.0 1,443,559.0 1,443,559.0 1,443,559.0 1,443,559.0 1,443,559.0 1,443,559.0 1,443,559.0 1,443,559.0 Non-Controlling Interests in Blackstone Holdings 2,460,520.0 2,748,356.0 2,748,356.0 2,748,356.0 2,748,356.0 2,748,356.0 2,748,356.0 2,748,356.0 2,748,356.0 2,748,356.0 2,748,356.0 Retained earnings 0.0 0.0 (128,483.4) (121,085.8) (99,814.3) (59,686.6) 4,951.4 96,189.8 215,940.6 366,163.7 549,092.6 Total Shareholders' Equity 8,160,453.0 9,658,762.0 9,763,864.6 10,004,848.2 10,259,705.7 10,533,419.4 10,831,643.4 11,156,467.8 11,509,804.6 11,893,613.7 12,310,128.6 Total Liabilities + Shareholders' Equity 21,909,129.0 28,931,552.0 29,069,301.2 29,621,389.0 29,873,827.8 30,155,500.2 30,472,683.1 30,828,126.5 31,317,900.7 31,851,235.5 32,431,163.5 Balance check 0.0 0.0 0.0 0.0 0.0 0.0 0.0 0.0 0.0 0.0 0.0 Supporting Schedules 12/31/11 12/31/12 12/31/13 12/31/14 12/31/15 12/31/16 12/31/17 12/31/18 12/31/19 12/31/20 12/31/21 Working Capital 1. Grow with revenues (default) 2. Override i: Days of revenues (Avg. collection period) 45.6 58.1 3. Overide ii: Absolute projection Accounts receivable 406,140.0 638,164.0 840,717.3 1,011,382.9 1,072,065.8 1,136,389.8 1,204,573.2 1,276,847.6 1,353,458.4 1,434,665.9 1,520,745.9 1. Grow with SG&A (default) 2. Overide: Absolute projection Prepaid expenses 81,701.0 81,498.0 107,365.5 129,160.7 136,910.3 145,124.9 153,832.4 163,062.4 172,846.1 183,216.9 194,209.9 1. Straight-line (default) 2. Overide: Absolute projection Other current assets 106,005.0 152,484.0 152,484.0 152,484.0 152,484.0 152,484.0 152,484.0 152,484.0 152,484.0 152,484.0 152,484.0
  • 3. 1. Grow with COGS (default) 2. Override i. Payables Payment Period 77.9 73.1 3. Overide ii: Absolute projection Accounts payable 584,385.0 520,232.0 685,353.6 824,480.4 873,949.3 926,386.2 981,969.4 1,040,887.5 1,103,340.8 1,169,541.2 1,239,713.7 1. Grow with SG&A (default) 2. Overide: Absolute projection Accrued expenses 903,260.0 1,254,978.0 1,653,308.0 1,988,929.5 2,108,265.3 2,234,761.2 2,368,846.9 2,510,977.7 2,661,636.4 2,821,334.6 2,990,614.6 1. Straight-line (default) 2. Overide: Absolute projection Other current liabilities (non-debt) 244,345.0 467,435.0 467,435.0 467,435.0 467,435.0 467,435.0 467,435.0 467,435.0 467,435.0 467,435.0 467,435.0 Intangible assets Purchase of intangible assets 23,768.0 142,221.0 82,994.5 82,994.5 82,994.5 82,994.5 82,994.5 82,994.5 82,994.5 82,994.5 82,994.5 Amortization (enter as -) (207,591.0) (139,174.0) (97,950.5) (102,701.0) (106,051.6) (111,402.1) (94,652.6) (104,303.1) (113,953.7) (123,604.2) (129,394.5) Intangibles 595,488.0 598,535.0 583,579.0 563,872.4 540,815.4 512,407.8 500,749.7 479,441.0 448,481.8 407,872.2 361,472.2 Furniture, Equipment and Leasehold Improvements Capital expenditures 36,484.0 37,020.0 37,390.2 37,764.1 38,141.7 38,523.2 38,908.4 39,297.5 39,690.5 40,087.4 40,488.2 Recurring asset sales (enter as -) 0.0 0.0 0.0 0.0 0.0 0.0 0.0 0.0 0.0 Depreciation (46,038.0) (53,209.0) (81,298.7) (64,375.5) (51,464.2) (38,622.1) (49,519.2) (35,315.2) (22,140.6) (9,782.0) (1,930.7) PP&E 149,690.0 142,390.0 98,481.5 71,870.1 58,547.6 58,448.7 47,838.0 51,820.3 69,370.1 99,675.4 138,232.9 Diluted Shares outstanding Treasury share $ repurchases (2,100.0) 0.0 (1,200.0) (1,200.0) (1,200.0) (1,200.0) (1,200.0) (1,200.0) (1,200.0) (1,200.0) (1,200.0) Value of shares issued 238,632.0 234,786.0 234,786.0 234,786.0 234,786.0 234,786.0 234,786.0 234,786.0 234,786.0 234,786.0 234,786.0 Expected average share price $24.45 $35.18 $44.13 $51.19 $59.38 $68.88 $79.90 $92.69 $107.52 $124.72 Consensus EPS growth 43.9% 25.4% 16.0% 16.0% 16.0% 16.0% 16.0% 16.0% 16.0% Shares repurchased (34.1) (27.2) (23.4) (20.2) (17.4) (15.0) (12.9) (11.2) (9.6) Shares issued 6,673.1 5,320.4 4,586.6 3,953.9 3,408.6 2,938.4 2,533.1 2,183.7 1,882.5 End of period basic shares outstanding 555,218.3 561,857.3 567,150.5 571,713.6 575,647.3 579,038.5 581,961.9 584,482.0 586,654.6 588,527.5 Weighted average basic shares outstanding 475,582.7 533,703.6 558,537.8 564,503.9 569,432.0 573,680.5 577,342.9 580,500.2 583,222.0 585,568.3 587,591.1 Investments in affiliates (Equity method) Equity in income of affiliates 660,186.7 709,700.7 759,379.8 808,739.5 857,263.8 908,699.7 963,221.6 1,021,014.9 1,082,275.8 Dividends (enter as -) Equity in affiliates (from balance sheet) 8,961,960.0 12,320,611.0 12,980,797.7 13,690,498.4 14,449,878.2 15,258,617.7 16,115,881.5 17,024,581.2 17,987,802.8 19,008,817.7 20,091,093.6 Minority interest (Consolidation method) Minority interest expense 0.0 0.0 0.0 0.0 0.0 0.0 0.0 0.0 0.0 Dividends (enter as -) Minority interest (from balance sheet) 0.0 0.0 0.0 0.0 0.0 0.0 0.0 0.0 0.0 0.0 0.0 Cash Flow Statement 12/31/13 12/31/14 12/31/15 12/31/16 12/31/17 12/31/18 12/31/19 12/31/20 12/31/21 Net Income 385,371.3 526,741.2 545,149.0 567,913.7 595,793.5 625,298.6 656,314.9 688,946.0 723,512.6 Depreciation & amortization 179,249.2 167,076.6 157,515.8 150,024.2 144,171.8 139,618.3 136,094.3 133,386.2 131,325.2 Changes in working capital Accounts receivable (202,553.3) (170,665.6) (60,683.0) (64,323.9) (68,183.4) (72,274.4) (76,610.9) (81,207.5) (86,080.0) Deferred tax assets (334,114.4) (295,707.7) (105,476.6) (111,731.4) (118,361.6) (125,389.5) (132,511.7) (140,080.8) (148,451.2) Prepaid expenses (25,867.5) (21,795.2) (7,749.6) (8,214.6) (8,707.5) (9,229.9) (9,783.7) (10,370.8) (10,993.0) Other current assets 0.0 0.0 0.0 0.0 0.0 0.0 0.0 0.0 0.0 Accounts payable 165,121.6 139,126.8 49,468.8 52,437.0 55,583.2 58,918.2 62,453.3 66,200.4 70,172.5 Accrued expenses 398,330.0 335,621.5 119,335.8 126,495.9 134,085.7 142,130.8 150,658.7 159,698.2 169,280.1 Other current liabilities 0.0 0.0 0.0 0.0 0.0 0.0 0.0 0.0 0.0 Deferred tax liabilities 13,311.7 11,781.5 4,202.4 4,451.6 4,715.7 4,995.7 5,279.5 5,581.1 5,914.6 Equity income in affiliates (660,186.7) (709,700.7) (759,379.8) (808,739.5) (857,263.8) (908,699.7) (963,221.6) (1,021,014.9) (1,082,275.8) Dividends received from affiliates 0.0 0.0 0.0 0.0 0.0 0.0 0.0 0.0 0.0 Minority interest expense 0.0 0.0 0.0 0.0 0.0 0.0 0.0 0.0 0.0 Cash from operations (81,337.9) (17,521.5) (57,617.2) (91,687.2) (118,166.4) (144,631.9) (171,327.2) (198,862.1) (227,595.0) Purchase of fixed assets (capital expenditures) (37,390.2) (37,764.1) (38,141.7) (38,523.2) (38,908.4) (39,297.5) (39,690.5) (40,087.4) (40,488.2) Proceeds from sale of fixed assets 0.0 0.0 0.0 0.0 0.0 0.0 0.0 0.0 0.0 Purchases of intangible assets (82,994.5) (82,994.5) (82,994.5) (82,994.5) (82,994.5) (82,994.5) (82,994.5) (82,994.5) (82,994.5) Purchases/Proceeds from other long-term assets 0.0 0.0 0.0 0.0 0.0 0.0 0.0 0.0 0.0 Cash from investing (120,384.7) (120,758.6) (121,136.2) (121,517.7) (121,902.9) (122,292.0) (122,685.0) (123,081.9) (123,482.7) Convertible preferred stock 0.0 0.0 0.0 0.0 0.0 0.0 0.0 0.0 0.0 Common stock and APIC 234,786.0 234,786.0 234,786.0 234,786.0 234,786.0 234,786.0 234,786.0 234,786.0 234,786.0
  • 4. Treasury stock repurchases (1,200.0) (1,200.0) (1,200.0) (1,200.0) (1,200.0) (1,200.0) (1,200.0) (1,200.0) (1,200.0) Comprehensive accumulated loss 0.0 0.0 0.0 0.0 0.0 0.0 0.0 0.0 0.0 Other equity account 0.0 0.0 0.0 0.0 0.0 0.0 0.0 0.0 0.0 Common and preferred dividends (513,854.8) (519,343.6) (523,877.5) (527,786.0) (531,155.5) (534,060.2) (536,564.2) (538,722.9) (540,583.8) Dividends to minority interests 0.0 0.0 0.0 0.0 0.0 0.0 0.0 0.0 0.0 Increases / (decreases) in debt (544,116.7) (175,425.7) (175,425.7) (175,425.7) (175,425.7) (175,425.7) (81,954.0) (81,954.0) (81,954.0) Cash from financing (824,385.5) (461,183.3) (465,717.2) (469,625.7) (472,995.2) (475,899.9) (384,932.2) (387,090.9) (388,951.8) Total increase/decrease of cash (1,026,108.1) (599,463.4) (644,470.6) (682,830.6) (713,064.4) (742,823.7) (678,944.4) (709,034.8) (740,029.5) Debt Current portion of LTD 125,380.0 175,425.7 175,425.7 175,425.7 175,425.7 175,425.7 175,425.7 81954.0 81954.0 81954.0 41954.0 Reclassification of LTD to CP of LTD (175,425.7) (175,425.7) (175,425.7) (175,425.7) (175,425.7) (81,954.0) (81,954.0) (81,954.0) (41,954.0) Discretionary (paydown)/borrowing of long term debt Long term debt 10,553,656.0 14,878,622.3 14,703,196.6 14,527,770.9 14,352,345.2 14,176,919.5 14,001,493.8 13,919,539.8 13,837,585.8 13,755,631.8 13,713,677.8 Discretionary (paydown)/borrowing of convertible debt Convertible debt 0.0 0.0 0.0 0.0 0.0 0.0 0.0 0.0 0.0 0.0 0.0 Calculation of short term debt Cash @ beginning of the year (end of last year) 10,888,590.0 9,862,481.9 9,263,018.5 8,618,547.9 7,935,717.3 7,222,652.8 6,479,829.1 5,800,884.7 5,091,850.0 Plus: Free cash flows prior to debt during year avg. of (revenue / cash) (481,991.4) (424,037.7) (469,044.9) (507,404.9) (537,638.7) (567,398.0) (596,990.4) (627,080.8) (658,075.5) Less: Minimum cash balance 20.0% 1,059,042.3 1,274,027.9 1,350,469.6 1,431,497.8 1,517,387.6 1,608,430.9 1,704,936.7 1,807,232.9 1,915,666.9 Total cash available / (debt required) for short term debt paydown 9,172,130.6 7,988,990.6 7,268,078.3 6,504,219.5 5,705,265.2 4,871,398.3 4,095,948.0 3,284,617.0 2,436,153.5 Short term debt 245,674.0 368,691.0 0.0 0.0 0.0 0.0 0.0 0.0 0.0 0.0 0.0 Interest expense Current portion of long-term debt 125,380.0 175,425.7 175,425.7 175,425.7 175,425.7 175,425.7 175,425.7 81,954.0 81,954.0 81,954.0 41,954.0 Short term debt 245,674.0 368,691.0 0.0 0.0 0.0 0.0 0.0 0.0 0.0 0.0 0.0 Long term debt 10,553,656.0 14,878,622.3 14,703,196.6 14,527,770.9 14,352,345.2 14,176,919.5 14,001,493.8 13,919,539.8 13,837,585.8 13,755,631.8 13,713,677.8 Convertible debt 0.0 0.0 0.0 0.0 0.0 0.0 0.0 0.0 0.0 0.0 0.0 Total debt 10,924,710.0 15,422,739.0 14,878,622.3 14,703,196.6 14,527,770.9 14,352,345.2 14,176,919.5 14,001,493.8 13,919,539.8 13,837,585.8 13,755,631.8 Interest expense 57,824.0 72,870.0 83,805.5 81,815.4 80,845.0 79,874.7 78,904.3 77,934.0 77,222.1 76,768.8 76,315.5 Average interest rate 0.6% 0.6% 0.6% 0.6% 0.6% 0.6% 0.6% 0.6% 0.6% 0.6% Ratio analysis 12/31/13 12/31/14 12/31/15 12/31/16 12/31/17 12/31/18 12/31/19 12/31/20 12/31/21 Capital Structure Market Debt / Equity 75.0% 58.5% 49.4% 41.8% 35.3% 29.9% 25.5% 21.8% 18.6% Financial Risk Ratios EBITDA / Total Interest 21.5x 25.8x 27.6x 29.3x 31.2x 33.2x 35.3x 37.5x 39.8x (EBITDA - Capex) / Total Interest 21.1x 25.4x 27.1x 28.8x 30.7x 32.7x 34.8x 36.9x 39.2x Total Debt / EBITDA 8.2x 7.0x 6.5x 6.1x 5.8x 5.4x 5.1x 4.8x 4.5x Total Debt / Total Capitalization (Bk. Equity) 60.4% 59.5% 58.6% 57.7% 56.7% 55.7% 54.7% 53.8% 52.8% Net Debt / EBITDA 2.8x 2.6x 2.7x 2.7x 2.8x 2.9x 3.0x 3.0x 3.1x Interest Coverage (EBIT/Interest expense) 13.6x 16.8x 18.0x 19.3x 20.7x 22.2x 23.8x 25.3x 27.0x Internal Liquidity Current Ratio (Curr. Assets / Curr. Liab.) 4.5x 3.8x 3.5x 3.2x 2.9x 2.6x 2.4x 2.1x 1.9x Cash Ratio (Cash / Current Liab.) 3.5x 2.8x 2.5x 2.2x 1.9x 1.6x 1.4x 1.1x 0.9x Operating Efficiency Return on Capital (ROIC) 4.2% 5.0% 5.3% 5.5% 5.8% 6.1% 6.4% 6.7% 7.0% Dupont Analysis Operating Profit Margin 21.5% 21.5% 21.5% 21.5% 21.5% 21.5% 21.5% 21.5% 21.5% Asset Turnover (Sales/ Assets) 0.2x 0.2x 0.2x 0.2x 0.2x 0.3x 0.3x 0.3x 0.3x Interest (inc. interest income)/ Sales 1.6% 1.3% 1.2% 1.1% 1.0% 1.0% 0.9% 0.8% 0.8% Equity multiplier (Assets / Equity) 3.0x 3.0x 2.9x 2.9x 2.8x 2.8x 2.7x 2.7x 2.6x Tax Retention Rate 81.8% 81.8% 81.8% 81.8% 81.8% 81.8% 81.8% 81.8% 81.8% ROE 5.7% 8.1% 8.7% 9.4% 9.9% 10.5% 11.0% 11.5% 12.0% Operating scenarios - sensitivity analysis Revenue growth (%) Strong case 1 32.7% 21.3% 7.0% 7.0% 7.0% 7.0% 7.0% 7.0% 7.0% Base case 2 31.7% 20.3% 6.0% 6.0% 6.0% 6.0% 6.0% 6.0% 6.0% Weak case 3 30.7% 19.3% 5.0% 5.0% 5.0% 5.0% 5.0% 5.0% 5.0%
  • 5. Gross Profit margin (%) Strong case 1 35.7% 35.7% 35.7% 35.7% 35.7% 35.7% 35.7% 35.7% 35.7% Base case 2 35.2% 35.2% 35.2% 35.2% 35.2% 35.2% 35.2% 35.2% 35.2% Weak case 3 34.7% 34.7% 34.7% 34.7% 34.7% 34.7% 34.7% 34.7% 34.7% SG&A and Other margin (%) Strong case 1 12.7% 12.7% 12.7% 12.7% 12.7% 12.7% 12.7% 12.7% 12.7% Base case 2 13.7% 13.7% 13.7% 13.7% 13.7% 13.7% 13.7% 13.7% 13.7% Weak case 3 14.7% 14.7% 14.7% 14.7% 14.7% 14.7% 14.7% 14.7% 14.7% Taxes 1. Straight line (default) 18.2% 18.2% 18.2% 18.2% 18.2% 18.2% 18.2% 18.2% 18.2% 2. Override i. Use marginal tax rate 3. Overide ii: Absolute projection Capex as a % of revenues Strong case 1 1.5% 1.5% 1.5% 1.5% 1.5% 1.5% 1.5% 1.5% 1.5% Base case 2 1.0% 1.0% 1.0% 1.0% 1.0% 1.0% 1.0% 1.0% 1.0% Weak case 3 0.5% 0.5% 0.5% 0.5% 0.5% 0.5% 0.5% 0.5% 0.5% Income in equity affiliates growth (%) Strong case 1 10.0% 9.5% 9.0% 8.5% 8.0% 8.0% 8.0% 8.0% 8.0% Base case 2 8.0% 7.5% 7.0% 6.5% 6.0% 6.0% 6.0% 6.0% 6.0% Weak case 3 6.0% 5.5% 5.0% 4.5% 4.0% 4.0% 4.0% 4.0% 4.0% Minority interest growth (%) Strong case 1 10.0% 9.5% 9.0% 8.5% 8.0% 8.0% 8.0% 8.0% 8.0% Base case 2 8.0% 7.5% 7.0% 6.5% 6.0% 6.0% 6.0% 6.0% 6.0% Weak case 3 6.0% 5.5% 5.0% 4.5% 4.0% 4.0% 4.0% 4.0% 4.0% Data tables Display 2013 EPS based on various revenue growth assumptions (column) and gross profit margin assumptions (row) 2013 gross profit margin $0.68 33.2% 34.2% 35.2% 36.2% 37.2% 33.7% 0.68 0.68 0.68 0.68 0.68 32.7% 0.68 0.68 0.68 0.68 0.68 2013 Revenue growth range 31.7% 0.68 0.68 0.68 0.68 0.68 30.7% 0.68 0.68 0.68 0.68 0.68 29.7% 0.68 0.68 0.68 0.68 0.68 28.7% 0.68 0.68 0.68 0.68 0.68