SlideShare a Scribd company logo
1 of 12
Altria Group Inc.
NYSE- MO Current Price: $50.83 GICS Industry Group: Food, Beverage, & Tobacco
Analyzed By: Cassie Pennington
Summary:
Altria Group Inc. is one of the world’s largest tobacco corporations. Altria is it is the parent company
of Philip Morris USA, John Middleton, Inc., U.S. Smokeless Tobacco Company, Inc., Philip Morris
Capital Corporation, and Chateau Ste. Michelle Wine Estates
Key Stock Statistics:
52 Week Price Range $40.26-$56.70
Average Daily Volume 7,033,250
Beta 0.82
Dividend Yield (Estimated) 4.00%
Shares Outstanding 1.97B
Market Capitalization 99.57B
Institutional Holdings 60%
Insider Holdings 0%
Book Value per Share 1%
Return on Equity 146%
Market Profile
.
CORPORATE OVERVIEW. The Virginia based company Altria Group Inc., is one of the world’s
largest tobacco corporations. The diversified company operates its business in three segments: smokeable
products, smokeless products, and wine. Altria Group Inc. is the parent company of Phillip Morris USA,
John Middleton Co., U.S. Smokeless Tobacco Company Inc., Phillip Morris Capital Corporation, and
Chateau Ste. Michelle Wine Estates. Altria Group Inc. sells their products in all 50 states and nations
worldwide.
TOBACCO Altria Group Inc. is involved in two sectors of the tobacco industry: smokeable and
smokeless. Phillip Morris USA Inc. predominately focuses on the manufacturing and sale of cigarettes in
the United States; John Middleton Co., a wholly-owned subsidiary of Phillip Morris USA Inc.,
manufactures and sells machine-made large cigars and pipe tobacco; U.S. Smokeless Tobacco Company
Inc. manufactures and sells all smokeless tobacco products.
 Cigarettes: Phillip Morris USA Inc. is the largest cigarette company in the United States with
an annual shipment volume of approximately 125.4 billion units of cigarettes in 2014 (a
decrease of 3% since 2013). For the past 35 years,Phillip Morris USA Inc.’s brand Marlboro
has been the largest-selling cigarette brand in the United States.
 Cigars: John Middleton Co. manufactures and sells machine-made cigars and pipe tobacco.
Their approximate annual shipment volume is 1.3 billion units as of 2014 (an increase of 6.1%
from 2013). John Middleton Co.’s most principal cigar brand is Black and Mild.
 SmokelessTobacco: U.S. Smokeless Tobacco Company Inc. is the leading producer in
chewing tobacco (also known as moist smokeless tobacco or “MST”). The premium brands for
smokeless tobacco include Copenhagen and Skoal and value brands, Red Seal, Husky, and
Business Description
Marlboro Snus. The total shipment volume for smokeless tobacco in 2014 was 793.3 million
units (an increase of 0.7% since 2013).
ALCOHOL Altria Group Inc. is also involved in the alcohol industry. Ste. Michelle Wine Estates
produces various premium table wines. Ste. Michelle Wine Estates is the leading producer of
Washington state wines, more importantly Chateau Ste. Michelle,Columbus Crest, and 14 Hands. They
also own or distribute many domestic and foreign wineries. The total shipment volume for Ste. Michelle
in 2014 was 8.4 million cases (an increase of 4.8% since 2013).
MANAGEMENT Altria Group Inc. is operated by approximately 9,000 hourly and salaried
employees. Altria Group Inc.’s board of directors is made of 7 members:
 Martin J. Barrington- Chairman, ChiefExecutive Officer and President, Richmond, VA
 Gerald L. Baliles- Retired Director and ChiefExecutive Officer, Miller Center ofPublic
Affairs, Charlottesville, VA
 Thomas F. Farrell II- Chairman, President and ChiefExecutive Officer, Dominion
Resources,Inc., Richmond, VA
 Thomas W. Jones- Senior Partner, TWJ Capital LLC, Stamford, CT
 W. Leo Kiely III- Retired ChiefExecutive Officer, MillerCoors LLC, Golden, CO
 George Muñoz- Principal, Muñoz Investment Banking Group, LLC, Washington, DC,
Partner, Tobin & Muñoz, Chicago, IL
 Nabil Y. Sakkab- Retired Senior Vice President, Corporate Research and Development,
The Procter & Gamble Company, Cincinnati, OH
Altria Group Inc. is part of the food, beverage, and tobacco industry. Currently Altria
Group Inc. is more dependent on foreign sales in comparison to domestic sales. For example,
most Asian cultures have high rates of smokers. According to the World Health Organization
(WHO), 67% of men in China, 51% of men smoke in Japan, and 67% of men in the Republic of
Korea. In the United States, however, a large amount of consumers have switched over to vaping
or e-cigarettes as an alternative.
Industry Analysis
HOLT’S MODEL Comparing Altria Group to its industry, I used a dividend yield of 4.00% and
an industry forward P/E Ratio of 25.76. For the company growth rates, I used a below historical
growth rate of 6% for the pessimistic scenario, the historical growth rate of 10% for the moderate
scenario, and a growth rate of 15% for the optimistic scenario should the United States enter into
a boom period within the next two years. Altria Group dividend yield is 4.00%, and the expected
earnings for 2015 are $2.79. Using the average of all three scenarios, the Holt’s Model values
Altria Group Inc. at $62.35 compared to its competitor, Reynolds American Inc. Therefore,
Altria Group Inc. is undervalued. I recommend buying Altria Group Inc.
CAPITAL ASSET PRICING MODEL Using the capital asset pricing model or CAPM, Altria
Group Inc. is valued at 9.86 which is above the market return of 8.5 indicating that investing in
Altria Group Inc. would be a wise investment.
Valuation and Recommendation
Holt’s Model
Competitor: Reynolds American, Inc. (NYSE: RAI)
Pessimistic Growth = 6%
9692.0
035.10.01
04.006.01









WAB
TRN
PE
PE
Fair PE = (0.9692)(25.76) = $24.9666
Estimated EPSTRN 2015 = $2.49
Fair Value = (24.9666)(2.49) = $62.17
Moderate Growth = 10%
9620.0
035.015.01
04.010.01









WAB
TRN
PE
PE
Fair PE = (0.9620)(25.76) = 24.28
Estimated EPSTRN 2015 = $2.49
Fair Value = (24.28)(2.49) = $60.46
Optimistic Growth = 15%
0042.1
035.015.01
04.015.01









WAB
TRN
PE
PE
Fair PE = (1.0042)(25.76) = 25.87
Estimated EPSTRN2015 = $2.49
Fair Value = (25.87)(2.49) = $64.42
Average FairValue: $62.35
CAPM Model
Risk-free Rate = 2.31%
Beta = 0.82
Market Return = 8.5%
K = 2.31% + 0.82*(8.5% - 2.04%)
K = 9.86%
Income Statement- In Millions ofUSD (except for
per share items)
3
month
s
ending
2015-
03-31
3
month
s
ending
2014-
12-31
3
month
s
ending
2014-
09-30
3
month
s
ending
2014-
06-30
3
month
s
ending
2014-
03-31
Revenue
5,804.
00
6,258.
00
6,491.
00
6,256.
00
5,517.
00
Other Revenue, Total - - - - -
Total Revenue
5,804.
00
6,258.
00
6,491.
00
6,256.
00
5,517.
00
Cost of Revenue, Total
3,329.
00
3,631.
00
3,817.
00
3,653.
00
3,261.
00
Income Statement- In Millions ofUSD (except for
per share items)
3
month
s
ending
2015-
03-31
3
month
s
ending
2014-
12-31
3
month
s
ending
2014-
09-30
3
month
s
ending
2014-
06-30
3
month
s
ending
2014-
03-31
Gross Profit
2,475.
00
2,627.
00
2,674.
00
2,603.
00
2,256.
00
Selling/General/Admin. Expenses, Total
610.0
0
718.0
0
663.0
0
638.0
0
520.0
0
Research & Development - - - - -
Depreciation/Amortization - - - - -
Interest Expense(Income) - Net Operating - - - - -
Unusual Expense (Income)
228.0
0
41.00 12.00 -10.00 2.00
Other Operating Expenses, Total - - - - -
Total Operating Expense
4,167.
00
4,390.
00
4,492.
00
4,281.
00
3,783.
00
Operating Income
1,637.
00
1,868.
00
1,999.
00
1,975.
00
1,734.
00
Interest Income(Expense), Net Non-Operating - - - - -
Gain (Loss) on Sale of Assets - - - - -
Other, Net - - - - -
Income Before Tax
1,562.
00
1,909.
00
2,114.
00
1,945.
00
1,806.
00
Income After Tax
1,018.
00
1,236.
00
1,397.
00
1,262.
00
1,175.
00
Minority Interest 0.00 0.00 0.00 0.00 0.00
Equity In Affiliates - - - - -
Net Income Before Extra. Items
1,018.
00
1,236.
00
1,397.
00
1,262.
00
1,175.
00
Income Statement- In Millions ofUSD (except for
per share items)
3
month
s
ending
2015-
03-31
3
month
s
ending
2014-
12-31
3
month
s
ending
2014-
09-30
3
month
s
ending
2014-
06-30
3
month
s
ending
2014-
03-31
Accounting Change - - - - -
Discontinued Operations - - - - -
Extraordinary Item - - - - -
Net Income
1,018.
00
1,236.
00
1,397.
00
1,262.
00
1,175.
00
Preferred Dividends - - - - -
Income Available to Common Excl. Extra Items
1,016.
00
1,233.
00
1,394.
00
1,259.
00
1,172.
00
Income Available to Common Incl. Extra Items
1,016.
00
1,233.
00
1,394.
00
1,259.
00
1,172.
00
Basic Weighted Average Shares - - - - -
Basic EPS Excluding Extraordinary Items - - - - -
Basic EPS Including Extraordinary Items - - - - -
Dilution Adjustment - - - - -
Diluted Weighted Average Shares
1,966.
00
1,969.
00
1,976.
00
1,980.
00
1,986.
00
Diluted EPS Excluding Extraordinary Items 0.52 0.63 0.71 0.64 0.59
Diluted EPS Including Extraordinary Items - - - - -
Dividends per Share - Common Stock Primary
Issue
0.52 0.52 0.52 0.48 0.48
Gross Dividends - Common Stock - - - - -
Net Income after Stock Based Comp. Expense - - - - -
Basic EPS after Stock Based Comp. Expense - - - - -
Income Statement- In Millions ofUSD (except for
per share items)
3
month
s
ending
2015-
03-31
3
month
s
ending
2014-
12-31
3
month
s
ending
2014-
09-30
3
month
s
ending
2014-
06-30
3
month
s
ending
2014-
03-31
Diluted EPS after Stock Based Comp. Expense - - - - -
Depreciation, Supplemental - - - - -
Total Special Items - - - - -
Normalized Income Before Taxes - - - - -
Effect of Special Items on Income Taxes - - - - -
Income Taxes Ex. Impact of Special Items - - - - -
Normalized Income After Taxes - - - - -
Normalized Income Avail to Common - - - - -
Basic Normalized EPS - - - - -
Diluted Normalized EPS 0.62 0.65 0.71 0.64 0.59
Balance Sheet- In Millions of USD (except
for per share items)
As of
2015-
03-31
As of
2014-
12-31
As of
2014-
09-30
As of
2014-
06-30
As of
2014-
03-31
Cash & Equivalents
3,674.
00
3,321.
00
2,241.
00
1,193.
00
3,620.
00
Short Term Investments - - - - -
Cash and Short Term Investments
3,674.
00
3,321.
00
2,241.
00
1,193.
00
3,620.
00
Accounts Receivable - Trade, Net 172.00 124.00 106.00 105.00 113.00
Receivables - Other - - - - -
Total Receivables, Net 172.00 124.00 106.00 105.00 113.00
Balance Sheet- In Millions of USD (except
for per share items)
As of
2015-
03-31
As of
2014-
12-31
As of
2014-
09-30
As of
2014-
06-30
As of
2014-
03-31
Total Inventory
2,085.
00
2,040.
00
1,890.
00
1,850.
00
1,970.
00
Prepaid Expenses - - - - -
Other Current Assets, Total
1,302.
00
1,393.
00
1,425.
00
1,327.
00
1,274.
00
Total Current Assets
7,233.
00
6,878.
00
5,662.
00
4,475.
00
6,977.
00
Property/Plant/Equipment, Total - Gross
4,784.
00
4,755.
00
4,851.
00
4,816.
00
4,828.
00
Accumulated Depreciation, Total
-
2,812.
00
-
2,772.
00
-
2,853.
00
-
2,819.
00
-
2,825.
00
Goodwill, Net
5,285.
00
5,285.
00
5,285.
00
5,285.
00
5,174.
00
Intangibles, Net
12,044
.00
12,049
.00
12,054
.00
12,059
.00
12,053
.00
Long Term Investments
7,210.
00
7,797.
00
8,413.
00
8,816.
00
8,608.
00
Other Long Term Assets, Total 468.00 483.00 670.00 650.00 591.00
Total Assets
34,212
.00
34,475
.00
34,082
.00
33,282
.00
35,406
.00
Accounts Payable 274.00 416.00 332.00 311.00 321.00
Accrued Expenses
6,113.
00
5,229.
00
4,704.
00
3,781.
00
5,788.
00
Notes Payable/Short Term Debt 0.00 0.00 0.00 0.00 0.00
Current Port. of LT Debt/Capital Leases
1,000.
00
1,000.
00
1,300.
00
0.00 0.00
Other Current liabilities, Total
1,508.
00
1,028.
00
1,031.
00
954.00
1,475.
00
Balance Sheet- In Millions of USD (except
for per share items)
As of
2015-
03-31
As of
2014-
12-31
As of
2014-
09-30
As of
2014-
06-30
As of
2014-
03-31
Total Current Liabilities
8,895.
00
7,673.
00
7,367.
00
5,046.
00
7,584.
00
Long Term Debt
12,901
.00
13,693
.00
12,693
.00
13,993
.00
13,992
.00
Capital Lease Obligations - - - - -
Total Long Term Debt
12,901
.00
13,693
.00
12,693
.00
13,993
.00
13,992
.00
Total Debt
13,901
.00
14,693
.00
13,993
.00
13,993
.00
13,992
.00
Deferred Income Tax
5,907.
00
6,088.
00
6,829.
00
6,970.
00
6,908.
00
Minority Interest 29.00 31.00 32.00 32.00 32.00
Other Liabilities, Total
3,947.
00
3,976.
00
2,867.
00
2,846.
00
2,775.
00
Total Liabilities
31,679
.00
31,461
.00
29,788
.00
28,887
.00
31,291
.00
Redeemable Preferred Stock, Total - - - - -
Preferred Stock - Non Redeemable, Net - - - - -
Common Stock, Total 935.00 935.00 935.00 935.00 935.00
Additional Paid-In Capital
5,754.
00
5,735.
00
5,723.
00
5,692.
00
5,678.
00
Retained Earnings (Accumulated Deficit)
26,271
.00
26,277
.00
26,066
.00
25,698
.00
25,388
.00
Treasury Stock - Common
-
27,482
.00
-
27,251
.00
-
26,976
.00
-
26,701
.00
-
26,568
.00
Other Equity, Total
-
2,945.
00
-
2,682.
00
-
1,454.
00
-
1,229.
00
-
1,318.
00
Balance Sheet- In Millions of USD (except
for per share items)
As of
2015-
03-31
As of
2014-
12-31
As of
2014-
09-30
As of
2014-
06-30
As of
2014-
03-31
Total Equity
2,533.
00
3,014.
00
4,294.
00
4,395.
00
4,115.
00
Total Liabilities & Shareholders' Equity
34,212
.00
34,475
.00
34,082
.00
33,282
.00
35,406
.00
Shares Outs - Common Stock Primary Issue - - - - -
Total Common Shares Outstanding
1,967.
16
1,971.
47
1,977.
01
1,983.
45
1,986.
72
Citations:
Finance.yahoo.com
Bloomberg.com
WHO.org
Nasdaq.com
Altria.com
Morningstar.com
Google.com/finance

More Related Content

Similar to Altria Analysis- Cassie Pennington

Traci's vs. new team elites ppt aug 2011
Traci's vs. new team elites ppt aug 2011 Traci's vs. new team elites ppt aug 2011
Traci's vs. new team elites ppt aug 2011 John Wright
 
Globalisation And The Coca-Cola Company
Globalisation And The Coca-Cola CompanyGlobalisation And The Coca-Cola Company
Globalisation And The Coca-Cola CompanyKaren Gilchrist
 
2016Corporate ProfileTootsie Roll Industries, Inc. h.docx
2016Corporate ProfileTootsie Roll Industries, Inc. h.docx2016Corporate ProfileTootsie Roll Industries, Inc. h.docx
2016Corporate ProfileTootsie Roll Industries, Inc. h.docxfelicidaddinwoodie
 
Estée Lauder Equity Research Report
Estée Lauder Equity Research ReportEstée Lauder Equity Research Report
Estée Lauder Equity Research ReportAlexander Lai
 
3'c Report (Johnson & Johnson, Proctor And Gamble, Amway)
3'c Report (Johnson & Johnson, Proctor And Gamble, Amway) 3'c Report (Johnson & Johnson, Proctor And Gamble, Amway)
3'c Report (Johnson & Johnson, Proctor And Gamble, Amway) Shivam Jain
 
Target Corporation PPP
Target Corporation PPPTarget Corporation PPP
Target Corporation PPPDanGilbreth
 
Amcon Distributing Final
Amcon Distributing FinalAmcon Distributing Final
Amcon Distributing Finallesterlie88
 
Freedom Plan 5[1]
Freedom Plan 5[1]Freedom Plan 5[1]
Freedom Plan 5[1]suzankreed
 
Colgate Palmolive project
Colgate Palmolive projectColgate Palmolive project
Colgate Palmolive projectArfanHaider
 
DR-PEPPER-SNAPPLE-GROUP
DR-PEPPER-SNAPPLE-GROUPDR-PEPPER-SNAPPLE-GROUP
DR-PEPPER-SNAPPLE-GROUPMamuna Tahiri
 
Company Presentation Starubucks Fin4414
Company Presentation Starubucks Fin4414Company Presentation Starubucks Fin4414
Company Presentation Starubucks Fin4414adrianai
 
US Personal Care and Consumer Healthcare (OTC) Market and M&A highlights
US Personal Care and Consumer Healthcare (OTC) Market and M&A highlightsUS Personal Care and Consumer Healthcare (OTC) Market and M&A highlights
US Personal Care and Consumer Healthcare (OTC) Market and M&A highlightsPete Chatziplis
 

Similar to Altria Analysis- Cassie Pennington (20)

Coca cola 2
Coca cola 2Coca cola 2
Coca cola 2
 
Traci's vs. new team elites ppt aug 2011
Traci's vs. new team elites ppt aug 2011 Traci's vs. new team elites ppt aug 2011
Traci's vs. new team elites ppt aug 2011
 
Globalisation And The Coca-Cola Company
Globalisation And The Coca-Cola CompanyGlobalisation And The Coca-Cola Company
Globalisation And The Coca-Cola Company
 
2016Corporate ProfileTootsie Roll Industries, Inc. h.docx
2016Corporate ProfileTootsie Roll Industries, Inc. h.docx2016Corporate ProfileTootsie Roll Industries, Inc. h.docx
2016Corporate ProfileTootsie Roll Industries, Inc. h.docx
 
Estée Lauder Equity Research Report
Estée Lauder Equity Research ReportEstée Lauder Equity Research Report
Estée Lauder Equity Research Report
 
3'c Report (Johnson & Johnson, Proctor And Gamble, Amway)
3'c Report (Johnson & Johnson, Proctor And Gamble, Amway) 3'c Report (Johnson & Johnson, Proctor And Gamble, Amway)
3'c Report (Johnson & Johnson, Proctor And Gamble, Amway)
 
Target Corporation PPP
Target Corporation PPPTarget Corporation PPP
Target Corporation PPP
 
Starbucks Case Study
Starbucks Case StudyStarbucks Case Study
Starbucks Case Study
 
Coca cola csr report
Coca cola csr report Coca cola csr report
Coca cola csr report
 
Amcon Distributing Final
Amcon Distributing FinalAmcon Distributing Final
Amcon Distributing Final
 
P&g
P&gP&g
P&g
 
P&g
P&gP&g
P&g
 
p&g
p&gp&g
p&g
 
Freedom Plan 5[1]
Freedom Plan 5[1]Freedom Plan 5[1]
Freedom Plan 5[1]
 
SAC-Monster
SAC-MonsterSAC-Monster
SAC-Monster
 
Colgate Palmolive project
Colgate Palmolive projectColgate Palmolive project
Colgate Palmolive project
 
DR-PEPPER-SNAPPLE-GROUP
DR-PEPPER-SNAPPLE-GROUPDR-PEPPER-SNAPPLE-GROUP
DR-PEPPER-SNAPPLE-GROUP
 
Company Presentation Starubucks Fin4414
Company Presentation Starubucks Fin4414Company Presentation Starubucks Fin4414
Company Presentation Starubucks Fin4414
 
Zija Zija Corporate Overview 2010
Zija Zija Corporate Overview 2010Zija Zija Corporate Overview 2010
Zija Zija Corporate Overview 2010
 
US Personal Care and Consumer Healthcare (OTC) Market and M&A highlights
US Personal Care and Consumer Healthcare (OTC) Market and M&A highlightsUS Personal Care and Consumer Healthcare (OTC) Market and M&A highlights
US Personal Care and Consumer Healthcare (OTC) Market and M&A highlights
 

Altria Analysis- Cassie Pennington

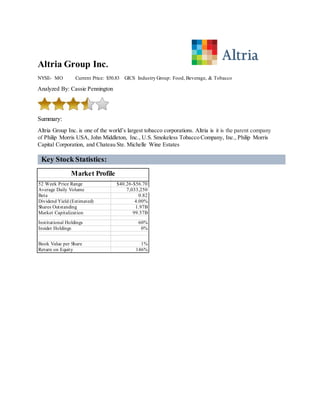
  • 1. Altria Group Inc. NYSE- MO Current Price: $50.83 GICS Industry Group: Food, Beverage, & Tobacco Analyzed By: Cassie Pennington Summary: Altria Group Inc. is one of the world’s largest tobacco corporations. Altria is it is the parent company of Philip Morris USA, John Middleton, Inc., U.S. Smokeless Tobacco Company, Inc., Philip Morris Capital Corporation, and Chateau Ste. Michelle Wine Estates Key Stock Statistics: 52 Week Price Range $40.26-$56.70 Average Daily Volume 7,033,250 Beta 0.82 Dividend Yield (Estimated) 4.00% Shares Outstanding 1.97B Market Capitalization 99.57B Institutional Holdings 60% Insider Holdings 0% Book Value per Share 1% Return on Equity 146% Market Profile
  • 2. . CORPORATE OVERVIEW. The Virginia based company Altria Group Inc., is one of the world’s largest tobacco corporations. The diversified company operates its business in three segments: smokeable products, smokeless products, and wine. Altria Group Inc. is the parent company of Phillip Morris USA, John Middleton Co., U.S. Smokeless Tobacco Company Inc., Phillip Morris Capital Corporation, and Chateau Ste. Michelle Wine Estates. Altria Group Inc. sells their products in all 50 states and nations worldwide. TOBACCO Altria Group Inc. is involved in two sectors of the tobacco industry: smokeable and smokeless. Phillip Morris USA Inc. predominately focuses on the manufacturing and sale of cigarettes in the United States; John Middleton Co., a wholly-owned subsidiary of Phillip Morris USA Inc., manufactures and sells machine-made large cigars and pipe tobacco; U.S. Smokeless Tobacco Company Inc. manufactures and sells all smokeless tobacco products.  Cigarettes: Phillip Morris USA Inc. is the largest cigarette company in the United States with an annual shipment volume of approximately 125.4 billion units of cigarettes in 2014 (a decrease of 3% since 2013). For the past 35 years,Phillip Morris USA Inc.’s brand Marlboro has been the largest-selling cigarette brand in the United States.  Cigars: John Middleton Co. manufactures and sells machine-made cigars and pipe tobacco. Their approximate annual shipment volume is 1.3 billion units as of 2014 (an increase of 6.1% from 2013). John Middleton Co.’s most principal cigar brand is Black and Mild.  SmokelessTobacco: U.S. Smokeless Tobacco Company Inc. is the leading producer in chewing tobacco (also known as moist smokeless tobacco or “MST”). The premium brands for smokeless tobacco include Copenhagen and Skoal and value brands, Red Seal, Husky, and Business Description
  • 3. Marlboro Snus. The total shipment volume for smokeless tobacco in 2014 was 793.3 million units (an increase of 0.7% since 2013). ALCOHOL Altria Group Inc. is also involved in the alcohol industry. Ste. Michelle Wine Estates produces various premium table wines. Ste. Michelle Wine Estates is the leading producer of Washington state wines, more importantly Chateau Ste. Michelle,Columbus Crest, and 14 Hands. They also own or distribute many domestic and foreign wineries. The total shipment volume for Ste. Michelle in 2014 was 8.4 million cases (an increase of 4.8% since 2013). MANAGEMENT Altria Group Inc. is operated by approximately 9,000 hourly and salaried employees. Altria Group Inc.’s board of directors is made of 7 members:  Martin J. Barrington- Chairman, ChiefExecutive Officer and President, Richmond, VA  Gerald L. Baliles- Retired Director and ChiefExecutive Officer, Miller Center ofPublic Affairs, Charlottesville, VA  Thomas F. Farrell II- Chairman, President and ChiefExecutive Officer, Dominion Resources,Inc., Richmond, VA  Thomas W. Jones- Senior Partner, TWJ Capital LLC, Stamford, CT  W. Leo Kiely III- Retired ChiefExecutive Officer, MillerCoors LLC, Golden, CO  George Muñoz- Principal, Muñoz Investment Banking Group, LLC, Washington, DC, Partner, Tobin & Muñoz, Chicago, IL  Nabil Y. Sakkab- Retired Senior Vice President, Corporate Research and Development, The Procter & Gamble Company, Cincinnati, OH Altria Group Inc. is part of the food, beverage, and tobacco industry. Currently Altria Group Inc. is more dependent on foreign sales in comparison to domestic sales. For example, most Asian cultures have high rates of smokers. According to the World Health Organization (WHO), 67% of men in China, 51% of men smoke in Japan, and 67% of men in the Republic of Korea. In the United States, however, a large amount of consumers have switched over to vaping or e-cigarettes as an alternative. Industry Analysis
  • 4. HOLT’S MODEL Comparing Altria Group to its industry, I used a dividend yield of 4.00% and an industry forward P/E Ratio of 25.76. For the company growth rates, I used a below historical growth rate of 6% for the pessimistic scenario, the historical growth rate of 10% for the moderate scenario, and a growth rate of 15% for the optimistic scenario should the United States enter into a boom period within the next two years. Altria Group dividend yield is 4.00%, and the expected earnings for 2015 are $2.79. Using the average of all three scenarios, the Holt’s Model values Altria Group Inc. at $62.35 compared to its competitor, Reynolds American Inc. Therefore, Altria Group Inc. is undervalued. I recommend buying Altria Group Inc. CAPITAL ASSET PRICING MODEL Using the capital asset pricing model or CAPM, Altria Group Inc. is valued at 9.86 which is above the market return of 8.5 indicating that investing in Altria Group Inc. would be a wise investment. Valuation and Recommendation
  • 5. Holt’s Model Competitor: Reynolds American, Inc. (NYSE: RAI) Pessimistic Growth = 6% 9692.0 035.10.01 04.006.01          WAB TRN PE PE Fair PE = (0.9692)(25.76) = $24.9666 Estimated EPSTRN 2015 = $2.49 Fair Value = (24.9666)(2.49) = $62.17 Moderate Growth = 10% 9620.0 035.015.01 04.010.01          WAB TRN PE PE Fair PE = (0.9620)(25.76) = 24.28 Estimated EPSTRN 2015 = $2.49 Fair Value = (24.28)(2.49) = $60.46 Optimistic Growth = 15% 0042.1 035.015.01 04.015.01          WAB TRN PE PE Fair PE = (1.0042)(25.76) = 25.87 Estimated EPSTRN2015 = $2.49 Fair Value = (25.87)(2.49) = $64.42 Average FairValue: $62.35
  • 6. CAPM Model Risk-free Rate = 2.31% Beta = 0.82 Market Return = 8.5% K = 2.31% + 0.82*(8.5% - 2.04%) K = 9.86% Income Statement- In Millions ofUSD (except for per share items) 3 month s ending 2015- 03-31 3 month s ending 2014- 12-31 3 month s ending 2014- 09-30 3 month s ending 2014- 06-30 3 month s ending 2014- 03-31 Revenue 5,804. 00 6,258. 00 6,491. 00 6,256. 00 5,517. 00 Other Revenue, Total - - - - - Total Revenue 5,804. 00 6,258. 00 6,491. 00 6,256. 00 5,517. 00 Cost of Revenue, Total 3,329. 00 3,631. 00 3,817. 00 3,653. 00 3,261. 00
  • 7. Income Statement- In Millions ofUSD (except for per share items) 3 month s ending 2015- 03-31 3 month s ending 2014- 12-31 3 month s ending 2014- 09-30 3 month s ending 2014- 06-30 3 month s ending 2014- 03-31 Gross Profit 2,475. 00 2,627. 00 2,674. 00 2,603. 00 2,256. 00 Selling/General/Admin. Expenses, Total 610.0 0 718.0 0 663.0 0 638.0 0 520.0 0 Research & Development - - - - - Depreciation/Amortization - - - - - Interest Expense(Income) - Net Operating - - - - - Unusual Expense (Income) 228.0 0 41.00 12.00 -10.00 2.00 Other Operating Expenses, Total - - - - - Total Operating Expense 4,167. 00 4,390. 00 4,492. 00 4,281. 00 3,783. 00 Operating Income 1,637. 00 1,868. 00 1,999. 00 1,975. 00 1,734. 00 Interest Income(Expense), Net Non-Operating - - - - - Gain (Loss) on Sale of Assets - - - - - Other, Net - - - - - Income Before Tax 1,562. 00 1,909. 00 2,114. 00 1,945. 00 1,806. 00 Income After Tax 1,018. 00 1,236. 00 1,397. 00 1,262. 00 1,175. 00 Minority Interest 0.00 0.00 0.00 0.00 0.00 Equity In Affiliates - - - - - Net Income Before Extra. Items 1,018. 00 1,236. 00 1,397. 00 1,262. 00 1,175. 00
  • 8. Income Statement- In Millions ofUSD (except for per share items) 3 month s ending 2015- 03-31 3 month s ending 2014- 12-31 3 month s ending 2014- 09-30 3 month s ending 2014- 06-30 3 month s ending 2014- 03-31 Accounting Change - - - - - Discontinued Operations - - - - - Extraordinary Item - - - - - Net Income 1,018. 00 1,236. 00 1,397. 00 1,262. 00 1,175. 00 Preferred Dividends - - - - - Income Available to Common Excl. Extra Items 1,016. 00 1,233. 00 1,394. 00 1,259. 00 1,172. 00 Income Available to Common Incl. Extra Items 1,016. 00 1,233. 00 1,394. 00 1,259. 00 1,172. 00 Basic Weighted Average Shares - - - - - Basic EPS Excluding Extraordinary Items - - - - - Basic EPS Including Extraordinary Items - - - - - Dilution Adjustment - - - - - Diluted Weighted Average Shares 1,966. 00 1,969. 00 1,976. 00 1,980. 00 1,986. 00 Diluted EPS Excluding Extraordinary Items 0.52 0.63 0.71 0.64 0.59 Diluted EPS Including Extraordinary Items - - - - - Dividends per Share - Common Stock Primary Issue 0.52 0.52 0.52 0.48 0.48 Gross Dividends - Common Stock - - - - - Net Income after Stock Based Comp. Expense - - - - - Basic EPS after Stock Based Comp. Expense - - - - -
  • 9. Income Statement- In Millions ofUSD (except for per share items) 3 month s ending 2015- 03-31 3 month s ending 2014- 12-31 3 month s ending 2014- 09-30 3 month s ending 2014- 06-30 3 month s ending 2014- 03-31 Diluted EPS after Stock Based Comp. Expense - - - - - Depreciation, Supplemental - - - - - Total Special Items - - - - - Normalized Income Before Taxes - - - - - Effect of Special Items on Income Taxes - - - - - Income Taxes Ex. Impact of Special Items - - - - - Normalized Income After Taxes - - - - - Normalized Income Avail to Common - - - - - Basic Normalized EPS - - - - - Diluted Normalized EPS 0.62 0.65 0.71 0.64 0.59 Balance Sheet- In Millions of USD (except for per share items) As of 2015- 03-31 As of 2014- 12-31 As of 2014- 09-30 As of 2014- 06-30 As of 2014- 03-31 Cash & Equivalents 3,674. 00 3,321. 00 2,241. 00 1,193. 00 3,620. 00 Short Term Investments - - - - - Cash and Short Term Investments 3,674. 00 3,321. 00 2,241. 00 1,193. 00 3,620. 00 Accounts Receivable - Trade, Net 172.00 124.00 106.00 105.00 113.00 Receivables - Other - - - - - Total Receivables, Net 172.00 124.00 106.00 105.00 113.00
  • 10. Balance Sheet- In Millions of USD (except for per share items) As of 2015- 03-31 As of 2014- 12-31 As of 2014- 09-30 As of 2014- 06-30 As of 2014- 03-31 Total Inventory 2,085. 00 2,040. 00 1,890. 00 1,850. 00 1,970. 00 Prepaid Expenses - - - - - Other Current Assets, Total 1,302. 00 1,393. 00 1,425. 00 1,327. 00 1,274. 00 Total Current Assets 7,233. 00 6,878. 00 5,662. 00 4,475. 00 6,977. 00 Property/Plant/Equipment, Total - Gross 4,784. 00 4,755. 00 4,851. 00 4,816. 00 4,828. 00 Accumulated Depreciation, Total - 2,812. 00 - 2,772. 00 - 2,853. 00 - 2,819. 00 - 2,825. 00 Goodwill, Net 5,285. 00 5,285. 00 5,285. 00 5,285. 00 5,174. 00 Intangibles, Net 12,044 .00 12,049 .00 12,054 .00 12,059 .00 12,053 .00 Long Term Investments 7,210. 00 7,797. 00 8,413. 00 8,816. 00 8,608. 00 Other Long Term Assets, Total 468.00 483.00 670.00 650.00 591.00 Total Assets 34,212 .00 34,475 .00 34,082 .00 33,282 .00 35,406 .00 Accounts Payable 274.00 416.00 332.00 311.00 321.00 Accrued Expenses 6,113. 00 5,229. 00 4,704. 00 3,781. 00 5,788. 00 Notes Payable/Short Term Debt 0.00 0.00 0.00 0.00 0.00 Current Port. of LT Debt/Capital Leases 1,000. 00 1,000. 00 1,300. 00 0.00 0.00 Other Current liabilities, Total 1,508. 00 1,028. 00 1,031. 00 954.00 1,475. 00
  • 11. Balance Sheet- In Millions of USD (except for per share items) As of 2015- 03-31 As of 2014- 12-31 As of 2014- 09-30 As of 2014- 06-30 As of 2014- 03-31 Total Current Liabilities 8,895. 00 7,673. 00 7,367. 00 5,046. 00 7,584. 00 Long Term Debt 12,901 .00 13,693 .00 12,693 .00 13,993 .00 13,992 .00 Capital Lease Obligations - - - - - Total Long Term Debt 12,901 .00 13,693 .00 12,693 .00 13,993 .00 13,992 .00 Total Debt 13,901 .00 14,693 .00 13,993 .00 13,993 .00 13,992 .00 Deferred Income Tax 5,907. 00 6,088. 00 6,829. 00 6,970. 00 6,908. 00 Minority Interest 29.00 31.00 32.00 32.00 32.00 Other Liabilities, Total 3,947. 00 3,976. 00 2,867. 00 2,846. 00 2,775. 00 Total Liabilities 31,679 .00 31,461 .00 29,788 .00 28,887 .00 31,291 .00 Redeemable Preferred Stock, Total - - - - - Preferred Stock - Non Redeemable, Net - - - - - Common Stock, Total 935.00 935.00 935.00 935.00 935.00 Additional Paid-In Capital 5,754. 00 5,735. 00 5,723. 00 5,692. 00 5,678. 00 Retained Earnings (Accumulated Deficit) 26,271 .00 26,277 .00 26,066 .00 25,698 .00 25,388 .00 Treasury Stock - Common - 27,482 .00 - 27,251 .00 - 26,976 .00 - 26,701 .00 - 26,568 .00 Other Equity, Total - 2,945. 00 - 2,682. 00 - 1,454. 00 - 1,229. 00 - 1,318. 00
  • 12. Balance Sheet- In Millions of USD (except for per share items) As of 2015- 03-31 As of 2014- 12-31 As of 2014- 09-30 As of 2014- 06-30 As of 2014- 03-31 Total Equity 2,533. 00 3,014. 00 4,294. 00 4,395. 00 4,115. 00 Total Liabilities & Shareholders' Equity 34,212 .00 34,475 .00 34,082 .00 33,282 .00 35,406 .00 Shares Outs - Common Stock Primary Issue - - - - - Total Common Shares Outstanding 1,967. 16 1,971. 47 1,977. 01 1,983. 45 1,986. 72 Citations: Finance.yahoo.com Bloomberg.com WHO.org Nasdaq.com Altria.com Morningstar.com Google.com/finance