More Related Content
Similar to Btfg s&p report
Similar to Btfg s&p report (20)
Btfg s&p report
- 1. Quantitative Stock Report
BancTrust Financial Group Apr 3,2010
NNM SYMBOL:BTFG
S&P Quality Ranking: C Standard & Poor's Fair Value Rank : NR
Sector: Financials Summary: This company, through its BankTrust subsidiary banks, provides various banking and related
Sub-Industry: Regional Banks services in southern Alabama and northwest Florida.
Peer Group: Southeast Smaller Regional Banks
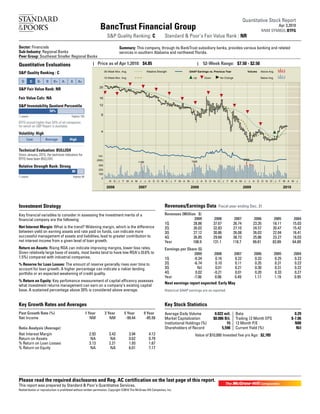
Quantitative Evaluations | Price as of Apr 1,2010: $4.85 | 52-Week Range: $7.50 - $2.50
30-Week Mov. Avg. Relative Strength GAAP Earnings vs. Previous Year Volume Above Avg.
S&P Quality Ranking : C
10-Week Mov. Avg. Up Down No Change Below Avg.
D C B- B B+ A- A A+
25
S&P Fair Value Rank: NR
Fair Value Calc: NA 16
S&P Investability Quotient Percentile 12
59%
1 Lowest Highest 100
8
BTFG scored higher than 59% of all companies
for which an S&P Report is available.
4
Volatility: High
Low Average High
Technical Evaluation: BULLISH
Since January, 2010, the technical indicators for Vol.
BTFG have been BULLISH. (000) 2786
1169 1548
Relative Strength Rank: Strong 300
200
89
100
1 Lowest Highest 99
0
N D J F M A M J J A S O N D J F M A M J J A S O N D J F M A M J J A S O N D J F M A M J
2006 2007 2008 2009 2010
Investment Strategy Revenues/Earnings Data Fiscal year ending Dec. 31
Key financial variables to consider in assessing the investment merits of a Revenues (Million $)
financial company are the following: 2009 2008 2007 2006 2005 2004
1Q 28.86 37.67 26.74 23.35 18.11 15.03
Net Interest Margin: What is the trend? Widening margin, which is the difference 2Q 26.02 32.83 27.10 24.57 20.47 15.42
between yield on earning assets and rate paid on funds, can indicate more 3Q 27.12 30.86 26.08 26.03 22.04 16.41
successful management of assets and liabilities, lead to greater contribution to 4Q 26.85 29.68 38.73 25.86 23.27 18.03
net interest income from a given level of loan growth. Year 108.9 131.1 118.7 99.81 83.89 64.89
Return on Assets: Rising ROA can indicate improving margins, lower loss rates. Earnings per Share ($)
Given relatively large base of assets, most banks tend to have low ROA's (0.6% to 2009 2008 2007 2006 2005 2004
1.5%) compared with industrial companies. 1Q -0.34 0.16 0.22 0.33 0.25 0.23
% Reserve for Loan Losses: The amount of reserve generally rises over time to 2Q -6.74 0.10 0.11 0.35 0.31 0.23
account for loan growth. A higher percentage can indicate a riskier lending 3Q Nil 0.01 0.21 0.30 0.31 0.22
portfolio or an expected weakening of credit quality. 4Q 0.02 -0.21 0.01 0.20 0.33 0.27
Year -7.06 0.06 0.49 1.17 1.19 0.95
% Return on Equity: Key perfomance measurement of capital efficency assesses
Next earnings report expected: Early May
what investment returns management can earn on a company's existing capital
base. A sustained percentage above 20% is considered above average. Historical GAAP earnings are as reported.
Key Growth Rates and Averages Key Stock Statistics
Past Growth Rate (%) 1 Year 3 Year 5 Year 9 Year Average Daily Volume 0.022 mil. Beta 0.29
Net Income NM NM -99.44 -85.58 Market Capitalization $0.086 Bil. Trailing 12 Month EPS $-7.06
Institutional Holdings (%) 15 12 Month P/E NM
Ratio Analysis (Average) Shareholders of Record 5,590 Current Yield (%) Nil
Net Interest Margin 2.93 3.43 3.94 4.12 Value of $10,000 Invested five yrs Ago : $2,785
Return on Assets NA NA 0.62 0.79
% Return on Loan Losses 3.13 2.21 1.93 1.67
% Return on Equity NA NA 6.01 7.17
Please read the required disclosures and Reg. AC certification on the last page of this report.
This report was prepared by Standard & Poor's Quantitative Services.
Redistribution or reproduction is prohibited without written permission. Copyright ©2010 The McGraw-Hill Companies, Inc.
- 2. Quantitative Stock Report
BancTrust Financial Group Apr 3,2010
NNM SYMBOL:BTFG
S&P Quality Ranking: C Standard & Poor's Fair Value Rank : NR
Stock Performance
Insider Moves 160
Insider Buys Insider Sells Price History
140
9 10 120
7 6
5 5 5 5 5 5
3
1 100
May Jun Jul Aug Sep Oct Nov Dec Jan '10 Feb Mar 80
Dividend Data Dividend have been paid since 1993 60
Amount($) Date Decl. Ex. Div. Date Stock of Record Payment Date 40
0.010 May.4 Jun.11 Jun.15 Jul.01 '09
20
0
2006 2007 2008 2009 2010
BTFG S&P 1500 Regional Banks
Company(%) Industry(%) S&P 1500(%)
YTD Return 69.0 23.2 6.1
One Year Return -30.7 61.0 47.0
Three Year Return (% Annualized) -37.0 -24.1 -5.7
Five Year Return (% Annualized) -22.6 -13.4 0.5
Value of $10,000 Invested 5 Years Ago $2,785 $4,860 $10,249
Company Financials Fiscal year ending Dec. 31
Per Share Data & Valuation Ratios ($) 2009 2008 2007 2006 2005 2004 2003 2002 2001 2000
Tangible Book Value NA NA 8.09 8.38 7.66 6.87 NM 8.59 8.20 7.88
Earnings -7.06 0.06 0.49 1.17 1.19 0.95 0.71 0.84 0.73 0.87
Dividends 0.03 0.52 0.52 0.52 0.52 0.65 0.52 0.48 0.44 0.40
Payout Ratio NM NM 106% 44% 44% 68% 73% 57% 60% 46%
Prices:High 14.95 16.85 25.75 28.25 24.90 24.75 18.21 12.51 15.06 13.00
Prices:Low 2.50 5.71 11.16 19.70 17.01 15.85 10.90 9.27 8.31 7.38
P/E Ratio:High NM NM 53 24 21 26 26 15 21 15
P/E Ratio:Low NM NM 23 17 14 17 15 11 11 8
Income Statement Analysis (Million $)
Net Interest Income NA 60.9 53.8 52.3 52.0 41.3 25.3 24.1 22.6 24.0
Tax Equivalent Adjustment NA NA NA NA NA NA NA NA NA NA
Non Interest Income 22.9 23.0 14.6 11.7 10.9 10.4 7.65 6.68 6.17 5.39
Loan Loss Provision NA 15.3 12.4 4.59 5.73 4.02 2.08 0.96 1.79 1.24
% Expense/Operating Revenue NA NA 70% 62% 59% 65% 69% 66% 64% 60%
Pretax Income -136 0.96 8.19 19.6 20.0 14.8 8.80 10.4 8.74 10.5
Effective Tax Rate 11% NM 25% 32% 34% 29% 28% 29% 29% 29%
Net Income -121 1.26 6.19 13.3 13.3 10.6 6.32 7.32 6.23 7.45
% Net Interest Margin 2.93% 3.40% 3.95% 4.61% 4.80% 4.50% 4.21% 4.29% 4.42% 4.89%
Balance Sheet & Other Financial Data (Million $)
Money Market Assets NA NA 70.6 71.4 32.4 6.41 NA 14.1 18.0 11.6
Investment Securities NA NA 246 118 132 152 NA 185 146 140
Commercial Loans NA 350 381 196 169 346 409 220 165 159
Other Loans NA NA 1,259 804 819 559 NA 198 218 221
Total Assets 1,947 2,088 2,240 1,353 1,305 1,191 1,077 666 592 577
Demand Deposits NA 481 242 174 219 187 272 100 132 89.4
Time Deposits NA NA 1,586 930 822 800 NA 463 270 397
Long Term Debt NA 113 137 95.5 110 50.0 Nil 6.00 Nil 6.00
Common Equity 116 243 250 139 131 122 117 80.9 73.9 70.8
% Return on Assets NM 0.1 0.3 1.0 1.1 0.9 0.7 1.2 1.1 1.3
% Return on Equity NM 0.5 3.2 9.8 10.5 8.8 6.4 9.5 8.6 11.0
% Loan Loss Reserve 3.1 2.0 1.5 1.6 1.4 1.1 1.3 1.5 1.4 1.2
% Loans/Deposits 88.8 92.3 89.7 91.0 95.3 91.6 84.9 74.2 76.2 77.7
% Equity to Assets NA 11.4 10.8 10.1 10.1 10.5 NA 12.3 12.4 11.9
Data as orig. reptd; bef. results of disc opers/spec. items. Per share data adj. for stk. divs. as of ex-div date. NA-Not Available. NM-Not Meaningful. NR-Not Ranked.
Office: 100 St. Joseph Street, Mobile, AL, 36652 Dirs: T. T. Conerly, S. G. Crawford, D. C. De Laney, B. G. Garrett, Jr., C. F. COO: T. H. Harbin
Tel: 251-431-7800 Gordy, B. E. Gritter, J. M. Harrison, Jr., C. C. Inge, Jr., K. S. Johnson, W. B. EVP: B. C. Finley, Jr.
Website: http://www.banctrustfinancialgroupinc.com Lamar, Jr., J. H. Lewis, Jr., H. V. Morrissette, P. D. Owens, Jr., M. A. EVP: F. W. Taul
Pres & CEO: W. B. Lamar, Jr. Patterson, P. C. Sherman, D. A. Wallace Founded: 1985
Secy, EVP, CFO, Chief Acctg Officer & Investor Contact: F. M. Domicile: Alabama
Johnson(251-431-7813) Employees: 621
Source: S&P, I/B/E/S International, Inc. Redistribution or reproduction is prohibited without written permission. Copyright ©2010 The McGraw-Hill
Companies,Inc.
- 3. Quantitative Stock Report
BancTrust Financial Group Apr 3,2010
NNM SYMBOL:BTFG
S&P Quality Ranking: C Standard & Poor's Fair Value Rank : NR
Glossary Required Disclosures
S&P Quality Ranking - Growth and stability of Fair Value Calculation - The current price at which All of the views expressed in this research report
earnings and dividends are deemed key elements in a stock should sell today as calculated by S&P's reflect Standard & Poor's Quantitative Services'
establishing S&P's quality ranking for common computers using our quantitative model based on research models regarding the above issuer and
stocks, which are designed to capsulize the nature the company's earnings, growth potential, return on securities. No part of Standard & Poor's
of this record in a single symbol. It should be noted equity relative to the S&P 500 and its industry group, Quantitative Services compensation was, is or will
that, however, that the process also takes into price to book ratio history, current yield relative to be directly or indirectly, related to the specific
consideration certain adjustments and modifications the S&P 500, and other factors. recommendations or views expressed in this
deemed desirable in establishing such rankings, The research report.
Investability Quotient (IQ) - The IQ is a measure of
final score for each stock is measured against a investment desirability. It serves as an indicator of This report was prepared by Standard & Poor's
scoring matrix determined by analysis of the scores potential medium-to-long-term return and as a Quantitative Services ("SPQS"). SPQS is affiliated
of a large and representative sample of stocks. The caution against downside risk. The measure takes with various entities that may perform
range of scores in the array of this sample has been into account variables such as technical indicators, non-investment banking services for this company.
aligned with the following ladder of rankings: earnings estimates, liquidity, financial ratios and Each such affiliate operates independently from
A+ Highest B Lower selected S&P proprietary measures. each other.
A High B- Below Average Additional information is available upon request.
Standard & Poor's IQ Rationale:
A- Above Average C Lowest
BancTrust Financial Group Disclaimer
B+ Average D In Reorganization
Raw Score Max Value
NR Not Ranked This material is based upon information that we
Proprietary S&P Measures 0 115
S&P Fair Value Rank - Using S&P's exclusive consider to be reliable, but neither SPQS nor its
Technical Indicators 12 40
proprietary quantitative model, stocks are ranked in affiliates warrant its completeness or accuracy, and
Liquidity/Volatility Measures 9 20
one of five groups, ranging from Group 5, listing the it should not be relied upon as such. Assumptions,
Quantitative Measures 71 75
most undervalued stocks, to Group 1, the most opinions and estimates constitute our judgment as
IQ Total 92 250 of the date of this material and are subject to
overvalued issues. Group 5 stocks are expected to
generally outperform all others. A positive (+) or Volatility - Rates the volatility of the stock's price change without notice. Past performance is not
negative (-) Timing Index is placed next to the Fair over the past year. indicative of future results.
Value ranking to further aid the selection process. A Technical Evaluation - In researching the past This material is not intended as an offer or
stock with a (+) added to the Fair Value Rank simply market history of prices and trading volume for each solicitation for the purchase or sale so any security
means that this stock has a somewhat better company, S&P's computer models apply special or other financial instrument. Securities, financial
chance to outperform other stock with the same Fair technical methods and formulas to identify and instruments or strategies mentioned herein may not
Value Rank. A stock with a (-) has a somewhat project price trends for the stock. be suitable for all investors. This material does not
lesser chance to outperform other stocks with the Relative Strength Rank - Shows, on a scale of 1 to take into account your particular investment
same Fair Value Rank. The Fair Value rankings imply 99, how the stock has performed versus all other objectives, financial situations or needs and is not
the following: 5-Stock is significantly undervalued; companies in S&P's universe on a rolling 13-week intended as a recommendation of particular
Fair Value Rank. A stock with a (-) has a somewhat basis. securities, financial instruments or strategies to you.
lesser chance to outperform other stocks with the Before acting on any recommendation in this
Global Industry Classification Standard (GICS) - An
same Fair Value Rank. The Fair Value rankings imply material, you should consider whether it is suitable
industry classification standard, developed by
the following: 5-Stock is significantly undervalued; for your particular circumstances and, if necessary,
Standard & Poor's in collaboration with Morgan
4-Stock is moderately undervalued; 3-Stock is fairly seek professional advice.
Stanley Capital International (MSCI). GICS is
valued; 2-Stock is modestly overvalued; 1-Stock is currently comprised of 10 Sectors, 24 Industry
significantly overvalued. Groups , 67 Industries, and 147 Sub-Industries.
Funds From Operations (FFO) - FFO is Funds from
Operations and equal to a REIT's net income, Dividends on American Depository Receipts (ADRs)
excluding gains or losses from sales of property, and American Depository Shares (ADSs) are net of
plus real estate depreciation. taxes (paid in the country of origin).
Source: S&P, Company Reports.
Redistribution or reproduction is prohibited without written permission. Copyright ©2010 The McGraw-Hill Companies,Inc.