SlideShare a Scribd company logo
1 of 11
Download to read offline
Enter Here The Companies You Want To Study
1. Enter a company name, part of a company name, or ticker in column A. Hit F9 to calculate. Enter your log in info.
2. If you see "NA" in column B, use the CSRHub name lookup tool (top menu, CSRHub…Company) to find the right text to put in column A.
3. If you want to change the effective date, go to the Date Setup tab and change cell B11.
Ratings Date 12/1/2015
Top Line Summary 5 Companies 59 68% 77% 62% 51%
Enter Name,
Ticker, or Brand
CSRHub Official Name
Overall
Rating
Overall
Percentile
Rank
Energy &
Climate
Change
Environment
Policy &
Reporting
Resource
Management
Industry Country
# of
Sources
Deutsche Post AG Deutsche Post AG 64 90% 91% 80% 60% Air Freight, Couriers & Moving Companies Germany 40
HENKEL KGAA HENKEL KGAA 68 97% 94% 82% 81% Household Products Germany 38
Apple Apple Inc. 55 50% 80% 63% 64% Communications Equipment Manufacturing USA 60
BT Group PLC BT Group PLC 69 98% 93% 78% 47% Telecommunications United Kingdom 36
Amazon.com, Inc. Amazon.com, Inc. 42 3% 25% 5% 3% Electronic Shopping and Mail‐Order Houses USA 38
Environment Percentile Ranks
Averages
NA = Rating or information not available.  We also 
do not provide an overall score for partially rated 
companies.
5/24/2016
Subscribe at www.csrhub.com for access to the CSRHub Dashboard
CSRHub Dashboard Carbon ‐ Copyright © 2016 CSRHub
Dashboard created 2016‐02‐23 1
Quick Diagnostic
(Summary of Carbon‐Related Data for this set of companies)
Yes 4 5 5 5
No 1 0 0 0
% Yes 80% 100% 100% 100%
Average 77% 72% 75% 42.4 19.2 3.4 6.8 3.6
Company
Versus All
Companies
Versus
Same
Industry
Versus
Same
Country
# of
Sources
# of
Reporting
Systems
# of
Orgs
and
Awards
# of Policy
Indicators
# of
Reported
Facts
CDP?
(Past 3
years)
ET
Global
Index
MSCI
ESG
CarbonM
etrics
Trucost
Deutsche Post AG 91% 80% 81% 40 19 4 16 6 Yes Yes Yes Yes
HENKEL KGAA 94% 91% 88% 38 19 5 8 1 Yes Yes Yes Yes
Apple Inc. 80% 70% 87% 60 21 4 1 3 Yes Yes Yes Yes
BT Group PLC 93% 93% 89% 36 19 3 9 8 Yes Yes Yes Yes
Amazon.com, Inc. 25% 25% 29% 38 18 1 0 0 No Yes Yes Yes
Energy & Climate Change Model Est. Avail?
NA = Rating or information not available.  We also do not 
provide an overall score for partially rated companies.
5/24/2016
Subscribe at www.csrhub.com for access to the CSRHub Dashboard
CSRHub Dashboard Carbon ‐ Copyright © 2016 CSRHub
Dashboard created 2016‐02‐23
Carbon-Related Reporting Systems
(Companies typically must submit data or respond to a questionaire for each of these sources.)
Yes 5 0 4 4 3 5 3 4 0 0 5 5 0 5 0 5 5 5 5 5 5 2 2 2 2 5 5 5
No 0 5 1 1 2 0 2 1 5 5 0 0 5 0 5 0 0 0 0 0 0 3 3 3 3 0 0 0
% Yes 100% 0% 80% 80% 60% 100% 60% 80% 0% 0% 100% 100% 0% 100% 0% 100% 100% 100% 100% 100% 100% 40% 40% 40% 40% 100% 100% 100%
29 Different Reporting Systems
Company
Simple
Count
Asset4
B
Corporation
G
IIRS
Ratings
Carbon
D
isclosure
Project2009
FullD
ata
Carbon
D
isclosure
Project2010
FullD
ata
Carbon
D
isclosure
Project2011
FullD
ata
Carbon
D
isclosure
Project2012
FullD
ata
Carbon
D
isclosure
Project2013
FullD
ata
Carbon
D
isclosure
Project2014
FullD
ata
Carbon
M
arketD
ata
CR’s
100
BestCorporate
Citizens
2014
EIRIS
Environm
entalInvestm
ent
O
rganisation
EPA
e-G
G
RT
2011
ET
G
lobalIndex
Interfax
ERA
2012
M
SCI
ESG
CarbonM
etrics
M
SCI
ESG
Intangible
Value
Assessm
ent
New
sw
eek
Top
500
G
lobalG
reen
Com
panies
2011
New
sw
eek
Top
500
G
lobalG
reen
Com
panies
2012
New
sw
eek
Top
500
G
lobalG
reen
Com
panies
2013
New
sw
eek
Top
500
G
lobalG
reen
Com
panies
2015
New
sw
eek
Top
500
G
reen
Com
panies
2011
New
sw
eek
Top
500
G
reen
Com
panies
2012
New
sw
eek
Top
500
G
reen
Com
panies
2013
New
sw
eek
Top
500
G
reen
Com
panies
2015
RepRisk
ESG
Business
Intelligence
Trucost
Vigeo
Deutsche Post AG 19 Yes No Yes Yes Yes Yes Yes Yes No No Yes Yes No Yes No Yes Yes Yes Yes Yes Yes No No No No Yes Yes Yes
HENKEL KGAA 19 Yes No Yes Yes Yes Yes Yes Yes No No Yes Yes No Yes No Yes Yes Yes Yes Yes Yes No No No No Yes Yes Yes
Apple Inc. 21 Yes No Yes Yes No Yes No Yes No No Yes Yes No Yes No Yes Yes Yes Yes Yes Yes Yes Yes Yes Yes Yes Yes Yes
BT Group PLC 19 Yes No Yes Yes Yes Yes Yes Yes No No Yes Yes No Yes No Yes Yes Yes Yes Yes Yes No No No No Yes Yes Yes
Amazon.com, Inc. 18 Yes No No No No Yes No No No No Yes Yes No Yes No Yes Yes Yes Yes Yes Yes Yes Yes Yes Yes Yes Yes Yes
5/24/2016
Subscribe at www.csrhub.com for access to the CSRHub Dashboard
CSRHub Dashboard Carbon ‐ Copyright © 2016 CSRHub
Dashboard created 2016‐02‐23
Organizations and Awards
(Companies must pay to join most organizations and to participate in some awards programs.
Yes 1 0 3 0 0 0 1 0 0 0 0 2 0 0 0 0 0 1 2 1 1 0 1 1 1 0 0 2 1 1 0 0 0 0 0 0 5 0 0 1 0 0 0 0 0 0 3 3 1 0 1 4 3
No 4 5 2 5 5 5 4 5 5 5 5 3 5 5 5 5 5 4 3 4 4 5 4 4 4 5 5 3 4 4 5 5 5 5 5 5 0 5 5 4 5 5 5 5 5 5 2 2 4 5 4 1 2
% Yes 20% 0% 60% 0% 0% 0% 20% 0% 0% 0% 0% 40% 0% 0% 0% 0% 0% 20% 40% 20% 20% 0% 20% 20% 20% 0% 0% 40% 20% 20% 0% 0% 0% 0% 0% 0% 100% 0% 0% 20% 0% 0% 0% 0% 0% 0% 60% 60% 20% 0% 20% 80% 60%
53 Different Organizations and Awards
Company
Simple
Count
100
Low
Carbon
Pioneers
Boston
College
Center
for
Corporate
Citizenship
(B
CCC
C)
BS
R
M
em
ber
Calvert
SocialIndex
Canadian
Business
for
SocialResponsibility
Carbonfund
Partners
Ceres
Clim
ate
Registry
Corporate
K
nights
Canada
-
50
Best
Corporate
Citizens
2014
Corporate
K
nights
Canada
-
50
Best
Corporate
Citizens
2015
Corporate
K
nights
G
lobal100
-
2014
Corporate
K
nights
G
lobal100
-
2015
Corporate
Responsibility
Index
U
K
2013
Corporate
Responsibility
Index
U
K
2014
CR’s
100
Best
Corporate
Citizens
2014
CR’s
100
Best
Corporate
Citizens
2015
D
ow
Jones
Sustainability
Index
N
orth
A
m
erica
D
ow
Jones
Sustainability
Index--Europe
D
ow
Jones
Sustainability
Index--G
lobal
ED
F
Clim
ate
Corps
2014
ED
F
Clim
ate
Corps
2015
Equator
Principles
EthicalConsum
er
Boycotts
List
Ethisphere
2014
Ethisphere
2015
FossilFree
Index--The
Carbon
U
nderground
G
lobal100
List
2014
G
lobal100
List
2015
G
lobalBusiness
Coalition
G
lobalBusiness
Coalition
G
reen
Seal
iShares
M
SCI
K
LD
400
SocialIndex
Fund
N
AEM
Corporate
M
em
ber
O
M
X
G
ES
Index
Raporty
Spoleczne
2013
Raporty
Spoleczne
2014
SR
I-Connect
SustainabilityServices
2013
SustainabilityServices
2014
Sustainable
Packaging
Coalition
The
S
ustainability
Consortium
m
em
ber
Thom
son
ESG
Index
Europe
(ESG
EU
)
Thom
son
ESG
Index
International(ESG
IN
)
Thom
son
ESG
Index
US
(ES
G
U
S)
Top
50
Socially
Responsible
2014
Top
50
Socially
Responsible
2015
U
N
G
lobalCom
pact
2013
U
N
G
lobalCom
pact
2014
U
N
G
lobalCom
pact
2015
U
nited
States
Clim
ate
Action
Partnership
W
ikiPositive.org
Com
panies
W
orld
Business
Councilfor
Sustainable
D
evelopm
ent
W
orld
Econom
ic
Forum
M
em
bers
Deutsche Post AG 4 No No Yes No No No No No No No No No No No No No No Yes Yes No No No No No No No No No Yes Yes No No No No No No Yes No No No No No No No No No Yes Yes No No No Yes Yes
HENKEL KGAA 5 No No No No No No No No No No No Yes No No No No No No Yes No No No No Yes Yes No No Yes No No No No No No No No Yes No No Yes No No No No No No Yes Yes No No No Yes Yes
Apple Inc. 4 No No Yes No No No Yes No No No No No No No No No No No No Yes Yes No No No No No No No No No No No No No No No Yes No No No No No No No No No No No No No No Yes No
BT Group PLC 3 Yes No Yes No No No No No No No No Yes No No No No No No No No No No No No No No No Yes No No No No No No No No Yes No No No No No No No No No Yes Yes Yes No Yes Yes Yes
Amazon.com, Inc. 1 No No No No No No No No No No No No No No No No No No No No No No Yes No No No No No No No No No No No No No Yes No No No No No No No No No No No No No No No No
5/24/2016
Subscribe at www.csrhub.com for access to the CSRHub Dashboard
CSRHub Dashboard Carbon ‐ Copyright © 2016 CSRHub
Dashboard created 2016‐02‐23
Carbon-Related Policies
(Reported information on how these companies manage their carbon‐related programs.)
Available 1 3 3 1 1 1 1 1 1 3 3 1 3 2 2 1 1 1 4 4 1 1 1
NA 4 2 2 4 4 4 4 4 4 2 2 4 2 3 3 4 4 4 1 1 4 4 4
% Avail 20% 60% 60% 20% 20% 20% 20% 20% 20% 60% 60% 20% 60% 40% 40% 20% 20% 20% 80% 80% 20% 20% 20%
54 Different Policy Indicators
AM
EEC
arbon
D
isclosure
Project
2013
FullD
ata
C
arbon
D
isclosure
Project
2013
FullD
ata
C
arbon
D
isclosure
Project
2013
FullD
ata
C
arbon
D
isclosure
Project
2013
FullD
ata
C
arbon
D
isclosure
Project
2013
FullD
ata
C
arbon
D
isclosure
Project
2013
FullD
ata
C
arbon
D
isclosure
Project
2013
FullD
ata
C
arbon
D
isclosure
Project
2013
FullD
ata
C
arbon
D
isclosure
Project
2013
FullD
ata
C
arbon
D
isclosure
Project
2013
FullD
ata
C
arbon
D
isclosure
Project
2013
FullD
ata
C
arbon
D
isclosure
Project
2013
FullD
ata
C
arbon
D
isclosure
Project
2013
FullD
ataC
arbon
D
isclosure
Project
2013
FullD
ata
C
arbon
D
isclosure
Project
2013
FullD
ata
C
arbon
D
isclosure
Project
2013
FullD
ata
C
arbon
D
isclosure
Project
2013
FullD
ata
C
arbon
D
isclosure
Project
2014
FullD
ata
C
arbon
D
isclosure
Project
2014
FullD
ata
C
arbon
D
isclosure
Project
2014
FullD
ata
C
arbon
D
isclosure
Project
20
FullD
ata
C
arbon
D
i
Company
Simple
Count
Harzardous 
emitter?
1.1. Where is 
the highest 
level of direct 
responsibility 
for climate 
change within 
your 
company?
1.2. Do you 
provide 
incentives for 
the 
management 
of climate 
change issues, 
including the 
attainment of 
targets?
13.1. Do 
you 
participate 
in any 
emissions 
trading 
schemes?
13.2. Has your 
company 
originated any 
project‐based 
carbon credits 
or purchased 
any within the 
reporting 
period?
14.2. Please 
indicate the 
verification/assura
nce status that 
applies to your 
Scope 3 emissions
14.2a. Please 
indicate the 
proportion of 
your Scope 3 
emissions that 
are 
verified/assure
d
14.3. Are you 
able to compare 
your Scope 3 
emissions for 
the reporting 
year with those 
for the previous 
year for any 
sources?
14.4. Do you 
engage with any 
of the elements 
of your value 
chain on GHG 
emissions and 
climate change 
strategies? (Tick 
all that apply)
2.2. Is 
climate 
change 
integrated 
into your 
business 
strategy?
2.3b. Are you on 
the Board of any 
trade 
associations or 
provide funding 
beyond 
membership?
2.3e. Do you 
fund any 
research 
organization
s to produce 
public work 
on climate 
change?
4.1. Have you 
published 
information about 
your company’s 
response to climate 
change and GHG 
emissions 
performance for this 
reporting year in 
other places than in 
your CDP response?
5.1. Have you identified 
any climate change risks 
(current or future) that 
have potential to generate 
a substantive change in 
your business operations, 
revenue or expenditure? 
Tick all that apply
6.1a Identified 
climate change 
opportunities 
that are driven 
by changes in 
regulation?
7.2. Please give the 
name of the 
standard, protocol 
or methodology you 
have used to collect 
activity data and 
calculate Scope 1 
and Scope 2 
emissions
8.6a. 
Please 
indicate 
the 
proportion 
of your 
Scope 1 
emissions 
that are 
verified/as
sured
8.7a. 
Please 
indicate 
the 
proportion 
of your 
Scope 2 
emissions 
that are 
verified/as
sured
1.1. Where is 
the highest 
level of direct 
responsibility 
for climate 
change within 
your company?
1.2. Do you 
provide 
incentives for 
the 
management 
of climate 
change issues, 
including the 
attainment of 
targets?
13.1. Do 
you 
participate 
in any 
emissions 
trading 
schemes?
13.2. Has your 
company 
originated any 
project‐based 
carbon credits 
or purchased 
any within the 
reporting 
period?
14.2. Please 
indicate the 
verification/as
surance status 
that applies to 
your Scope 3 
emissions
Deutsche Post AG 16
NA
Individual/Su
b‐set of the 
Board or 
other 
committee 
appointed by 
the Board
Yes Yes Yes
Third party 
verification or 
assurance 
complete
More than 
60% but less 
than or equal 
to 80%
Yes
Yes, our 
suppliers; Yes, 
our 
customers; 
Yes, other 
partners in the 
value chain
Yes No Yes 2 NA NA
ISO 14064‐1/The 
Greenhouse Gas 
Protocol: A 
Corporate 
Accounting and 
Reporting 
Standard (Revised 
Edition)
More 
than 90% 
but less 
than or 
equal to 
100%
More 
than 90% 
but less 
than or 
equal to 
100%
Individual/Sub‐
set of the 
Board or 
other 
committee 
appointed by 
the Board
Yes NA NA NA
HENKEL KGAA 8
NA
Individual/Su
b‐set of the 
Board or 
other 
committee 
appointed by 
the Board
Yes NA NA NA NA NA NA Yes Yes NA 2
Risks driven by changes 
in regulation; Risks 
driven by changes in 
physical climate 
parameters; Risks 
driven by changes in 
other climate‐related 
developments
Yes NA NA NA
Individual/Sub‐
set of the 
Board or 
other 
committee 
appointed by 
the Board
Yes NA NA NA
Apple Inc. 1
NA NA NA NA NA NA NA NA NA NA NA NA NA NA NA NA NA NA
Senior 
Manager/Offi
cer
Yes NA NA NA
BT Group PLC 9
No
Individual/Su
b‐set of the 
Board or 
other 
committee 
appointed by 
the Board
Yes NA NA NA NA NA NA Yes Yes NA 2
Risks driven by changes 
in regulation; Risks 
driven by changes in 
physical climate 
parameters; Risks 
driven by changes in 
other climate‐related 
developments
Yes NA NA NA
Individual/Sub‐
set of the 
Board or 
other 
committee 
appointed by 
the Board
Yes Yes No
Third party 
verification 
or assurance 
complete
Amazon.com, Inc. 0
NA NA NA NA NA NA NA NA NA NA NA NA NA NA NA NA NA NA NA NA NA NA NA
5/24/2016
Subscribe at www.csrhub.com for access to the CSRHub Dashboard
CSRHub Dashboard Carbon ‐ Copyright © 2016 CSRHub
Dashboard created 2016‐02‐23
1 1 4 4 4 3 1 4 4 3 3 3 1 1 1 1 1 3 1 0 1 1 0 0 0 0 0
4 4 1 1 1 2 4 1 1 2 2 2 4 4 4 4 4 2 4 5 4 4 5 5 5 5 5
20% 20% 80% 80% 80% 60% 20% 80% 80% 60% 60% 60% 20% 20% 20% 20% 20% 60% 20% 0% 20% 20% 0% 0% 0% 0% 0%
2014
D
isclosure
Project
2014
FullD
ataC
arbon
D
isclosure
Project
2014
FullD
ataC
arbon
D
isclosure
Project
2014
FullD
ata
C
arbon
D
isclosure
Project
2014
FullD
ata
C
arbon
D
isclosure
Project
2014
FullD
ata
C
arbon
D
isclosure
Project
2014
FullD
ata
C
arbon
D
isclosure
Project
2014
FullD
ata
C
arbon
D
isclosure
Project
2014
FullD
ata
C
arbon
D
isclosure
Project
2014
FullD
ata
C
arbon
D
isclosure
Project
2014
FullD
ata
C
arbon
D
isclosure
Project
2014
FullD
ata
C
arbon
D
isclosure
Project
2014
FullD
ata
C
arbon
D
isclosure
Project
2014
FullD
ata
C
arbon
D
isclosure
Project
2014
FullD
ata
C
arbon
D
isclosure
Project
2014
FullD
ata
C
arbon
D
isclosure
Project
2014
FullD
ata
C
arbon
D
isclosure
Project
2014
FullD
ata
C
arbon
D
isclosure
Project
2014
FullD
ata
C
arbon
D
isclosure
Project
2014
FullD
ata
C
arbon
D
isclosure
Project
2014
FullD
ataC
arbonfund
Partners
C
eres
Clim
ate
&
Energy
R
esolutions
2012
C
eres
Clim
ate
&
Energy
R
esolutions
2012
EPA
e-G
G
RT
2011
EPA
e-G
G
RT
2011
EPA
e-G
G
RT
2012
EPA
e-G
G
RT
2012
EPA
14.2a. Please indicate the 
proportion of your Scope 
3 emissions that are 
verified/assured
14.4. Do you 
engage with 
any of the 
elements of 
your value 
chain on GHG 
emissions and 
climate 
change 
strategies? 
(Tick all that 
apply)
2.2. Is 
climate 
change 
integrated 
into your 
business 
strategy?
2.3. Do you 
engage in 
activities that 
could either 
directly or 
indirectly 
influence 
policy on 
climate 
change 
through any of 
the following? 
(tick all that 
apply)
2.3b. Are 
you on the 
Board of 
any trade 
association
s or 
provide 
funding 
beyond 
membersh
ip?
2.3d. Do 
you 
publically 
disclose a 
list of all 
the 
research 
organizati
ons that 
you fund?
2.3e. Do 
you fund 
any 
research 
organizati
ons to 
produce 
public 
work on 
climate 
change?
3.2. Does the 
use of your 
goods and/or 
services 
directly enable 
GHG emissions 
to be avoided 
by a third 
party?
4.1. Have you 
published information 
about your company’s 
response to climate 
change and GHG 
emissions 
performance for this 
reporting year in 
other places than in 
your CDP response?
5.1. Have you 
identified any climate 
change risks (current 
or future) that have 
potential to generate 
a substantive change 
in your business 
operations, revenue 
or expenditure?
6.1. Have you identified any 
climate change opportunities 
(current or future) that have 
the potential to generate a 
substantive change in your 
business operations, revenue 
or expenditure? Tick all that 
apply
6.1a 
Identified 
climate 
change 
opportunities 
that are 
driven by 
changes in 
regulation?
7.2. Please give the 
name of the 
standard, protocol or 
methodology you 
have used to collect 
activity data and 
calculate Scope 1 
and Scope 2 
emissions
8.6. Please 
indicate the 
verification/ass
urance status 
that applies to 
your reported 
Scope 1 
emissions
8.6a. Please 
indicate the 
proportion 
of your 
Scope 1 
emissions 
that are 
verified/assu
red
8.7. Please 
indicate the 
verification/ass
urance status 
that applies to 
your reported 
Scope 2 
emissions
8.7a. 
Please 
indicate 
the 
proportion 
of your 
Scope 2 
emissions 
that are 
verified/as
sured
8.9. Are carbon 
dioxide 
emissions from 
biologically 
sequestered 
carbon 
relevant to 
your 
organization?
Verificatio
n/ 
assurance
List of 
companies who 
purchase 
carbon offsets 
through 
carbonfund.org
2012 Vote Rating Is Some CO2 
captured on‐
site and 
therefore not 
emitted?
Percentage of 
facilities that 
employ 
continuous 
emissions 
monitoring
Does the facility 
employ 
continuous 
emissions 
monitoring?
Is Some CO2 
captured on‐
site and 
therefore 
not emitted?
Is some CO2 
reported as 
emissions from the 
affected 
manufacturing 
process unit(s) under 
Subpart AA, G or P 
collected and 
transferred off‐site 
or injected (as 
reported under 
Subpart PP)?
NA NA Yes Yes No No NA No 2 NA NA NA NA NA NA NA NA NA NA NA NA NA NA NA NA NA NA
NA NA Yes Yes Yes NA NA Yes 3
Risks driven by 
changes in 
regulation; Risks 
driven by changes 
in physical climate 
parameters; Risks 
driven by changes 
in other climate‐
related 
developments
Opportunities driven by 
changes in regulation; 
Opportunities driven by 
changes in physical climate 
parameters; Opportunities 
driven by changes in other 
climate‐related 
developments
Yes NA NA NA NA NA Yes NA NA NA NA NA NA NA NA NA
NA NA Yes Yes Yes No NA Yes 40
Risks driven by 
changes in 
regulation; Risks 
driven by changes 
in physical climate 
parameters; Risks 
driven by changes 
in other climate‐
related
Opportunities driven by 
changes in regulation; 
Opportunities driven by 
changes in physical climate 
parameters; Opportunities 
driven by changes in other 
climate‐related 
developments
Yes NA NA NA NA NA Yes 123 NA NA
Withdra
wn; 
Company 
will 
address
NA NA NA NA NA
High 
assurance/https://ww
w.cdp.net/sites/2014/7
7/2377/Investor CDP 
2014/Shared 
Documents/Attachmen
ts/CC14.2a/LRQA ‐ BT 
assurance statement 
2013‐14.PDF/page 1‐2
Yes, our 
suppliers; 
Yes, our 
customers; 
Yes, other 
partners in 
the value 
chain
Yes Yes
No 
Response
No Yes Yes
In mainstream 
financial reports 
(complete)/47/http
s://www.cdp.net/si
tes/2014/77/2377/
Investor CDP 
2014/Shared 
Documents/Attach
ments/CC4.1/2014
_BT_Annual_Repor
t.pdf
Risks driven by 
changes in 
regulation; Risks 
driven by changes 
in physical climate 
parameters; Risks 
driven by changes 
in other climate‐
related 
developments
Opportunities driven by 
changes in regulation; 
Opportunities driven by 
changes in physical climate 
parameters; Opportunities 
driven by changes in other 
climate‐related 
developments
Explanation
The Greenhouse 
Gas Protocol: A 
Corporate 
Accounting and 
Reporting 
Standard (Revised 
Edition)//
Third party 
verification or 
assurance 
complete
1 Apr 
2013/31 
Mar 
2014/High 
assurance
Third party 
verification or 
assurance 
complete
See Table 
Sheet
No NA NA NA NA NA NA NA NA NA
NA NA NA NA NA NA NA NA NA NA NA NA NA NA NA NA NA NA NA NA
Vote: 
21.2%
NA NA NA NA NA NA
5/24/2016
Subscribe at www.csrhub.com for access to the CSRHub Dashboard
CSRHub Dashboard Carbon ‐ Copyright © 2016 CSRHub
Dashboard created 2016‐02‐23
2 0 5 2
3 5 0 3
40% 0% 100% 40%
A
e-G
G
RT
2012
G
reenpeace
CloudInterfax
ERA
2012
N
ew
sw
eek
Top
500
G
lobalG
reen
C
om
panies
2015
N
ew
sw
eek
Top
500
G
reen
C
om
panies
2015
Renewables 
Advocacy
Transpare
ncy
Sustainability 
Themed 
Committee
Sustainability 
Themed Committee
NA NA 0.05 NA
NA NA 0.05 NA
D NA 0 0.05
NA NA 0.05 NA
F NA 0 0
5/24/2016
Subscribe at www.csrhub.com for access to the CSRHub Dashboard
CSRHub Dashboard Carbon ‐ Copyright © 2016 CSRHub
Dashboard created 2016‐02‐23
Reported Carbon Information
(Data collected by these sources on these aspects of carbon reporting.)
Yes 1 1 1 1 0 3 3 3 0 0 0 0 0 0 0 0 3 1 1 1 3 3 3 3 3 3 3 3 1 1
NA 4 4 4 4 5 2 2 2 5 5 5 5 5 5 5 5 2 4 4 4 2 2 2 2 2 2 2 2 4 4
% Yes 20% 20% 20% 20% 0% 60% 60% 60% 0% 0% 0% 0% 0% 0% 0% 0% 60% 20% 20% 20% 60% 60% 60% 60% 60% 60% 60% 60% 20% 20%
103 Different Reported Facts
AM
EE
AM
EE
AM
EE
AM
EE
B
Corporation
G
IIRS
Ratings
Bloom
berg
N
ew
Energy
Finance
Index
(CREX)
Bloom
berg
N
ew
Energy
Finance
Index
(CREX)
Bloom
berg
N
ew
Energy
Finance
Index
(CREX)
Bloom
berg
N
ew
Energy
Finance
Index
(CREX)
Bloom
berg
N
ew
Energy
Finance
Index
(CREX)
Bloom
berg
N
ew
Energy
Finance
Index
(CREX)
Bloom
berg
N
ew
Energy
Finance
Index
(CREX)
Bloom
berg
N
ew
Energy
Finance
Index
(CREX)
Bloom
berg
N
ew
Energy
Finance
Index
(CREX)
Bloom
berg
N
ew
Energy
Finance
Index
(CREX)
Bloom
berg
N
ew
Energy
Finance
Index
(CREX)
Carbon
D
isclosure
Project
2013
FullD
ata
Carbon
D
isclosure
Project
2013
FullD
ataCarbon
D
isclosure
Project
2013
FullD
ataCarbon
D
isclosure
Project
2013
FullD
ata
Carbon
D
isclosure
Project
2013
FullD
ata
Carbon
D
isclosure
Project
2013
FullD
ata
Carbon
D
isclosure
Project
2013
FullD
ata
Carbon
D
isclosure
Project
2013
FullD
ata
Carbon
D
isclosure
Project
2013
FullD
ata
Carbon
D
isclosure
Project
2013
FullD
ata
Carbon
D
isclosure
Project
2013
FullD
ata
Carbon
D
isclosure
Project
2013
FullD
ata
Carbon
D
isclosure
Projec
FullD
ata
Carbon
D
Company
Simple
Count
Emissionsperassets
Emissionsperemployee
Emissionspersale
emissions_total_tco2e
EnergyUsePts
%Renewablesexcludingoffsets
2011ElectricityUsage/MWh
2011RenewablesUsage/MWh
Biomass/Biofuel(%)
Blend(%)
Geothermal(%)
Hydro(%)
Solar(%)
Unknown(%)
Wastetoenergy(%)
Wind(%)
12.1.Howdoyourabsoluteemissions
(Scope1and2combined)forthereporting
yearcomparetothepreviousyear?
12.2.Pleasedescribeyourgrosscombined
Scope1and2emissionsforthereporting
yearinmetrictonnesCO2eperrevenue:
Intensityfigure/Metricnumerator/%change
frompreviousyear/Directionofchangefrom
previousyear/Reasonforchange
12.3.Pleasedescribeyourgrosscombined
Scope1and2emissionsforthereporting
yearinmetrictonnesCO2eperFTE:
Intensityfigure/Metricnumerator/%change
frompreviousyear/Directionofchangefrom
previousyear/Reasonforchange
12.4.Pleaseprovideanadditionalintensity
(normalized)metricthatisappropriateto
yourbusinessoperations:Intensity
figure/Metricnumerator/%changefrom
previousyear/Directionofchangefrom
previousyear/Reasonforchange
2013PerformanceBand
2013Score
8.2.PleaseprovideyourgrossglobalScope1
emissionsfigureinmetrictonnesCO2efor
2010-01Jul2010-30Jun2011reporting
period
8.2.PleaseprovideyourgrossglobalScope1
emissionsfigureinmetrictonnesCO2efor
2011-01Jul2011-30Jun2012reporting
period
8.2.PleaseprovideyourgrossglobalScope1
emissionsfigureinmetrictonnesCO2efor
2012-01Jul2012-30Jun2013reporting
period
8.3.PleaseprovideyourgrossglobalScope2
emissionsfigureinmetrictonnesCO2efor
2010-01Jul2010-30Jun2011reporting
period
8.3.PleaseprovideyourgrossglobalScope2
emissionsfigureinmetrictonnesCO2efor
2011-01Jul2011-30Jun2012reporting
period
8.3.PleaseprovideyourgrossglobalScope2
emissionsfigureinmetrictonnesCO2efor
2012-01Jul2012-30Jun2013reporting
period
12.2.Pleasedescribeyourgrosscombined
Scope1and2emissionsforthereporting
yearinmetrictonnesCO2eperunitcurrency
totalrevenue
12.3.Pleasedescribeyourgrosscombined
Scope1and2emissionsforthereporting
yearinmetrictonnesCO2eperfulltime
equivalent(FTE)employee
Deutsche Post AG 6
NA NA NA NA NA 39
183700
0
719000 NA NA NA NA NA NA NA NA Increased
9.7E‐05/metric 
tonnes 
CO2e/3/Decreas
e/As requested, 
we provide the 
intensity figure 
as "Metric 
tonnes CO2 / 
EUR revenue":
2011: 5,300,000 
t CO2 / 52,829 
mn EUR = 
0 000100
12.54/metric 
tonnes 
CO2e/0.2/Increa
se/As requested, 
we provide the 
intensity figure 
as "Metric 
tonnes CO2 / 
FTE employee":
2011: 5,300,000 
t CO2 / 423,502 
FTE = 12.51
2012: 5 370 000
84/metric 
tonnes 
CO2e/2/Decreas
e/Value valid 
for: DPDHL Total 
Carbon 
Efficiency Index 
2007: 100 
2008: 98 
2009: 93 
2010: 88 
2011: 86
B 98 0 0 4800000 0 0 4800000 NA NA
HENKEL KGAA 1
NA NA NA NA NA NA NA NA NA NA NA NA NA NA NA NA Decreased NA NA NA B 85 0 0 317400 0 0 317400 NA NA
Apple Inc. 3
NA NA NA NA NA 9 580921 54000 NA NA NA NA NA NA NA NA NA NA NA NA NA NA NA NA NA NA NA NA NA NA
BT Group PLC 8
8.83774
01036e‐
005
23.3
348
0.00
01
3940
00
NA 42
221000
0
928200 NA NA NA NA NA NA NA NA Decreased NA NA NA A 93 0 0 200876 0 0 200876
13.79/met
ric tonnes 
CO2e/unit 
total 
revenue
4.4/metric 
tonnes 
CO2e/FTE 
employee
Amazon.com, Inc. 0
NA NA NA NA NA NA NA NA NA NA NA NA NA NA NA NA NA NA NA NA NA NA NA NA NA NA NA NA NA NA
5/24/2016
Subscribe at www.csrhub.com for access to the CSRHub Dashboard
CSRHub Dashboard Carbon ‐ Copyright © 2016 CSRHub
Dashboard created 2016‐02‐23
1 1 1 0 0 4 0 0 4 0 0 4 4 4 4 1 1 0 0 1 1 1 0 5 0 0 0 0 5 3 0 5 0 5 2 0 5 5
4 4 4 5 5 1 5 5 1 5 5 1 1 1 1 4 4 5 5 4 4 4 5 0 5 5 5 5 0 2 5 0 5 0 3 5 0 0
20% 20% 20% 0% 0% 80% 0% 0% 80% 0% 0% 80% 80% 80% 80% 20% 20% 0% 0% 20% 20% 20% 0% 100% 0% 0% 0% 0% 100% 60% 0% 100% 0% 100% 40% 0% 100% 100%
ect
2014
taD
isclosure
Project
2014
FullD
ata
Carbon
D
isclosure
Project
2014
FullD
ata
Carbon
D
isclosure
Project
2014
FullD
ata
Carbon
D
isclosure
Project
2014
FullD
ata
Carbon
D
isclosure
Project
2014
FullD
ata
Carbon
D
isclosure
Project
2014
FullD
ata
Carbon
D
isclosure
Project
2014
FullD
ata
Carbon
D
isclosure
Project
2014
FullD
ata
Carbon
D
isclosure
Project
2014
FullD
ata
Carbon
D
isclosure
Project
2014
FullD
ata
Carbon
D
isclosure
Project
2014
FullD
ata
Carbon
D
isclosure
Project
2014
FullD
ata
Carbon
D
isclosure
Project
2014
FullD
ata
Carbon
D
isclosure
Project
2014
FullD
ata
Carbon
D
isclosure
Project
2014
FullD
ata
Carbon
D
isclosure
Project
2014
FullD
ata
Carbon
D
isclosure
Project
2014
FullD
ata
Carbon
D
isclosure
Project
2014
FullD
ata
Carbon
M
arket
D
ata
Carbon
M
arket
D
ata
Clim
ate
Counts
2013
Clim
ate
Counts
2013
Clim
ate
Counts
2013
CR’s
100
Best
Corporate
Citizens
2014
Environm
entalInvestm
ent
O
rganisation
Environm
entalInvestm
ent
O
rganisation
Environm
entalInvestm
ent
O
rganisation
Environm
entalInvestm
ent
O
rganisation
Environm
entalInvestm
ent
O
rganisation
Environm
entalInvestm
ent
O
rganisation
Environm
entalInvestm
ent
O
rganisation
Environm
entalInvestm
ent
O
rganisation
Environm
entalInvestm
ent
O
rganisation
Environm
entalInvestm
ent
O
rganisation
Environm
entalInvestm
ent
O
rganisation
Environm
entalInvestm
ent
O
rganisation
Environm
entalInvestm
ent
O
rganisation
Environm
entalIn
O
rga
Envi
14.1.Organization’sScope3emissions,
disclosingandexplain
2013score
2014PerformanceBand
8.2.PleaseprovideyourgrossglobalScope1
emissionsfigureinmetrictonnesCO2efor
2011-01Jul2011-30Jun2012reporting
id
8.2.PleaseprovideyourgrossglobalScope1
emissionsfigureinmetrictonnesCO2efor
2012-01Jul2012-30Jun2013reporting
id
8.2.PleaseprovideyourgrossglobalScope1
emissionsfigureinmetrictonnesCO2efor
2013-01Jul2013-30Jun2014reporting
id
8.3.PleaseprovideyourgrossglobalScope2
emissionsfigureinmetrictonnesCO2efor
2011-01Jul2011-30Jun2012reporting
id
8.3.PleaseprovideyourgrossglobalScope2
emissionsfigureinmetrictonnesCO2efor
2012-01Jul2012-30Jun2013reporting
id
8.3.PleaseprovideyourgrossglobalScope2
emissionsfigureinmetrictonnesCO2efor
2013-01Jul2013-30Jun2014reporting
id
8.9.BiogenicallygeneratedtonnesCO2efor
2011-01Jul2011-30Jun2012reporting
period
8.9.BiogenicallygeneratedtonnesCO2efor
2012-01Jul2012-30Jun2013reporting
period
8.9.BiogenicallygeneratedtonnesCO2efor
2013-01Jul2013-30Jun2014reporting
period
Reportedbiogenicallygeneratedmetric
tonnesCO2efor2013reportingperiod?
ReportedgrossglobalScope1emissions
figureinmetrictonnesCO2efor2013
reportingperiod?
ReportedgrossglobalScope2emissions
figureinmetrictonnesCO2efor2013
reportingperiod?
Scope1emissions
Scope2emissions
CarbonIntensity(tCO2/$mrevenue)ratio
OriginalValue(EUETSverifiedemissions
2012(tCO2))
Context-BasedCumulativePerformance
Score(‘05-‘12)
RankbyContext-BasedScore(1to100)
Sustainable
ClimateChangeRank
AcceptedorInferredScope3Intensity
Asia-Pacific300CarbonRank
Asia-Pacific300CarbonRanking
BRICS300CarbonRank
BRICS300CarbonRanking
CombinedScope1+2+3Intensity
Europe300CarbonRank
Europe300CarbonRanking
Global800CarbonRank
Global800CarbonRanking
No.ofScope3CategoriesReported
NorthAmerica300CarbonRank
NorthAmerica300CarbonRanking
ReportedScope1+2Total(tCO2e)
ReportedScope3Intensity
NA NA NA NA NA
512000
0
NA NA 490000 NA NA 44900 Yes Yes Yes NA NA NA NA NA NA NA NA 2130.92 NA NA NA NA 1141.56 38 NA 85 NA 1 NA NA 5300000 328.79
NA NA NA NA NA 307500 NA NA 325700 NA NA 12500 Yes Yes Yes NA NA NA NA NA NA NA NA 856.03 NA NA NA NA 459.71 177 NA 208 NA ‐ NA NA 652000 ‐
NA NR A NA NA 30393 NA NA 91505 NA NA 17236 Yes Yes Yes 30393
91,505 
abs
NA NA NA NA NA NA 314.82 NA NA NA NA 570.8 NA NA 428 NA 4 32 NA Unclear ‐
Purchased 
goods and 
services/Rel
evant, 
calculated/1
883463
NA NA NA NA 182000 NA NA 70243 NA NA
No 
Respons
e
No Yes Yes NA NA NA NA 1.398 84 N NA 71.44 NA NA NA NA 57.48 24 NA 6 NA 3 NA NA 710000 1.41
NA NA NA NA NA NA NA NA NA NA NA NA NA NA NA NA NA NA NA NA NA NA NA 2475.03 NA NA NA NA 1380.21 NA NA 721 NA ‐ 255 NA ‐ ‐
5/24/2016
Subscribe at www.csrhub.com for access to the CSRHub Dashboard
CSRHub Dashboard Carbon ‐ Copyright © 2016 CSRHub
Dashboard created 2016‐02‐23
5 5 5 0 0 0 0 0 0 0 0 0 0 0 0 0 0 3 3 2 2 0 0 0 4 4 5 5 5 1 1 2 2 2 5
0 0 0 5 5 5 5 5 5 5 5 5 5 5 5 5 5 2 2 3 3 5 5 5 1 1 0 0 0 4 4 3 3 3 0
100% 100% 100% 0% 0% 0% 0% 0% 0% 0% 0% 0% 0% 0% 0% 0% 0% 60% 60% 40% 40% 0% 0% 0% 80% 80% 100% 100% 100% 20% 20% 40% 40% 40% 100%
nvestm
ent
anisation
vironm
entalInvestm
ent
O
rganisation
Environm
entalInvestm
ent
O
rganisation
Environm
entalInvestm
ent
O
rganisation
Environm
entalInvestm
ent
O
rganisation
EPA
e-G
G
RT
2011
EPA
e-G
G
RT
2011
EPA
e-G
G
RT
2011
EPA
e-G
G
RT
2011
EPA
e-G
G
RT
2011
EPA
e-G
G
RT
2012
EPA
e-G
G
RT
2012
EPA
e-G
G
RT
2012
EPA
e-G
G
RT
2012
EPA
e-G
G
RT
2012
EPA
e-G
G
RT
2012
EPA
e-G
G
RT
2012
EPA
e-G
G
RT
2012
EPA
e-G
G
RT
2012
ET
G
lobalIndex
ET
G
lobalIndex
G
reenpeace
Cloud
G
reenpeace
Cloud
Interfax
ERA
2012
Interfax
ERA
2012
Interfax
ERA
2012
N
ew
sw
eek
Top
500
G
lobalG
reen
Com
panies
2013
N
ew
sw
eek
Top
500
G
lobalG
reen
Com
panies
2013
N
ew
sw
eek
Top
500
G
lobalG
reen
Com
panies
2013
N
ew
sw
eek
Top
500
G
lobalG
reen
Com
panies
2015
N
ew
sw
eek
Top
500
G
lobalG
reen
Com
panies
2015
N
ew
sw
eek
Top
500
G
reen
Com
panies
2013
N
ew
sw
eek
Top
500
G
reen
Com
panies
2013
N
ew
sw
eek
Top
500
G
reen
Com
panies
2013
N
ew
sw
eek
Top
500
G
reen
Com
panies
2015
N
ew
sw
eek
Top
500
G
reen
Com
panies
2015
RepRisk
ESG
Business
Intelligence
ReportedScope3Total(tCO2e)
Scope1+2Intensity
Scope3DisclosureLeaderAward
Percentageofnon-biogenicCO2(outoftotal
directemissions)
SumofBiogenicCO2emissions
SumofCO2emissions(non-biogenic)
SumofMethane(CH4)emissions
SumofPFCemissions
Percentageofnon-biogenicCO2(outoftotal
directemissions)
StationaryCombustion
SumofBiogenicCO2emissions(metrictons)
SumofCO2emissions(non-biogenic)
SumofHFCemissions
SumofHFEemissions
SumofMethane(CH4)emissions
SumofPFCemissions
Totalreporteddirectemissions
RelativeScope1+2Intensity
RelativeScope3Intensity
CleanEnergyIndex
EnergyEfficiency&GHGMitigation
Dynamicsofefficiency
Efficiency:Ecoenergy
Efficiency:Technology
CarbonProductivity
EnergyProductivity
NewsweekGreenScore
CarbonProductivity
EnergyProductivity
CarbonProductivity
EnergyProductivity
NewsweekGreenScore
CarbonProductivity
EnergyProductivity
EnvironmentalFootPrint
2290000
0
76.1 No NA NA NA NA NA NA NA NA NA NA NA NA NA NA
0.41
29
2.55
15
NA NA NA NA NA 0.612 0.399 0.502 0.063 0.06 NA NA NA NA NA 0.4
‐ 31.69 No NA NA NA NA NA NA NA NA NA NA NA NA NA NA
0.06
46
0.02
91
NA NA NA NA NA 0.472 0.387 0.533 0.091 0.084 NA NA NA NA NA 1
‐ 413.39 No NA NA NA NA NA NA NA NA NA NA NA NA NA NA NA NA
0.15
3
D NA NA NA 0.963 0.918 0.569 0.127 0.107 0.963 0.918 0.569 0.115 0.09 3
46000 21.76 No NA NA NA NA NA NA NA NA NA NA NA NA NA NA
0.10
13
0.00
18
NA NA NA NA NA 0.384 0.53 0.462 0.134 0.099 NA NA NA NA NA 0.4
‐ 142.7 No NA NA NA NA NA NA NA NA NA NA NA NA NA NA NA NA
0.13
5
D NA NA NA NA NA 0.014 0 0 NA NA 0.014 0 0 2.8
5/24/2016
Subscribe at www.csrhub.com for access to the CSRHub Dashboard
CSRHub Dashboard Carbon ‐ Copyright © 2016 CSRHub
Dashboard created 2016‐02‐23
Date Setup and Support Information
Use this password to unlock a sheet and change its formulas.  Go to Home/Format/Unprotect to enter the password.
Unlock Password csrhub Means you can enter information into this cell
Enter dates in the format "MM/01/YYYY".  All data sets are as of the first day of the month.
Your focus date will automatically be set equal to the latest available data date, unless you change it.
Your Focus Date 2015/12 Latest available data date:
Earliest available data date:
If you need to set a starting date for a graph or table, put it here.
Start Date for Graph or Table 2013/12
Statistics for the Focus Data Set
Average CSRHub overall rating 54.7
Number of rated companies in the set 15,571
Number of data sources available 413
Number of data sources used this month 182
How to Use a CSRHub Dashboard More instructions & examples are available online.
1.  Go to File, Options, Formulas and change your calculation options to manual.
     This will make it easier for you to get started with the Dashboard. See Microsoft's instructions.
2.  Enter your CSRHub username and password in the CSRHub Dashboard authorization dialog box.
3.  Enter the names or ticker for the company or companies you want to study in the pink cells on the Enter Company Names sheet.
5.  Enter the date you would like a chart or table to begin by putting a start date in cell B14. 
6.  Press F9 or "Calculate" in the lower left corner to update the sheet.
7.  Review the results of your research in the other tabs in the file.
See answers to Frequently Asked Questions (FAQ) here.
How to Turn Your CSRHub Dashboard Into a PDF File
(Page size and settings have been optimized to print the width of a page in landscape mode.)
Direct Save to PDF From Excel
1.  Choose File... Save As from the top menu tab.
2.  Select Save as type… and choose PDF.
Printing from Excel to an Adobe PDF
1.  Choose File…Print.
2.  Choose "Adobe PDF" from the printer dropdown list.
3.  Choose your print options from the dropdown list 
      (one sheet, selected sheets, etc.).
4.  Click the "Print" button at the top.
Additional Support Information
Created with Version: 2.2
API code base last updated 2/8/2016
API version number 2.2
See samples of the available CSRHub Dashboards at:
www.csrhub.com/content/csrhub‐dashboard‐samples/
See the latest CSRHub Dashboard support information and instructions at:
www.csrhub.com/content/csrhub‐dashboard‐instructions/
4.  Put the date you would like to study into cell B11 on the Date Setup and Support sheet. 
CSRHub Dashboard Version
12/1/2015
12/1/2008
If you experience a technical problem using your Dashboard, please contact CSRHub support .  There are known problems with some network 
firewalls, but we may have a workaround to suggest.
5/24/2016
Subscribe at www.csrhub.com for access to the CSRHub Dashboard
CSRHub Dashboard Company Diagnostic ‐ Copyright © 2015 CSRHub
Dashboard created 2015‐04‐29 11

More Related Content

Similar to 5 company carbon dashboard (sample) - mar 2016 -csrhub

2016 Supply Chains to Admire - Report - 26 July 2016
2016 Supply Chains to Admire - Report - 26 July 20162016 Supply Chains to Admire - Report - 26 July 2016
2016 Supply Chains to Admire - Report - 26 July 2016Lora Cecere
 
Selling Power Top 50 2014
Selling Power Top 50 2014Selling Power Top 50 2014
Selling Power Top 50 2014Denise Wadina
 
Comparison of the Supply Chains to Admire and Gartner Top 25 Winners for 2011...
Comparison of the Supply Chains to Admire and Gartner Top 25 Winners for 2011...Comparison of the Supply Chains to Admire and Gartner Top 25 Winners for 2011...
Comparison of the Supply Chains to Admire and Gartner Top 25 Winners for 2011...Lora Cecere
 
AWS Transformation Day - Minneapolis 2018
AWS Transformation Day - Minneapolis 2018AWS Transformation Day - Minneapolis 2018
AWS Transformation Day - Minneapolis 2018Amazon Web Services
 
SIPOC Model PowerPoint Presentation Slides
SIPOC Model PowerPoint Presentation SlidesSIPOC Model PowerPoint Presentation Slides
SIPOC Model PowerPoint Presentation SlidesSlideTeam
 
The Path to Digital Leadership in Asia
The Path to Digital Leadership in AsiaThe Path to Digital Leadership in Asia
The Path to Digital Leadership in AsiaCognizant
 
Business Valuation Powerpoint Presentation Slides
Business Valuation Powerpoint Presentation SlidesBusiness Valuation Powerpoint Presentation Slides
Business Valuation Powerpoint Presentation SlidesSlideTeam
 
Design For Riordan Manufacturing
Design For Riordan ManufacturingDesign For Riordan Manufacturing
Design For Riordan ManufacturingMelissa Moore
 
Lean Out Processes in Mixed-Mode Manufacturing
Lean Out Processes in Mixed-Mode ManufacturingLean Out Processes in Mixed-Mode Manufacturing
Lean Out Processes in Mixed-Mode ManufacturingJeff Carr
 
Business Valuation PowerPoint Presentation Slides
Business Valuation PowerPoint Presentation SlidesBusiness Valuation PowerPoint Presentation Slides
Business Valuation PowerPoint Presentation SlidesSlideTeam
 
Sales And Marketing Analysis Report PowerPoint Presentation Slide
Sales And Marketing Analysis Report PowerPoint Presentation SlideSales And Marketing Analysis Report PowerPoint Presentation Slide
Sales And Marketing Analysis Report PowerPoint Presentation SlideSlideTeam
 
Disruption: Data and Analytics Modernization in the COVID-19 Era
Disruption: Data and Analytics Modernization in the COVID-19 EraDisruption: Data and Analytics Modernization in the COVID-19 Era
Disruption: Data and Analytics Modernization in the COVID-19 EraCognizant
 
New Product Launch Plan PowerPoint Presentation Slides
New Product Launch Plan PowerPoint Presentation SlidesNew Product Launch Plan PowerPoint Presentation Slides
New Product Launch Plan PowerPoint Presentation SlidesSlideTeam
 
Building a Digital Supply Chain - report - 9 APR 2018
Building a Digital Supply Chain - report - 9 APR 2018Building a Digital Supply Chain - report - 9 APR 2018
Building a Digital Supply Chain - report - 9 APR 2018Lora Cecere
 
Amazon Go Case Analysis1. Problem StatementThe key prob.docx
Amazon Go Case Analysis1. Problem StatementThe key  prob.docxAmazon Go Case Analysis1. Problem StatementThe key  prob.docx
Amazon Go Case Analysis1. Problem StatementThe key prob.docxgreg1eden90113
 
New Product Launch Plan Powerpoint Presentation Slides
New Product Launch Plan Powerpoint Presentation SlidesNew Product Launch Plan Powerpoint Presentation Slides
New Product Launch Plan Powerpoint Presentation SlidesSlideTeam
 
Mwwb csw benchmark free report 2016
Mwwb csw benchmark free report 2016Mwwb csw benchmark free report 2016
Mwwb csw benchmark free report 2016Barry Crisp
 
Assent webinar cm3_updates-aug19-2014-slideshare3
Assent webinar cm3_updates-aug19-2014-slideshare3Assent webinar cm3_updates-aug19-2014-slideshare3
Assent webinar cm3_updates-aug19-2014-slideshare3brytani
 
AWS Transformation Day London Keynote 2018
AWS Transformation Day London Keynote 2018AWS Transformation Day London Keynote 2018
AWS Transformation Day London Keynote 2018Amazon Web Services
 

Similar to 5 company carbon dashboard (sample) - mar 2016 -csrhub (20)

2016 Supply Chains to Admire - Report - 26 July 2016
2016 Supply Chains to Admire - Report - 26 July 20162016 Supply Chains to Admire - Report - 26 July 2016
2016 Supply Chains to Admire - Report - 26 July 2016
 
Selling Power Top 50 2014
Selling Power Top 50 2014Selling Power Top 50 2014
Selling Power Top 50 2014
 
Comparison of the Supply Chains to Admire and Gartner Top 25 Winners for 2011...
Comparison of the Supply Chains to Admire and Gartner Top 25 Winners for 2011...Comparison of the Supply Chains to Admire and Gartner Top 25 Winners for 2011...
Comparison of the Supply Chains to Admire and Gartner Top 25 Winners for 2011...
 
AWS Transformation Day - Minneapolis 2018
AWS Transformation Day - Minneapolis 2018AWS Transformation Day - Minneapolis 2018
AWS Transformation Day - Minneapolis 2018
 
SIPOC Model PowerPoint Presentation Slides
SIPOC Model PowerPoint Presentation SlidesSIPOC Model PowerPoint Presentation Slides
SIPOC Model PowerPoint Presentation Slides
 
The Path to Digital Leadership in Asia
The Path to Digital Leadership in AsiaThe Path to Digital Leadership in Asia
The Path to Digital Leadership in Asia
 
Business Valuation Powerpoint Presentation Slides
Business Valuation Powerpoint Presentation SlidesBusiness Valuation Powerpoint Presentation Slides
Business Valuation Powerpoint Presentation Slides
 
Design For Riordan Manufacturing
Design For Riordan ManufacturingDesign For Riordan Manufacturing
Design For Riordan Manufacturing
 
Lean Out Processes in Mixed-Mode Manufacturing
Lean Out Processes in Mixed-Mode ManufacturingLean Out Processes in Mixed-Mode Manufacturing
Lean Out Processes in Mixed-Mode Manufacturing
 
Business Valuation PowerPoint Presentation Slides
Business Valuation PowerPoint Presentation SlidesBusiness Valuation PowerPoint Presentation Slides
Business Valuation PowerPoint Presentation Slides
 
Sales And Marketing Analysis Report PowerPoint Presentation Slide
Sales And Marketing Analysis Report PowerPoint Presentation SlideSales And Marketing Analysis Report PowerPoint Presentation Slide
Sales And Marketing Analysis Report PowerPoint Presentation Slide
 
file000243.pdf
file000243.pdffile000243.pdf
file000243.pdf
 
Disruption: Data and Analytics Modernization in the COVID-19 Era
Disruption: Data and Analytics Modernization in the COVID-19 EraDisruption: Data and Analytics Modernization in the COVID-19 Era
Disruption: Data and Analytics Modernization in the COVID-19 Era
 
New Product Launch Plan PowerPoint Presentation Slides
New Product Launch Plan PowerPoint Presentation SlidesNew Product Launch Plan PowerPoint Presentation Slides
New Product Launch Plan PowerPoint Presentation Slides
 
Building a Digital Supply Chain - report - 9 APR 2018
Building a Digital Supply Chain - report - 9 APR 2018Building a Digital Supply Chain - report - 9 APR 2018
Building a Digital Supply Chain - report - 9 APR 2018
 
Amazon Go Case Analysis1. Problem StatementThe key prob.docx
Amazon Go Case Analysis1. Problem StatementThe key  prob.docxAmazon Go Case Analysis1. Problem StatementThe key  prob.docx
Amazon Go Case Analysis1. Problem StatementThe key prob.docx
 
New Product Launch Plan Powerpoint Presentation Slides
New Product Launch Plan Powerpoint Presentation SlidesNew Product Launch Plan Powerpoint Presentation Slides
New Product Launch Plan Powerpoint Presentation Slides
 
Mwwb csw benchmark free report 2016
Mwwb csw benchmark free report 2016Mwwb csw benchmark free report 2016
Mwwb csw benchmark free report 2016
 
Assent webinar cm3_updates-aug19-2014-slideshare3
Assent webinar cm3_updates-aug19-2014-slideshare3Assent webinar cm3_updates-aug19-2014-slideshare3
Assent webinar cm3_updates-aug19-2014-slideshare3
 
AWS Transformation Day London Keynote 2018
AWS Transformation Day London Keynote 2018AWS Transformation Day London Keynote 2018
AWS Transformation Day London Keynote 2018
 

Recently uploaded

GD Birla and his contribution in management
GD Birla and his contribution in managementGD Birla and his contribution in management
GD Birla and his contribution in managementchhavia330
 
Boost the utilization of your HCL environment by reevaluating use cases and f...
Boost the utilization of your HCL environment by reevaluating use cases and f...Boost the utilization of your HCL environment by reevaluating use cases and f...
Boost the utilization of your HCL environment by reevaluating use cases and f...Roland Driesen
 
Pharma Works Profile of Karan Communications
Pharma Works Profile of Karan CommunicationsPharma Works Profile of Karan Communications
Pharma Works Profile of Karan Communicationskarancommunications
 
Call Girls In Panjim North Goa 9971646499 Genuine Service
Call Girls In Panjim North Goa 9971646499 Genuine ServiceCall Girls In Panjim North Goa 9971646499 Genuine Service
Call Girls In Panjim North Goa 9971646499 Genuine Serviceritikaroy0888
 
Russian Faridabad Call Girls(Badarpur) : ☎ 8168257667, @4999
Russian Faridabad Call Girls(Badarpur) : ☎ 8168257667, @4999Russian Faridabad Call Girls(Badarpur) : ☎ 8168257667, @4999
Russian Faridabad Call Girls(Badarpur) : ☎ 8168257667, @4999Tina Ji
 
Insurers' journeys to build a mastery in the IoT usage
Insurers' journeys to build a mastery in the IoT usageInsurers' journeys to build a mastery in the IoT usage
Insurers' journeys to build a mastery in the IoT usageMatteo Carbone
 
Best Basmati Rice Manufacturers in India
Best Basmati Rice Manufacturers in IndiaBest Basmati Rice Manufacturers in India
Best Basmati Rice Manufacturers in IndiaShree Krishna Exports
 
A DAY IN THE LIFE OF A SALESMAN / WOMAN
A DAY IN THE LIFE OF A  SALESMAN / WOMANA DAY IN THE LIFE OF A  SALESMAN / WOMAN
A DAY IN THE LIFE OF A SALESMAN / WOMANIlamathiKannappan
 
Mysore Call Girls 8617370543 WhatsApp Number 24x7 Best Services
Mysore Call Girls 8617370543 WhatsApp Number 24x7 Best ServicesMysore Call Girls 8617370543 WhatsApp Number 24x7 Best Services
Mysore Call Girls 8617370543 WhatsApp Number 24x7 Best ServicesDipal Arora
 
Call Girls In DLf Gurgaon ➥99902@11544 ( Best price)100% Genuine Escort In 24...
Call Girls In DLf Gurgaon ➥99902@11544 ( Best price)100% Genuine Escort In 24...Call Girls In DLf Gurgaon ➥99902@11544 ( Best price)100% Genuine Escort In 24...
Call Girls In DLf Gurgaon ➥99902@11544 ( Best price)100% Genuine Escort In 24...lizamodels9
 
VIP Call Girl Jamshedpur Aashi 8250192130 Independent Escort Service Jamshedpur
VIP Call Girl Jamshedpur Aashi 8250192130 Independent Escort Service JamshedpurVIP Call Girl Jamshedpur Aashi 8250192130 Independent Escort Service Jamshedpur
VIP Call Girl Jamshedpur Aashi 8250192130 Independent Escort Service JamshedpurSuhani Kapoor
 
Understanding the Pakistan Budgeting Process: Basics and Key Insights
Understanding the Pakistan Budgeting Process: Basics and Key InsightsUnderstanding the Pakistan Budgeting Process: Basics and Key Insights
Understanding the Pakistan Budgeting Process: Basics and Key Insightsseri bangash
 
Creating Low-Code Loan Applications using the Trisotech Mortgage Feature Set
Creating Low-Code Loan Applications using the Trisotech Mortgage Feature SetCreating Low-Code Loan Applications using the Trisotech Mortgage Feature Set
Creating Low-Code Loan Applications using the Trisotech Mortgage Feature SetDenis Gagné
 
7.pdf This presentation captures many uses and the significance of the number...
7.pdf This presentation captures many uses and the significance of the number...7.pdf This presentation captures many uses and the significance of the number...
7.pdf This presentation captures many uses and the significance of the number...Paul Menig
 
Grateful 7 speech thanking everyone that has helped.pdf
Grateful 7 speech thanking everyone that has helped.pdfGrateful 7 speech thanking everyone that has helped.pdf
Grateful 7 speech thanking everyone that has helped.pdfPaul Menig
 
MONA 98765-12871 CALL GIRLS IN LUDHIANA LUDHIANA CALL GIRL
MONA 98765-12871 CALL GIRLS IN LUDHIANA LUDHIANA CALL GIRLMONA 98765-12871 CALL GIRLS IN LUDHIANA LUDHIANA CALL GIRL
MONA 98765-12871 CALL GIRLS IN LUDHIANA LUDHIANA CALL GIRLSeo
 
Yaroslav Rozhankivskyy: Три складові і три передумови максимальної продуктивн...
Yaroslav Rozhankivskyy: Три складові і три передумови максимальної продуктивн...Yaroslav Rozhankivskyy: Три складові і три передумови максимальної продуктивн...
Yaroslav Rozhankivskyy: Три складові і три передумови максимальної продуктивн...Lviv Startup Club
 
Monte Carlo simulation : Simulation using MCSM
Monte Carlo simulation : Simulation using MCSMMonte Carlo simulation : Simulation using MCSM
Monte Carlo simulation : Simulation using MCSMRavindra Nath Shukla
 
Monthly Social Media Update April 2024 pptx.pptx
Monthly Social Media Update April 2024 pptx.pptxMonthly Social Media Update April 2024 pptx.pptx
Monthly Social Media Update April 2024 pptx.pptxAndy Lambert
 

Recently uploaded (20)

GD Birla and his contribution in management
GD Birla and his contribution in managementGD Birla and his contribution in management
GD Birla and his contribution in management
 
Boost the utilization of your HCL environment by reevaluating use cases and f...
Boost the utilization of your HCL environment by reevaluating use cases and f...Boost the utilization of your HCL environment by reevaluating use cases and f...
Boost the utilization of your HCL environment by reevaluating use cases and f...
 
Pharma Works Profile of Karan Communications
Pharma Works Profile of Karan CommunicationsPharma Works Profile of Karan Communications
Pharma Works Profile of Karan Communications
 
Nepali Escort Girl Kakori \ 9548273370 Indian Call Girls Service Lucknow ₹,9517
Nepali Escort Girl Kakori \ 9548273370 Indian Call Girls Service Lucknow ₹,9517Nepali Escort Girl Kakori \ 9548273370 Indian Call Girls Service Lucknow ₹,9517
Nepali Escort Girl Kakori \ 9548273370 Indian Call Girls Service Lucknow ₹,9517
 
Call Girls In Panjim North Goa 9971646499 Genuine Service
Call Girls In Panjim North Goa 9971646499 Genuine ServiceCall Girls In Panjim North Goa 9971646499 Genuine Service
Call Girls In Panjim North Goa 9971646499 Genuine Service
 
Russian Faridabad Call Girls(Badarpur) : ☎ 8168257667, @4999
Russian Faridabad Call Girls(Badarpur) : ☎ 8168257667, @4999Russian Faridabad Call Girls(Badarpur) : ☎ 8168257667, @4999
Russian Faridabad Call Girls(Badarpur) : ☎ 8168257667, @4999
 
Insurers' journeys to build a mastery in the IoT usage
Insurers' journeys to build a mastery in the IoT usageInsurers' journeys to build a mastery in the IoT usage
Insurers' journeys to build a mastery in the IoT usage
 
Best Basmati Rice Manufacturers in India
Best Basmati Rice Manufacturers in IndiaBest Basmati Rice Manufacturers in India
Best Basmati Rice Manufacturers in India
 
A DAY IN THE LIFE OF A SALESMAN / WOMAN
A DAY IN THE LIFE OF A  SALESMAN / WOMANA DAY IN THE LIFE OF A  SALESMAN / WOMAN
A DAY IN THE LIFE OF A SALESMAN / WOMAN
 
Mysore Call Girls 8617370543 WhatsApp Number 24x7 Best Services
Mysore Call Girls 8617370543 WhatsApp Number 24x7 Best ServicesMysore Call Girls 8617370543 WhatsApp Number 24x7 Best Services
Mysore Call Girls 8617370543 WhatsApp Number 24x7 Best Services
 
Call Girls In DLf Gurgaon ➥99902@11544 ( Best price)100% Genuine Escort In 24...
Call Girls In DLf Gurgaon ➥99902@11544 ( Best price)100% Genuine Escort In 24...Call Girls In DLf Gurgaon ➥99902@11544 ( Best price)100% Genuine Escort In 24...
Call Girls In DLf Gurgaon ➥99902@11544 ( Best price)100% Genuine Escort In 24...
 
VIP Call Girl Jamshedpur Aashi 8250192130 Independent Escort Service Jamshedpur
VIP Call Girl Jamshedpur Aashi 8250192130 Independent Escort Service JamshedpurVIP Call Girl Jamshedpur Aashi 8250192130 Independent Escort Service Jamshedpur
VIP Call Girl Jamshedpur Aashi 8250192130 Independent Escort Service Jamshedpur
 
Understanding the Pakistan Budgeting Process: Basics and Key Insights
Understanding the Pakistan Budgeting Process: Basics and Key InsightsUnderstanding the Pakistan Budgeting Process: Basics and Key Insights
Understanding the Pakistan Budgeting Process: Basics and Key Insights
 
Creating Low-Code Loan Applications using the Trisotech Mortgage Feature Set
Creating Low-Code Loan Applications using the Trisotech Mortgage Feature SetCreating Low-Code Loan Applications using the Trisotech Mortgage Feature Set
Creating Low-Code Loan Applications using the Trisotech Mortgage Feature Set
 
7.pdf This presentation captures many uses and the significance of the number...
7.pdf This presentation captures many uses and the significance of the number...7.pdf This presentation captures many uses and the significance of the number...
7.pdf This presentation captures many uses and the significance of the number...
 
Grateful 7 speech thanking everyone that has helped.pdf
Grateful 7 speech thanking everyone that has helped.pdfGrateful 7 speech thanking everyone that has helped.pdf
Grateful 7 speech thanking everyone that has helped.pdf
 
MONA 98765-12871 CALL GIRLS IN LUDHIANA LUDHIANA CALL GIRL
MONA 98765-12871 CALL GIRLS IN LUDHIANA LUDHIANA CALL GIRLMONA 98765-12871 CALL GIRLS IN LUDHIANA LUDHIANA CALL GIRL
MONA 98765-12871 CALL GIRLS IN LUDHIANA LUDHIANA CALL GIRL
 
Yaroslav Rozhankivskyy: Три складові і три передумови максимальної продуктивн...
Yaroslav Rozhankivskyy: Три складові і три передумови максимальної продуктивн...Yaroslav Rozhankivskyy: Три складові і три передумови максимальної продуктивн...
Yaroslav Rozhankivskyy: Три складові і три передумови максимальної продуктивн...
 
Monte Carlo simulation : Simulation using MCSM
Monte Carlo simulation : Simulation using MCSMMonte Carlo simulation : Simulation using MCSM
Monte Carlo simulation : Simulation using MCSM
 
Monthly Social Media Update April 2024 pptx.pptx
Monthly Social Media Update April 2024 pptx.pptxMonthly Social Media Update April 2024 pptx.pptx
Monthly Social Media Update April 2024 pptx.pptx
 

5 company carbon dashboard (sample) - mar 2016 -csrhub

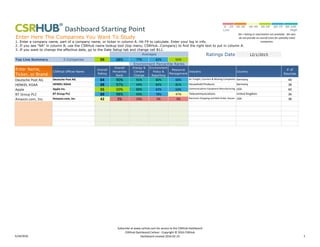
  • 1. Enter Here The Companies You Want To Study 1. Enter a company name, part of a company name, or ticker in column A. Hit F9 to calculate. Enter your log in info. 2. If you see "NA" in column B, use the CSRHub name lookup tool (top menu, CSRHub…Company) to find the right text to put in column A. 3. If you want to change the effective date, go to the Date Setup tab and change cell B11. Ratings Date 12/1/2015 Top Line Summary 5 Companies 59 68% 77% 62% 51% Enter Name, Ticker, or Brand CSRHub Official Name Overall Rating Overall Percentile Rank Energy & Climate Change Environment Policy & Reporting Resource Management Industry Country # of Sources Deutsche Post AG Deutsche Post AG 64 90% 91% 80% 60% Air Freight, Couriers & Moving Companies Germany 40 HENKEL KGAA HENKEL KGAA 68 97% 94% 82% 81% Household Products Germany 38 Apple Apple Inc. 55 50% 80% 63% 64% Communications Equipment Manufacturing USA 60 BT Group PLC BT Group PLC 69 98% 93% 78% 47% Telecommunications United Kingdom 36 Amazon.com, Inc. Amazon.com, Inc. 42 3% 25% 5% 3% Electronic Shopping and Mail‐Order Houses USA 38 Environment Percentile Ranks Averages NA = Rating or information not available.  We also  do not provide an overall score for partially rated  companies. 5/24/2016 Subscribe at www.csrhub.com for access to the CSRHub Dashboard CSRHub Dashboard Carbon ‐ Copyright © 2016 CSRHub Dashboard created 2016‐02‐23 1
  • 2. Quick Diagnostic (Summary of Carbon‐Related Data for this set of companies) Yes 4 5 5 5 No 1 0 0 0 % Yes 80% 100% 100% 100% Average 77% 72% 75% 42.4 19.2 3.4 6.8 3.6 Company Versus All Companies Versus Same Industry Versus Same Country # of Sources # of Reporting Systems # of Orgs and Awards # of Policy Indicators # of Reported Facts CDP? (Past 3 years) ET Global Index MSCI ESG CarbonM etrics Trucost Deutsche Post AG 91% 80% 81% 40 19 4 16 6 Yes Yes Yes Yes HENKEL KGAA 94% 91% 88% 38 19 5 8 1 Yes Yes Yes Yes Apple Inc. 80% 70% 87% 60 21 4 1 3 Yes Yes Yes Yes BT Group PLC 93% 93% 89% 36 19 3 9 8 Yes Yes Yes Yes Amazon.com, Inc. 25% 25% 29% 38 18 1 0 0 No Yes Yes Yes Energy & Climate Change Model Est. Avail? NA = Rating or information not available.  We also do not  provide an overall score for partially rated companies. 5/24/2016 Subscribe at www.csrhub.com for access to the CSRHub Dashboard CSRHub Dashboard Carbon ‐ Copyright © 2016 CSRHub Dashboard created 2016‐02‐23
  • 3. Carbon-Related Reporting Systems (Companies typically must submit data or respond to a questionaire for each of these sources.) Yes 5 0 4 4 3 5 3 4 0 0 5 5 0 5 0 5 5 5 5 5 5 2 2 2 2 5 5 5 No 0 5 1 1 2 0 2 1 5 5 0 0 5 0 5 0 0 0 0 0 0 3 3 3 3 0 0 0 % Yes 100% 0% 80% 80% 60% 100% 60% 80% 0% 0% 100% 100% 0% 100% 0% 100% 100% 100% 100% 100% 100% 40% 40% 40% 40% 100% 100% 100% 29 Different Reporting Systems Company Simple Count Asset4 B Corporation G IIRS Ratings Carbon D isclosure Project2009 FullD ata Carbon D isclosure Project2010 FullD ata Carbon D isclosure Project2011 FullD ata Carbon D isclosure Project2012 FullD ata Carbon D isclosure Project2013 FullD ata Carbon D isclosure Project2014 FullD ata Carbon M arketD ata CR’s 100 BestCorporate Citizens 2014 EIRIS Environm entalInvestm ent O rganisation EPA e-G G RT 2011 ET G lobalIndex Interfax ERA 2012 M SCI ESG CarbonM etrics M SCI ESG Intangible Value Assessm ent New sw eek Top 500 G lobalG reen Com panies 2011 New sw eek Top 500 G lobalG reen Com panies 2012 New sw eek Top 500 G lobalG reen Com panies 2013 New sw eek Top 500 G lobalG reen Com panies 2015 New sw eek Top 500 G reen Com panies 2011 New sw eek Top 500 G reen Com panies 2012 New sw eek Top 500 G reen Com panies 2013 New sw eek Top 500 G reen Com panies 2015 RepRisk ESG Business Intelligence Trucost Vigeo Deutsche Post AG 19 Yes No Yes Yes Yes Yes Yes Yes No No Yes Yes No Yes No Yes Yes Yes Yes Yes Yes No No No No Yes Yes Yes HENKEL KGAA 19 Yes No Yes Yes Yes Yes Yes Yes No No Yes Yes No Yes No Yes Yes Yes Yes Yes Yes No No No No Yes Yes Yes Apple Inc. 21 Yes No Yes Yes No Yes No Yes No No Yes Yes No Yes No Yes Yes Yes Yes Yes Yes Yes Yes Yes Yes Yes Yes Yes BT Group PLC 19 Yes No Yes Yes Yes Yes Yes Yes No No Yes Yes No Yes No Yes Yes Yes Yes Yes Yes No No No No Yes Yes Yes Amazon.com, Inc. 18 Yes No No No No Yes No No No No Yes Yes No Yes No Yes Yes Yes Yes Yes Yes Yes Yes Yes Yes Yes Yes Yes 5/24/2016 Subscribe at www.csrhub.com for access to the CSRHub Dashboard CSRHub Dashboard Carbon ‐ Copyright © 2016 CSRHub Dashboard created 2016‐02‐23
  • 4. Organizations and Awards (Companies must pay to join most organizations and to participate in some awards programs. Yes 1 0 3 0 0 0 1 0 0 0 0 2 0 0 0 0 0 1 2 1 1 0 1 1 1 0 0 2 1 1 0 0 0 0 0 0 5 0 0 1 0 0 0 0 0 0 3 3 1 0 1 4 3 No 4 5 2 5 5 5 4 5 5 5 5 3 5 5 5 5 5 4 3 4 4 5 4 4 4 5 5 3 4 4 5 5 5 5 5 5 0 5 5 4 5 5 5 5 5 5 2 2 4 5 4 1 2 % Yes 20% 0% 60% 0% 0% 0% 20% 0% 0% 0% 0% 40% 0% 0% 0% 0% 0% 20% 40% 20% 20% 0% 20% 20% 20% 0% 0% 40% 20% 20% 0% 0% 0% 0% 0% 0% 100% 0% 0% 20% 0% 0% 0% 0% 0% 0% 60% 60% 20% 0% 20% 80% 60% 53 Different Organizations and Awards Company Simple Count 100 Low Carbon Pioneers Boston College Center for Corporate Citizenship (B CCC C) BS R M em ber Calvert SocialIndex Canadian Business for SocialResponsibility Carbonfund Partners Ceres Clim ate Registry Corporate K nights Canada - 50 Best Corporate Citizens 2014 Corporate K nights Canada - 50 Best Corporate Citizens 2015 Corporate K nights G lobal100 - 2014 Corporate K nights G lobal100 - 2015 Corporate Responsibility Index U K 2013 Corporate Responsibility Index U K 2014 CR’s 100 Best Corporate Citizens 2014 CR’s 100 Best Corporate Citizens 2015 D ow Jones Sustainability Index N orth A m erica D ow Jones Sustainability Index--Europe D ow Jones Sustainability Index--G lobal ED F Clim ate Corps 2014 ED F Clim ate Corps 2015 Equator Principles EthicalConsum er Boycotts List Ethisphere 2014 Ethisphere 2015 FossilFree Index--The Carbon U nderground G lobal100 List 2014 G lobal100 List 2015 G lobalBusiness Coalition G lobalBusiness Coalition G reen Seal iShares M SCI K LD 400 SocialIndex Fund N AEM Corporate M em ber O M X G ES Index Raporty Spoleczne 2013 Raporty Spoleczne 2014 SR I-Connect SustainabilityServices 2013 SustainabilityServices 2014 Sustainable Packaging Coalition The S ustainability Consortium m em ber Thom son ESG Index Europe (ESG EU ) Thom son ESG Index International(ESG IN ) Thom son ESG Index US (ES G U S) Top 50 Socially Responsible 2014 Top 50 Socially Responsible 2015 U N G lobalCom pact 2013 U N G lobalCom pact 2014 U N G lobalCom pact 2015 U nited States Clim ate Action Partnership W ikiPositive.org Com panies W orld Business Councilfor Sustainable D evelopm ent W orld Econom ic Forum M em bers Deutsche Post AG 4 No No Yes No No No No No No No No No No No No No No Yes Yes No No No No No No No No No Yes Yes No No No No No No Yes No No No No No No No No No Yes Yes No No No Yes Yes HENKEL KGAA 5 No No No No No No No No No No No Yes No No No No No No Yes No No No No Yes Yes No No Yes No No No No No No No No Yes No No Yes No No No No No No Yes Yes No No No Yes Yes Apple Inc. 4 No No Yes No No No Yes No No No No No No No No No No No No Yes Yes No No No No No No No No No No No No No No No Yes No No No No No No No No No No No No No No Yes No BT Group PLC 3 Yes No Yes No No No No No No No No Yes No No No No No No No No No No No No No No No Yes No No No No No No No No Yes No No No No No No No No No Yes Yes Yes No Yes Yes Yes Amazon.com, Inc. 1 No No No No No No No No No No No No No No No No No No No No No No Yes No No No No No No No No No No No No No Yes No No No No No No No No No No No No No No No No 5/24/2016 Subscribe at www.csrhub.com for access to the CSRHub Dashboard CSRHub Dashboard Carbon ‐ Copyright © 2016 CSRHub Dashboard created 2016‐02‐23
  • 5. Carbon-Related Policies (Reported information on how these companies manage their carbon‐related programs.) Available 1 3 3 1 1 1 1 1 1 3 3 1 3 2 2 1 1 1 4 4 1 1 1 NA 4 2 2 4 4 4 4 4 4 2 2 4 2 3 3 4 4 4 1 1 4 4 4 % Avail 20% 60% 60% 20% 20% 20% 20% 20% 20% 60% 60% 20% 60% 40% 40% 20% 20% 20% 80% 80% 20% 20% 20% 54 Different Policy Indicators AM EEC arbon D isclosure Project 2013 FullD ata C arbon D isclosure Project 2013 FullD ata C arbon D isclosure Project 2013 FullD ata C arbon D isclosure Project 2013 FullD ata C arbon D isclosure Project 2013 FullD ata C arbon D isclosure Project 2013 FullD ata C arbon D isclosure Project 2013 FullD ata C arbon D isclosure Project 2013 FullD ata C arbon D isclosure Project 2013 FullD ata C arbon D isclosure Project 2013 FullD ata C arbon D isclosure Project 2013 FullD ata C arbon D isclosure Project 2013 FullD ata C arbon D isclosure Project 2013 FullD ataC arbon D isclosure Project 2013 FullD ata C arbon D isclosure Project 2013 FullD ata C arbon D isclosure Project 2013 FullD ata C arbon D isclosure Project 2013 FullD ata C arbon D isclosure Project 2014 FullD ata C arbon D isclosure Project 2014 FullD ata C arbon D isclosure Project 2014 FullD ata C arbon D isclosure Project 20 FullD ata C arbon D i Company Simple Count Harzardous  emitter? 1.1. Where is  the highest  level of direct  responsibility  for climate  change within  your  company? 1.2. Do you  provide  incentives for  the  management  of climate  change issues,  including the  attainment of  targets? 13.1. Do  you  participate  in any  emissions  trading  schemes? 13.2. Has your  company  originated any  project‐based  carbon credits  or purchased  any within the  reporting  period? 14.2. Please  indicate the  verification/assura nce status that  applies to your  Scope 3 emissions 14.2a. Please  indicate the  proportion of  your Scope 3  emissions that  are  verified/assure d 14.3. Are you  able to compare  your Scope 3  emissions for  the reporting  year with those  for the previous  year for any  sources? 14.4. Do you  engage with any  of the elements  of your value  chain on GHG  emissions and  climate change  strategies? (Tick  all that apply) 2.2. Is  climate  change  integrated  into your  business  strategy? 2.3b. Are you on  the Board of any  trade  associations or  provide funding  beyond  membership? 2.3e. Do you  fund any  research  organization s to produce  public work  on climate  change? 4.1. Have you  published  information about  your company’s  response to climate  change and GHG  emissions  performance for this  reporting year in  other places than in  your CDP response? 5.1. Have you identified  any climate change risks  (current or future) that  have potential to generate  a substantive change in  your business operations,  revenue or expenditure?  Tick all that apply 6.1a Identified  climate change  opportunities  that are driven  by changes in  regulation? 7.2. Please give the  name of the  standard, protocol  or methodology you  have used to collect  activity data and  calculate Scope 1  and Scope 2  emissions 8.6a.  Please  indicate  the  proportion  of your  Scope 1  emissions  that are  verified/as sured 8.7a.  Please  indicate  the  proportion  of your  Scope 2  emissions  that are  verified/as sured 1.1. Where is  the highest  level of direct  responsibility  for climate  change within  your company? 1.2. Do you  provide  incentives for  the  management  of climate  change issues,  including the  attainment of  targets? 13.1. Do  you  participate  in any  emissions  trading  schemes? 13.2. Has your  company  originated any  project‐based  carbon credits  or purchased  any within the  reporting  period? 14.2. Please  indicate the  verification/as surance status  that applies to  your Scope 3  emissions Deutsche Post AG 16 NA Individual/Su b‐set of the  Board or  other  committee  appointed by  the Board Yes Yes Yes Third party  verification or  assurance  complete More than  60% but less  than or equal  to 80% Yes Yes, our  suppliers; Yes,  our  customers;  Yes, other  partners in the  value chain Yes No Yes 2 NA NA ISO 14064‐1/The  Greenhouse Gas  Protocol: A  Corporate  Accounting and  Reporting  Standard (Revised  Edition) More  than 90%  but less  than or  equal to  100% More  than 90%  but less  than or  equal to  100% Individual/Sub‐ set of the  Board or  other  committee  appointed by  the Board Yes NA NA NA HENKEL KGAA 8 NA Individual/Su b‐set of the  Board or  other  committee  appointed by  the Board Yes NA NA NA NA NA NA Yes Yes NA 2 Risks driven by changes  in regulation; Risks  driven by changes in  physical climate  parameters; Risks  driven by changes in  other climate‐related  developments Yes NA NA NA Individual/Sub‐ set of the  Board or  other  committee  appointed by  the Board Yes NA NA NA Apple Inc. 1 NA NA NA NA NA NA NA NA NA NA NA NA NA NA NA NA NA NA Senior  Manager/Offi cer Yes NA NA NA BT Group PLC 9 No Individual/Su b‐set of the  Board or  other  committee  appointed by  the Board Yes NA NA NA NA NA NA Yes Yes NA 2 Risks driven by changes  in regulation; Risks  driven by changes in  physical climate  parameters; Risks  driven by changes in  other climate‐related  developments Yes NA NA NA Individual/Sub‐ set of the  Board or  other  committee  appointed by  the Board Yes Yes No Third party  verification  or assurance  complete Amazon.com, Inc. 0 NA NA NA NA NA NA NA NA NA NA NA NA NA NA NA NA NA NA NA NA NA NA NA 5/24/2016 Subscribe at www.csrhub.com for access to the CSRHub Dashboard CSRHub Dashboard Carbon ‐ Copyright © 2016 CSRHub Dashboard created 2016‐02‐23
  • 6. 1 1 4 4 4 3 1 4 4 3 3 3 1 1 1 1 1 3 1 0 1 1 0 0 0 0 0 4 4 1 1 1 2 4 1 1 2 2 2 4 4 4 4 4 2 4 5 4 4 5 5 5 5 5 20% 20% 80% 80% 80% 60% 20% 80% 80% 60% 60% 60% 20% 20% 20% 20% 20% 60% 20% 0% 20% 20% 0% 0% 0% 0% 0% 2014 D isclosure Project 2014 FullD ataC arbon D isclosure Project 2014 FullD ataC arbon D isclosure Project 2014 FullD ata C arbon D isclosure Project 2014 FullD ata C arbon D isclosure Project 2014 FullD ata C arbon D isclosure Project 2014 FullD ata C arbon D isclosure Project 2014 FullD ata C arbon D isclosure Project 2014 FullD ata C arbon D isclosure Project 2014 FullD ata C arbon D isclosure Project 2014 FullD ata C arbon D isclosure Project 2014 FullD ata C arbon D isclosure Project 2014 FullD ata C arbon D isclosure Project 2014 FullD ata C arbon D isclosure Project 2014 FullD ata C arbon D isclosure Project 2014 FullD ata C arbon D isclosure Project 2014 FullD ata C arbon D isclosure Project 2014 FullD ata C arbon D isclosure Project 2014 FullD ata C arbon D isclosure Project 2014 FullD ata C arbon D isclosure Project 2014 FullD ataC arbonfund Partners C eres Clim ate & Energy R esolutions 2012 C eres Clim ate & Energy R esolutions 2012 EPA e-G G RT 2011 EPA e-G G RT 2011 EPA e-G G RT 2012 EPA e-G G RT 2012 EPA 14.2a. Please indicate the  proportion of your Scope  3 emissions that are  verified/assured 14.4. Do you  engage with  any of the  elements of  your value  chain on GHG  emissions and  climate  change  strategies?  (Tick all that  apply) 2.2. Is  climate  change  integrated  into your  business  strategy? 2.3. Do you  engage in  activities that  could either  directly or  indirectly  influence  policy on  climate  change  through any of  the following?  (tick all that  apply) 2.3b. Are  you on the  Board of  any trade  association s or  provide  funding  beyond  membersh ip? 2.3d. Do  you  publically  disclose a  list of all  the  research  organizati ons that  you fund? 2.3e. Do  you fund  any  research  organizati ons to  produce  public  work on  climate  change? 3.2. Does the  use of your  goods and/or  services  directly enable  GHG emissions  to be avoided  by a third  party? 4.1. Have you  published information  about your company’s  response to climate  change and GHG  emissions  performance for this  reporting year in  other places than in  your CDP response? 5.1. Have you  identified any climate  change risks (current  or future) that have  potential to generate  a substantive change  in your business  operations, revenue  or expenditure? 6.1. Have you identified any  climate change opportunities  (current or future) that have  the potential to generate a  substantive change in your  business operations, revenue  or expenditure? Tick all that  apply 6.1a  Identified  climate  change  opportunities  that are  driven by  changes in  regulation? 7.2. Please give the  name of the  standard, protocol or  methodology you  have used to collect  activity data and  calculate Scope 1  and Scope 2  emissions 8.6. Please  indicate the  verification/ass urance status  that applies to  your reported  Scope 1  emissions 8.6a. Please  indicate the  proportion  of your  Scope 1  emissions  that are  verified/assu red 8.7. Please  indicate the  verification/ass urance status  that applies to  your reported  Scope 2  emissions 8.7a.  Please  indicate  the  proportion  of your  Scope 2  emissions  that are  verified/as sured 8.9. Are carbon  dioxide  emissions from  biologically  sequestered  carbon  relevant to  your  organization? Verificatio n/  assurance List of  companies who  purchase  carbon offsets  through  carbonfund.org 2012 Vote Rating Is Some CO2  captured on‐ site and  therefore not  emitted? Percentage of  facilities that  employ  continuous  emissions  monitoring Does the facility  employ  continuous  emissions  monitoring? Is Some CO2  captured on‐ site and  therefore  not emitted? Is some CO2  reported as  emissions from the  affected  manufacturing  process unit(s) under  Subpart AA, G or P  collected and  transferred off‐site  or injected (as  reported under  Subpart PP)? NA NA Yes Yes No No NA No 2 NA NA NA NA NA NA NA NA NA NA NA NA NA NA NA NA NA NA NA NA Yes Yes Yes NA NA Yes 3 Risks driven by  changes in  regulation; Risks  driven by changes  in physical climate  parameters; Risks  driven by changes  in other climate‐ related  developments Opportunities driven by  changes in regulation;  Opportunities driven by  changes in physical climate  parameters; Opportunities  driven by changes in other  climate‐related  developments Yes NA NA NA NA NA Yes NA NA NA NA NA NA NA NA NA NA NA Yes Yes Yes No NA Yes 40 Risks driven by  changes in  regulation; Risks  driven by changes  in physical climate  parameters; Risks  driven by changes  in other climate‐ related Opportunities driven by  changes in regulation;  Opportunities driven by  changes in physical climate  parameters; Opportunities  driven by changes in other  climate‐related  developments Yes NA NA NA NA NA Yes 123 NA NA Withdra wn;  Company  will  address NA NA NA NA NA High  assurance/https://ww w.cdp.net/sites/2014/7 7/2377/Investor CDP  2014/Shared  Documents/Attachmen ts/CC14.2a/LRQA ‐ BT  assurance statement  2013‐14.PDF/page 1‐2 Yes, our  suppliers;  Yes, our  customers;  Yes, other  partners in  the value  chain Yes Yes No  Response No Yes Yes In mainstream  financial reports  (complete)/47/http s://www.cdp.net/si tes/2014/77/2377/ Investor CDP  2014/Shared  Documents/Attach ments/CC4.1/2014 _BT_Annual_Repor t.pdf Risks driven by  changes in  regulation; Risks  driven by changes  in physical climate  parameters; Risks  driven by changes  in other climate‐ related  developments Opportunities driven by  changes in regulation;  Opportunities driven by  changes in physical climate  parameters; Opportunities  driven by changes in other  climate‐related  developments Explanation The Greenhouse  Gas Protocol: A  Corporate  Accounting and  Reporting  Standard (Revised  Edition)// Third party  verification or  assurance  complete 1 Apr  2013/31  Mar  2014/High  assurance Third party  verification or  assurance  complete See Table  Sheet No NA NA NA NA NA NA NA NA NA NA NA NA NA NA NA NA NA NA NA NA NA NA NA NA NA NA NA NA NA Vote:  21.2% NA NA NA NA NA NA 5/24/2016 Subscribe at www.csrhub.com for access to the CSRHub Dashboard CSRHub Dashboard Carbon ‐ Copyright © 2016 CSRHub Dashboard created 2016‐02‐23
  • 7. 2 0 5 2 3 5 0 3 40% 0% 100% 40% A e-G G RT 2012 G reenpeace CloudInterfax ERA 2012 N ew sw eek Top 500 G lobalG reen C om panies 2015 N ew sw eek Top 500 G reen C om panies 2015 Renewables  Advocacy Transpare ncy Sustainability  Themed  Committee Sustainability  Themed Committee NA NA 0.05 NA NA NA 0.05 NA D NA 0 0.05 NA NA 0.05 NA F NA 0 0 5/24/2016 Subscribe at www.csrhub.com for access to the CSRHub Dashboard CSRHub Dashboard Carbon ‐ Copyright © 2016 CSRHub Dashboard created 2016‐02‐23
  • 8. Reported Carbon Information (Data collected by these sources on these aspects of carbon reporting.) Yes 1 1 1 1 0 3 3 3 0 0 0 0 0 0 0 0 3 1 1 1 3 3 3 3 3 3 3 3 1 1 NA 4 4 4 4 5 2 2 2 5 5 5 5 5 5 5 5 2 4 4 4 2 2 2 2 2 2 2 2 4 4 % Yes 20% 20% 20% 20% 0% 60% 60% 60% 0% 0% 0% 0% 0% 0% 0% 0% 60% 20% 20% 20% 60% 60% 60% 60% 60% 60% 60% 60% 20% 20% 103 Different Reported Facts AM EE AM EE AM EE AM EE B Corporation G IIRS Ratings Bloom berg N ew Energy Finance Index (CREX) Bloom berg N ew Energy Finance Index (CREX) Bloom berg N ew Energy Finance Index (CREX) Bloom berg N ew Energy Finance Index (CREX) Bloom berg N ew Energy Finance Index (CREX) Bloom berg N ew Energy Finance Index (CREX) Bloom berg N ew Energy Finance Index (CREX) Bloom berg N ew Energy Finance Index (CREX) Bloom berg N ew Energy Finance Index (CREX) Bloom berg N ew Energy Finance Index (CREX) Bloom berg N ew Energy Finance Index (CREX) Carbon D isclosure Project 2013 FullD ata Carbon D isclosure Project 2013 FullD ataCarbon D isclosure Project 2013 FullD ataCarbon D isclosure Project 2013 FullD ata Carbon D isclosure Project 2013 FullD ata Carbon D isclosure Project 2013 FullD ata Carbon D isclosure Project 2013 FullD ata Carbon D isclosure Project 2013 FullD ata Carbon D isclosure Project 2013 FullD ata Carbon D isclosure Project 2013 FullD ata Carbon D isclosure Project 2013 FullD ata Carbon D isclosure Project 2013 FullD ata Carbon D isclosure Projec FullD ata Carbon D Company Simple Count Emissionsperassets Emissionsperemployee Emissionspersale emissions_total_tco2e EnergyUsePts %Renewablesexcludingoffsets 2011ElectricityUsage/MWh 2011RenewablesUsage/MWh Biomass/Biofuel(%) Blend(%) Geothermal(%) Hydro(%) Solar(%) Unknown(%) Wastetoenergy(%) Wind(%) 12.1.Howdoyourabsoluteemissions (Scope1and2combined)forthereporting yearcomparetothepreviousyear? 12.2.Pleasedescribeyourgrosscombined Scope1and2emissionsforthereporting yearinmetrictonnesCO2eperrevenue: Intensityfigure/Metricnumerator/%change frompreviousyear/Directionofchangefrom previousyear/Reasonforchange 12.3.Pleasedescribeyourgrosscombined Scope1and2emissionsforthereporting yearinmetrictonnesCO2eperFTE: Intensityfigure/Metricnumerator/%change frompreviousyear/Directionofchangefrom previousyear/Reasonforchange 12.4.Pleaseprovideanadditionalintensity (normalized)metricthatisappropriateto yourbusinessoperations:Intensity figure/Metricnumerator/%changefrom previousyear/Directionofchangefrom previousyear/Reasonforchange 2013PerformanceBand 2013Score 8.2.PleaseprovideyourgrossglobalScope1 emissionsfigureinmetrictonnesCO2efor 2010-01Jul2010-30Jun2011reporting period 8.2.PleaseprovideyourgrossglobalScope1 emissionsfigureinmetrictonnesCO2efor 2011-01Jul2011-30Jun2012reporting period 8.2.PleaseprovideyourgrossglobalScope1 emissionsfigureinmetrictonnesCO2efor 2012-01Jul2012-30Jun2013reporting period 8.3.PleaseprovideyourgrossglobalScope2 emissionsfigureinmetrictonnesCO2efor 2010-01Jul2010-30Jun2011reporting period 8.3.PleaseprovideyourgrossglobalScope2 emissionsfigureinmetrictonnesCO2efor 2011-01Jul2011-30Jun2012reporting period 8.3.PleaseprovideyourgrossglobalScope2 emissionsfigureinmetrictonnesCO2efor 2012-01Jul2012-30Jun2013reporting period 12.2.Pleasedescribeyourgrosscombined Scope1and2emissionsforthereporting yearinmetrictonnesCO2eperunitcurrency totalrevenue 12.3.Pleasedescribeyourgrosscombined Scope1and2emissionsforthereporting yearinmetrictonnesCO2eperfulltime equivalent(FTE)employee Deutsche Post AG 6 NA NA NA NA NA 39 183700 0 719000 NA NA NA NA NA NA NA NA Increased 9.7E‐05/metric  tonnes  CO2e/3/Decreas e/As requested,  we provide the  intensity figure  as "Metric  tonnes CO2 /  EUR revenue": 2011: 5,300,000  t CO2 / 52,829  mn EUR =  0 000100 12.54/metric  tonnes  CO2e/0.2/Increa se/As requested,  we provide the  intensity figure  as "Metric  tonnes CO2 /  FTE employee": 2011: 5,300,000  t CO2 / 423,502  FTE = 12.51 2012: 5 370 000 84/metric  tonnes  CO2e/2/Decreas e/Value valid  for: DPDHL Total  Carbon  Efficiency Index  2007: 100  2008: 98  2009: 93  2010: 88  2011: 86 B 98 0 0 4800000 0 0 4800000 NA NA HENKEL KGAA 1 NA NA NA NA NA NA NA NA NA NA NA NA NA NA NA NA Decreased NA NA NA B 85 0 0 317400 0 0 317400 NA NA Apple Inc. 3 NA NA NA NA NA 9 580921 54000 NA NA NA NA NA NA NA NA NA NA NA NA NA NA NA NA NA NA NA NA NA NA BT Group PLC 8 8.83774 01036e‐ 005 23.3 348 0.00 01 3940 00 NA 42 221000 0 928200 NA NA NA NA NA NA NA NA Decreased NA NA NA A 93 0 0 200876 0 0 200876 13.79/met ric tonnes  CO2e/unit  total  revenue 4.4/metric  tonnes  CO2e/FTE  employee Amazon.com, Inc. 0 NA NA NA NA NA NA NA NA NA NA NA NA NA NA NA NA NA NA NA NA NA NA NA NA NA NA NA NA NA NA 5/24/2016 Subscribe at www.csrhub.com for access to the CSRHub Dashboard CSRHub Dashboard Carbon ‐ Copyright © 2016 CSRHub Dashboard created 2016‐02‐23
  • 9. 1 1 1 0 0 4 0 0 4 0 0 4 4 4 4 1 1 0 0 1 1 1 0 5 0 0 0 0 5 3 0 5 0 5 2 0 5 5 4 4 4 5 5 1 5 5 1 5 5 1 1 1 1 4 4 5 5 4 4 4 5 0 5 5 5 5 0 2 5 0 5 0 3 5 0 0 20% 20% 20% 0% 0% 80% 0% 0% 80% 0% 0% 80% 80% 80% 80% 20% 20% 0% 0% 20% 20% 20% 0% 100% 0% 0% 0% 0% 100% 60% 0% 100% 0% 100% 40% 0% 100% 100% ect 2014 taD isclosure Project 2014 FullD ata Carbon D isclosure Project 2014 FullD ata Carbon D isclosure Project 2014 FullD ata Carbon D isclosure Project 2014 FullD ata Carbon D isclosure Project 2014 FullD ata Carbon D isclosure Project 2014 FullD ata Carbon D isclosure Project 2014 FullD ata Carbon D isclosure Project 2014 FullD ata Carbon D isclosure Project 2014 FullD ata Carbon D isclosure Project 2014 FullD ata Carbon D isclosure Project 2014 FullD ata Carbon D isclosure Project 2014 FullD ata Carbon D isclosure Project 2014 FullD ata Carbon D isclosure Project 2014 FullD ata Carbon D isclosure Project 2014 FullD ata Carbon D isclosure Project 2014 FullD ata Carbon D isclosure Project 2014 FullD ata Carbon D isclosure Project 2014 FullD ata Carbon M arket D ata Carbon M arket D ata Clim ate Counts 2013 Clim ate Counts 2013 Clim ate Counts 2013 CR’s 100 Best Corporate Citizens 2014 Environm entalInvestm ent O rganisation Environm entalInvestm ent O rganisation Environm entalInvestm ent O rganisation Environm entalInvestm ent O rganisation Environm entalInvestm ent O rganisation Environm entalInvestm ent O rganisation Environm entalInvestm ent O rganisation Environm entalInvestm ent O rganisation Environm entalInvestm ent O rganisation Environm entalInvestm ent O rganisation Environm entalInvestm ent O rganisation Environm entalInvestm ent O rganisation Environm entalInvestm ent O rganisation Environm entalIn O rga Envi 14.1.Organization’sScope3emissions, disclosingandexplain 2013score 2014PerformanceBand 8.2.PleaseprovideyourgrossglobalScope1 emissionsfigureinmetrictonnesCO2efor 2011-01Jul2011-30Jun2012reporting id 8.2.PleaseprovideyourgrossglobalScope1 emissionsfigureinmetrictonnesCO2efor 2012-01Jul2012-30Jun2013reporting id 8.2.PleaseprovideyourgrossglobalScope1 emissionsfigureinmetrictonnesCO2efor 2013-01Jul2013-30Jun2014reporting id 8.3.PleaseprovideyourgrossglobalScope2 emissionsfigureinmetrictonnesCO2efor 2011-01Jul2011-30Jun2012reporting id 8.3.PleaseprovideyourgrossglobalScope2 emissionsfigureinmetrictonnesCO2efor 2012-01Jul2012-30Jun2013reporting id 8.3.PleaseprovideyourgrossglobalScope2 emissionsfigureinmetrictonnesCO2efor 2013-01Jul2013-30Jun2014reporting id 8.9.BiogenicallygeneratedtonnesCO2efor 2011-01Jul2011-30Jun2012reporting period 8.9.BiogenicallygeneratedtonnesCO2efor 2012-01Jul2012-30Jun2013reporting period 8.9.BiogenicallygeneratedtonnesCO2efor 2013-01Jul2013-30Jun2014reporting period Reportedbiogenicallygeneratedmetric tonnesCO2efor2013reportingperiod? ReportedgrossglobalScope1emissions figureinmetrictonnesCO2efor2013 reportingperiod? ReportedgrossglobalScope2emissions figureinmetrictonnesCO2efor2013 reportingperiod? Scope1emissions Scope2emissions CarbonIntensity(tCO2/$mrevenue)ratio OriginalValue(EUETSverifiedemissions 2012(tCO2)) Context-BasedCumulativePerformance Score(‘05-‘12) RankbyContext-BasedScore(1to100) Sustainable ClimateChangeRank AcceptedorInferredScope3Intensity Asia-Pacific300CarbonRank Asia-Pacific300CarbonRanking BRICS300CarbonRank BRICS300CarbonRanking CombinedScope1+2+3Intensity Europe300CarbonRank Europe300CarbonRanking Global800CarbonRank Global800CarbonRanking No.ofScope3CategoriesReported NorthAmerica300CarbonRank NorthAmerica300CarbonRanking ReportedScope1+2Total(tCO2e) ReportedScope3Intensity NA NA NA NA NA 512000 0 NA NA 490000 NA NA 44900 Yes Yes Yes NA NA NA NA NA NA NA NA 2130.92 NA NA NA NA 1141.56 38 NA 85 NA 1 NA NA 5300000 328.79 NA NA NA NA NA 307500 NA NA 325700 NA NA 12500 Yes Yes Yes NA NA NA NA NA NA NA NA 856.03 NA NA NA NA 459.71 177 NA 208 NA ‐ NA NA 652000 ‐ NA NR A NA NA 30393 NA NA 91505 NA NA 17236 Yes Yes Yes 30393 91,505  abs NA NA NA NA NA NA 314.82 NA NA NA NA 570.8 NA NA 428 NA 4 32 NA Unclear ‐ Purchased  goods and  services/Rel evant,  calculated/1 883463 NA NA NA NA 182000 NA NA 70243 NA NA No  Respons e No Yes Yes NA NA NA NA 1.398 84 N NA 71.44 NA NA NA NA 57.48 24 NA 6 NA 3 NA NA 710000 1.41 NA NA NA NA NA NA NA NA NA NA NA NA NA NA NA NA NA NA NA NA NA NA NA 2475.03 NA NA NA NA 1380.21 NA NA 721 NA ‐ 255 NA ‐ ‐ 5/24/2016 Subscribe at www.csrhub.com for access to the CSRHub Dashboard CSRHub Dashboard Carbon ‐ Copyright © 2016 CSRHub Dashboard created 2016‐02‐23
  • 10. 5 5 5 0 0 0 0 0 0 0 0 0 0 0 0 0 0 3 3 2 2 0 0 0 4 4 5 5 5 1 1 2 2 2 5 0 0 0 5 5 5 5 5 5 5 5 5 5 5 5 5 5 2 2 3 3 5 5 5 1 1 0 0 0 4 4 3 3 3 0 100% 100% 100% 0% 0% 0% 0% 0% 0% 0% 0% 0% 0% 0% 0% 0% 0% 60% 60% 40% 40% 0% 0% 0% 80% 80% 100% 100% 100% 20% 20% 40% 40% 40% 100% nvestm ent anisation vironm entalInvestm ent O rganisation Environm entalInvestm ent O rganisation Environm entalInvestm ent O rganisation Environm entalInvestm ent O rganisation EPA e-G G RT 2011 EPA e-G G RT 2011 EPA e-G G RT 2011 EPA e-G G RT 2011 EPA e-G G RT 2011 EPA e-G G RT 2012 EPA e-G G RT 2012 EPA e-G G RT 2012 EPA e-G G RT 2012 EPA e-G G RT 2012 EPA e-G G RT 2012 EPA e-G G RT 2012 EPA e-G G RT 2012 EPA e-G G RT 2012 ET G lobalIndex ET G lobalIndex G reenpeace Cloud G reenpeace Cloud Interfax ERA 2012 Interfax ERA 2012 Interfax ERA 2012 N ew sw eek Top 500 G lobalG reen Com panies 2013 N ew sw eek Top 500 G lobalG reen Com panies 2013 N ew sw eek Top 500 G lobalG reen Com panies 2013 N ew sw eek Top 500 G lobalG reen Com panies 2015 N ew sw eek Top 500 G lobalG reen Com panies 2015 N ew sw eek Top 500 G reen Com panies 2013 N ew sw eek Top 500 G reen Com panies 2013 N ew sw eek Top 500 G reen Com panies 2013 N ew sw eek Top 500 G reen Com panies 2015 N ew sw eek Top 500 G reen Com panies 2015 RepRisk ESG Business Intelligence ReportedScope3Total(tCO2e) Scope1+2Intensity Scope3DisclosureLeaderAward Percentageofnon-biogenicCO2(outoftotal directemissions) SumofBiogenicCO2emissions SumofCO2emissions(non-biogenic) SumofMethane(CH4)emissions SumofPFCemissions Percentageofnon-biogenicCO2(outoftotal directemissions) StationaryCombustion SumofBiogenicCO2emissions(metrictons) SumofCO2emissions(non-biogenic) SumofHFCemissions SumofHFEemissions SumofMethane(CH4)emissions SumofPFCemissions Totalreporteddirectemissions RelativeScope1+2Intensity RelativeScope3Intensity CleanEnergyIndex EnergyEfficiency&GHGMitigation Dynamicsofefficiency Efficiency:Ecoenergy Efficiency:Technology CarbonProductivity EnergyProductivity NewsweekGreenScore CarbonProductivity EnergyProductivity CarbonProductivity EnergyProductivity NewsweekGreenScore CarbonProductivity EnergyProductivity EnvironmentalFootPrint 2290000 0 76.1 No NA NA NA NA NA NA NA NA NA NA NA NA NA NA 0.41 29 2.55 15 NA NA NA NA NA 0.612 0.399 0.502 0.063 0.06 NA NA NA NA NA 0.4 ‐ 31.69 No NA NA NA NA NA NA NA NA NA NA NA NA NA NA 0.06 46 0.02 91 NA NA NA NA NA 0.472 0.387 0.533 0.091 0.084 NA NA NA NA NA 1 ‐ 413.39 No NA NA NA NA NA NA NA NA NA NA NA NA NA NA NA NA 0.15 3 D NA NA NA 0.963 0.918 0.569 0.127 0.107 0.963 0.918 0.569 0.115 0.09 3 46000 21.76 No NA NA NA NA NA NA NA NA NA NA NA NA NA NA 0.10 13 0.00 18 NA NA NA NA NA 0.384 0.53 0.462 0.134 0.099 NA NA NA NA NA 0.4 ‐ 142.7 No NA NA NA NA NA NA NA NA NA NA NA NA NA NA NA NA 0.13 5 D NA NA NA NA NA 0.014 0 0 NA NA 0.014 0 0 2.8 5/24/2016 Subscribe at www.csrhub.com for access to the CSRHub Dashboard CSRHub Dashboard Carbon ‐ Copyright © 2016 CSRHub Dashboard created 2016‐02‐23
  • 11. Date Setup and Support Information Use this password to unlock a sheet and change its formulas.  Go to Home/Format/Unprotect to enter the password. Unlock Password csrhub Means you can enter information into this cell Enter dates in the format "MM/01/YYYY".  All data sets are as of the first day of the month. Your focus date will automatically be set equal to the latest available data date, unless you change it. Your Focus Date 2015/12 Latest available data date: Earliest available data date: If you need to set a starting date for a graph or table, put it here. Start Date for Graph or Table 2013/12 Statistics for the Focus Data Set Average CSRHub overall rating 54.7 Number of rated companies in the set 15,571 Number of data sources available 413 Number of data sources used this month 182 How to Use a CSRHub Dashboard More instructions & examples are available online. 1.  Go to File, Options, Formulas and change your calculation options to manual.      This will make it easier for you to get started with the Dashboard. See Microsoft's instructions. 2.  Enter your CSRHub username and password in the CSRHub Dashboard authorization dialog box. 3.  Enter the names or ticker for the company or companies you want to study in the pink cells on the Enter Company Names sheet. 5.  Enter the date you would like a chart or table to begin by putting a start date in cell B14.  6.  Press F9 or "Calculate" in the lower left corner to update the sheet. 7.  Review the results of your research in the other tabs in the file. See answers to Frequently Asked Questions (FAQ) here. How to Turn Your CSRHub Dashboard Into a PDF File (Page size and settings have been optimized to print the width of a page in landscape mode.) Direct Save to PDF From Excel 1.  Choose File... Save As from the top menu tab. 2.  Select Save as type… and choose PDF. Printing from Excel to an Adobe PDF 1.  Choose File…Print. 2.  Choose "Adobe PDF" from the printer dropdown list. 3.  Choose your print options from the dropdown list        (one sheet, selected sheets, etc.). 4.  Click the "Print" button at the top. Additional Support Information Created with Version: 2.2 API code base last updated 2/8/2016 API version number 2.2 See samples of the available CSRHub Dashboards at: www.csrhub.com/content/csrhub‐dashboard‐samples/ See the latest CSRHub Dashboard support information and instructions at: www.csrhub.com/content/csrhub‐dashboard‐instructions/ 4.  Put the date you would like to study into cell B11 on the Date Setup and Support sheet.  CSRHub Dashboard Version 12/1/2015 12/1/2008 If you experience a technical problem using your Dashboard, please contact CSRHub support .  There are known problems with some network  firewalls, but we may have a workaround to suggest. 5/24/2016 Subscribe at www.csrhub.com for access to the CSRHub Dashboard CSRHub Dashboard Company Diagnostic ‐ Copyright © 2015 CSRHub Dashboard created 2015‐04‐29 11