♛VVIP Hyderabad Call Girls Chintalkunta🖕7001035870🖕Riya Kappor Top Call Girl ...
Cancer Facts & Figures at a Glance 2011
1. Cancer Facts
& Figures 2011
WA
35,360 NH
MT 8,210 ME
ND VT
5,690 8,820
3,560 MN 3,950
OR
27,600
21,180 MA
ID
SD WI NY 37,470
7,520
4,430 30,530 107,260
WY RI
MI
2,680 6,090
57,010
IA PA
NV NE 17,500 78,030 CT 21,440
12,800 9,430 OH NJ 49,080
UT IL IN 65,060
10,530 65,610 34,050 DE 5,130
CA CO WV
163,480 22,390 KS 11,080 VA MD 28,890
MO 38,720
14,070 KY
32,740 DC 2,830
25,010
NC
TN 48,870
AZ OK 34,750
31,550 NM 18,980 AR SC
9,630 16,070 25,510
MS AL GA
14,990 25,530 44,580
TX
105,000 LA
22,780
AK
3,090 FL
113,400
US
1,596,670
PR
HI N/A
6,710
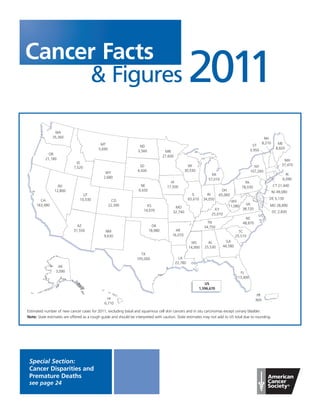
Estimated number of new cancer cases for 2011, excluding basal and squamous cell skin cancers and in situ carcinomas except urinary bladder.
Note: State estimates are offered as a rough guide and should be interpreted with caution. State estimates may not add to US total due to rounding.
Special Section:
Cancer Disparities and
Premature Deaths
see page 24
3. word “risk” in different ways, most commonly expressing risk as
Basic Cancer Facts lifetime risk or relative risk.
Lifetime risk refers to the probability that an individual, over the
course of a lifetime, will develop or die from cancer. In the US,
What Is Cancer? men have slightly less than a 1 in 2 lifetime risk of developing
Cancer is a group of diseases characterized by uncontrolled cancer; for women, the risk is a little more than 1 in 3.
growth and spread of abnormal cells. If the spread is not con
Relative risk is a measure of the strength of the relationship
trolled, it can result in death. Cancer is caused by both external
between risk factors and a particular cancer. It compares the
factors (tobacco, infectious organisms, chemicals, and radia ion)
t
risk of developing cancer in persons with a certain exposure or
and internal factors (inherited mutations, hormones, immune
trait to the risk in persons who do not have this characteristic.
conditions, and mutations that occur from metabo ism). These
l
For example, male smokers are about 23 times more likely to
causal factors may act together or in sequence to initiate or
develop lung cancer than nonsmokers, so their relative risk is 23.
promote carcinogenesis. Ten or more years often pass between
Most relative risks are not this large. For example, women who
exposure to external factors and detectable cancer. Cancer is
have a firstdegree relative (mother, sister, or daughter) with a
treated with surgery, radiation, chemotherapy, hor one therapy,
m
history of breast cancer have about twice the risk of developing
biological therapy, and targeted therapy.
breast cancer, compared to women who do not have this family
history.
Can Cancer Be Prevented?
All cancers involve the malfunction of genes that control cell
All cancers caused by cigarette smoking and heavy use of alco ol h
growth and division. About 5% of all cancers are strongly heredi
could be prevented completely. The American Cancer Society
tary, in that an inherited genetic alteration confers a very high
estimates that in 2011 about 171,600 cancer deaths are expected
risk of developing one or more specific types of cancer. However,
to be caused by tobacco use. Scientific evidence suggests that
most cancers do not result from inherited genes but from
about one-third of the 571,950 cancer deaths expected to occur in
damage to genes occurring during one’s lifetime. Genetic
2011 will be related to overweight or obesity, physical inactiv ty,
i
damage may result from internal factors, such as hormones or
and poor nutrition and thus could also be prevented. Certain
the metabolism of nutrients within cells, or external factors,
cancers are related to infectious agents, such as hepatitis B virus
such as tobacco, chemicals, and excessive exposure to sunlight.
(HBV), human papillomavirus (HPV), human immunode iciency f
virus (HIV), Helicobacter pylori (H. pylori), and others, and could be
prevented through behavioral changes, vaccines, or antibiotics. How Many People Alive Today Have
In addition, many of the more than 2 million skin cancers that Ever Had Cancer?
are diagnosed annually could be pre ented by protection from
v The National Cancer Institute estimates that approximately 11.7
the sun’s rays and avoiding indoor tanning. million Americans with a history of cancer were alive in January
2007. Some of these individuals were cancerfree, while others
Regular screening examinations by a health care professional
still had evidence of cancer and may have been undergoing
can result in the detection and removal of precancerous growths,
treatment.
as well as the diagnosis of cancers at an early stage, when they
are most treatable. Cancers of the cervix, colon, and rectum can
be prevented by removal of precancerous tissue. Cancers that How Many New Cases Are Expected to Occur
can be diagnosed early through screening include cancers of the This Year?
breast, colon, rectum, cervix, prostate, oral cavity, and skin. About 1,596,670 new cancer cases are expected to be diagnosed
However, screening has been shown to reduce mortality only for in 2011. This estimate does not include carcinoma in situ (non
cancers of the breast, colon, rectum, and cervix. A heightened invasive cancer) of any site except urinary bladder, and does not
awareness of breast changes or skin changes may also result in include basal and squamous cell skin cancers, which are not
detection of these tumors at earlier stages. Cancers that can be required to be reported to cancer registries.
prevented or detected earlier by screening account for at least
half of all new cancer cases. How Many People Are Expected to Die of
Cancer This Year?
Who Is at Risk of Developing Cancer? In 2011, about 571,950 Americans are expected to die of cancer,
Anyone can develop cancer. Since the risk of being diagnosed more than 1,500 people a day. Cancer is the second most com
with cancer increases with age, most cases occur in adults who mon cause of death in the US, exceeded only by heart disease. In
are middle aged or older. About 78% of all cancers are diagnosed the US, cancer accounts for nearly 1 of every 4 deaths.
in persons 55 years of age and older. Cancer researchers use the
Cancer Facts & Figures 2011 1
11. density (a mammographic measure of the amount of glandular
Selected Cancers tissue relative to fatty tissue in the breast), high bone mineral
density (routinely measured to identify women at increased risk
for osteoporosis), and biopsyconfirmed hyperplasia (especially
Breast atypical hyperplasia). Highdose radiation to the chest, typically
related to cancer treatment, also increases risk. Reproductive
New Cases: An estimated 230,480 new cases of invasive breast
factors that increase risk include a long menstrual history (men
cancer are expected to occur among women in the US during
strual periods that start early and/or end late in life), recent use
2011; about 2,140 new cases are expected in men. Excluding
of oral contraceptives, never having children, and having one’s
cancers of the skin, breast cancer is the most frequently diag
first child after age 30.
nosed cancer in women. The incidence rate for female breast
cancer began to decline in 2000. The dramatic decrease of Risk is also increased by a personal or family history of breast
almost 7% from 2002 to 2003 has been attributed to reductions cancer and inherited genetic mutations in the breast cancer
in the use of menopausal hormone therapy (MHT), previously susceptibility genes BRCA1 and BRCA2. Although these mutations
known as hormone replacement therapy, following the publica account for approximately 5%10% of all breast cancer cases,
tion of results from the Women’s Health Initiative in 2002; this they are very rare in the general population (less than 1%), so
study found that the use of combined estrogen plus progestin widespread genetic testing is not recommended. Some popula
MHT was associated with an increased risk of breast cancer, as tion groups, such as individuals of Ashkenazi Jewish descent, have
well as coronary heart disease. Since 2003, breast cancer incidence an increased prevalence of BRCA1 and BRCA2 mutation carriers.
rates have been generally stable. Women with a strong family history of breast and/or ovarian
cancer should be offered counseling to determine if genetic test
In addition to invasive breast cancer, 57,650 new cases of in situ
ing is appropriate. Studies suggest that prophylactic removal of
breast cancer are expected to occur among women in 2011. Of
the ovaries and/or breasts in BRCA1 and BRCA2 mutation carriers
these, approximately 85% will be ductal carcinoma in situ (DCIS).
decreases the risk of breast cancer considerably, although not all
Since 1998, in situ breast cancer incidence rates have been stable
women who choose this surgery would have developed breast
in white women and increasing in African American women by
cancer. Women who consider these options should undergo
1.6% per year.
counseling before reaching a decision. Male BRCA gene mutation
Deaths: An estimated 39,970 breast cancer deaths (39,520 carriers are also at increased risk for breast cancer.
women, 450 men) are expected in 2011. Breast cancer ranks second
Modifiable factors that are associated with a lower risk of breast
as a cause of cancer death in women (after lung cancer). Death
cancer include breastfeeding, moderate or vigorous physical
rates for breast cancer have steadily decreased in women since
activity, and maintaining a healthy body weight. Two medica
1990, with larger decreases in women younger than 50 (a
tions, tamoxifen and raloxifene, have been approved to reduce
decrease of 3.2% per year) than in those 50 and older (2.0% per
breast cancer risk in women at high risk. Raloxifene appears to
year). The decrease in breast cancer death rates represents prog
have a lower risk of certain side effects, such as uterine cancer
ress in earlier detection, improved treatment, and more recently,
and blood clots.
decreased incidence.
Research is ongoing to identify additional modifiable risk fac
Signs and symptoms: The earliest sign of breast cancer is often
tors for breast cancer. The International Agency for Research on
an abnormality detected on a mammogram, before it can be felt
Cancer has concluded that there is limited evidence that tobacco
by the woman or a health care professional. Larger tumors may
smoking causes breast cancer. There is also some evidence that
become evident as a painless mass. Less common symptoms
shift work, particularly at night, is associated with an increased
include persistent changes to the breast, such as thickening,
risk of breast cancer.
swelling, distortion, tenderness, skin irritation, redness, scali ess,
n
or nipple abnormalities, such as ulceration, retraction, or spon Early detection: Mammography can often detect breast cancer
taneous discharge. Typically, breast pain results from benign at an early stage, when treatment is more effective and a cure is
conditions and is not an early symptom of breast cancer. more likely. Numerous studies have shown that early detection
saves lives and increases treatment options. Steady declines in
Risk factors: Besides being female, increasing age is the most
breast cancer mortality among women since 1990 have been
important risk factor for breast cancer. Potentially modifiable
attributed to a combination of early detection and improvements
risk factors include weight gain after age 18, being overweight or
in treatment. Mammography is a very accurate screening tool,
obese (for postmenopausal breast cancer), use of combined
both for women at average and increased risk; however, like
estrogen and progestin hormone therapy, physical inactivity, and
most medical tests, it is not perfect. On average, mammography
consumption of one or more alcoholic beverages per day. Medical
will detect about 80%90% of breast cancers in women without
findings that predict higher risk include high breast tissue
symptoms. All suspicious abnormalities should be biopsied for a
Cancer Facts & Figures 2011 9