
Recommended
More Related Content
Similar to C.S. Ganti SAS Modeling Profile Apr 2013
Similar to C.S. Ganti SAS Modeling Profile Apr 2013 (20)
Recently uploaded
Recently uploaded (20)
C.S. Ganti SAS Modeling Profile Apr 2013
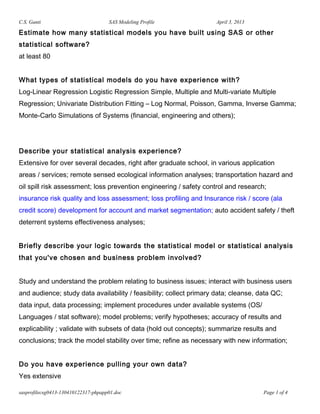
- 1. C.S. Ganti SAS Modeling Profile April 3, 2013 Estimate how many statistical models you have built using SAS or other statistical software? at least 80 What types of statistical models do you have experience with? Log-Linear Regression Logistic Regression Simple, Multiple and Multi-variate Multiple Regression; Univariate Distribution Fitting – Log Normal, Poisson, Gamma, Inverse Gamma; Monte-Carlo Simulations of Systems (financial, engineering and others); Describe your statistical analysis experience? Extensive for over several decades, right after graduate school, in various application areas / services; remote sensed ecological information analyses; transportation hazard and oil spill risk assessment; loss prevention engineering / safety control and research; insurance risk quality and loss assessment; loss profiling and Insurance risk / score (ala credit score) development for account and market segmentation; auto accident safety / theft deterrent systems effectiveness analyses; Briefly describe your logic towards the statistical model or statistical analysis that you've chosen and business problem involved? Study and understand the problem relating to business issues; interact with business users and audience; study data availability / feasibility; collect primary data; cleanse, data QC; data input, data processing; implement procedures under available systems (OS/ Languages / stat software); model problems; verify hypotheses; accuracy of results and explicability ; validate with subsets of data (hold out concepts); summarize results and conclusions; track the model stability over time; refine as necessary with new information; Do you have experience pulling your own data? Yes extensive sasprofilecsg0413-130410122317-phpapp01.doc Page 1 of 4
- 2. C.S. Ganti SAS Modeling Profile April 3, 2013 From what resources have you pulled the data? Hard copy reports, external data bases US Govt. agencies: DOL FRB DOT DOC USCG USGS; internal (own company cross departmental / cross organizational) and trade associations etc API; professional society (ASME) etc. List the query language you have used to pull your data? SAS / SQL; MS ACCESS SQL; COGNOS / SQL (IMPROMPTU); FOCUS What types of analysis are you experienced with running? Base Descriptive and Inferential statistics all statistical procedures and functions and custom programming How do you go about determining which data is important to include in your modeling & analysis? By studying various relations of the process; predicting variables vs. the predicted variable correlations and significance; and after model estimation, checking for the significance of each variable included (by their p values in case of regression) whether it is sufficient, complete and explains with as few logical and explicable variables (parsimony is the key) What databases have you used? FOCUS IBM MAIN-FRAME PC ACCESS DBASE IMS RBASE ORACLE EXTRACTS IN TO COGNOS RELATIONAL TABLES List the statistical analysis software, and what versions you have experienced with? (SAS, SPSS, SAP, Minitab, etc) SAS V8.0 SAS 9.1 PC SYTAT SPSS sasprofilecsg0413-130410122317-phpapp01.doc Page 2 of 4
- 3. C.S. Ganti SAS Modeling Profile April 3, 2013 What operating systems (platforms ) have you run the statistical analysis software on? PC WINPRO, IBM OS, VMS, What volume of datasets do you have experience with? Excess of Several Million What type of variable have you looked at & worked with? All Types, Numeric, Date, Alpha Numeric, Logical (Boolean), Text etc How many variables? Up to several hundreds What procedures have you used? (Proc's ) All Procedures found in typical stat software; Tables (Frequency Etc) descriptive statistics Correlations and regression; General Linear Models Logistic Log-linear Discriminiant analysis Cluster analysis Principal Component Non parametric stats etc Can you describe to me the purpose behind using each SAS procedures? DATA step: procedure reads raw data from various sources (data tables / engines) or direct input data from and process and create SAS data sets or further process SAS data sets for later use in the proc steps; can merge, concatenate data sets; PROC step procedures further process, consolidate, generate reports, charts or statistical analyses Examples are: PROC format assigns formats to variables; PROC SORT sorts data organize output or summarize data outputs SAS data sets; PROC CONTENTS displays contents of data including variable information etc. PROC print prints data; PROC REPORT Proc Means Tabulate Freq etc provide descriptive statistics, inference, model and analyses Proc GCHART and GPLOT are used to generate charts and plots. sasprofilecsg0413-130410122317-phpapp01.doc Page 3 of 4
- 4. C.S. Ganti SAS Modeling Profile April 3, 2013 Describe your familiarity with macros? Very good What statistical methodologies are you experienced with? Univariate and Multi-variate Regression; Logistic and Log-Linear Regression, Distribution fitting; Hypothesis testing; Monte-Carlo Simulation; sasprofilecsg0413-130410122317-phpapp01.doc Page 4 of 4