1. Market Overview
The Toronto North and East office markets, marked by steady availability, competitive
rental rates and new office supply, remained stable through the fourth quarter of
2014. Despite stubbornly high availability, especially in Toronto East, both markets
have active development pipelines to meet growing demand. The gap between
these two suburban markets is beginning to narrow, though the North market,
driven historically by North Yonge and more recently the Vaughan node, continues to
outperform the East.
Double-digit availability and vacancy rates continue in the East market, owing to
new development and large blocks of space returning to the market – the result of
ongoing outsourcing, consolidations and relocations. Notable big-block vacancies
include those left by: Imperial Oil at 90 Wynford Dr. (172,000 square feet (sf));
Postmedia at 1450 Don Mills Rd. (157,000 sf); American Express at 101 McNabb
St. (307,000 sf); and Rogers and Direct Energy at Atria II & III (258,000 sf). The latter
vacancy will be partially resolved as American Express begins occupying its new
home (195,000 sf) at Atria III during the first quarter of 2015. The overall availability
and vacancy rates in Toronto East fell quarter-over-quarter to end 2014 at 13.8% and
12.7%, respectively. New supply additions during the quarter included 169 and 179
Enterprise Blvd. in the Hwy. 404 & 407 node for a combined 94,000 sf, bringing 2014’s
tally to 140,000 sf – the most since 2011 (171,000 sf). This will be eclipsed by Aviva’s
new head office at 7980 Birchmount Rd. (350,000 sf) in early 2017.
Unlike Toronto East, Toronto North’s overall availability (8%) and vacancy (7.8%) rates
remain in single-digit territory, finishing 2014 marginally higher than one year earlier.
North Yonge had an uneventful year for leasing as availability and vacancy remained
relatively unchanged (8.1% and 7.3%, respectively). North Yonge has maintained the
highest average asking net rental rate ($18.21 per square foot (psf)), roughly $3.00
psf higher than the East’s Hwy. 404 & 407 node. Unable to attract an office user for
its proposed 4050 Yonge St. development, Build Toronto sold the 3.1-acre property
to The Gupta Group / Easton’s Group for almost $25 million. The purchaser intends
to expand the site’s use beyond office to include retail and hotel space, highlighting
investor demand for transit-served mixed-use sites. North Yonge has not seen a
significant new development since 5000 Yonge St. was completed in 2004. Further
north, Vaughan’s strong absorption during the second half lifted Toronto North as a
whole into positive territory for 2014. Demand in Vaughan should grow further with
the Toronto-York Spadina Subway Extension and new product coming to market,
notably the KPMG Tower (306,000 sf), set to be delivered in the spring of 2016.
4TH
QUARTER 2014
Toronto North & East Office Market Report
Partnership. Performance.
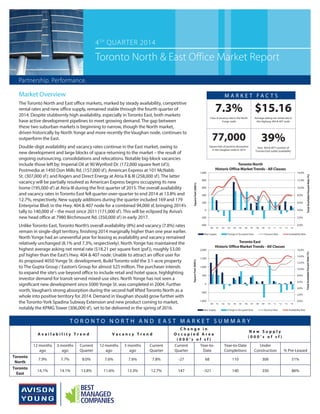
M A R K E T F A C T S
7.3%
Class A vacancy rate in the North
Yonge node
$15.16
Average asking net rental rate in
the Highway 404 & 407 node
77,000
Square feet of positive absorption
in the Vaughan node in 2014
39%
Hwy. 404 & 407’s portion of
Toronto East sublet availability
NUMBER OF
BLDGS
TOTAL OFFICE
AREA (SQ. FT.)
NEW SUPPLY
TOTAL
OCCUPIED
AREA (SQ. FT.)
CHANGE IN
OCCUPIED
AREA (YTD)
(SQ. FT.)
TOTAL
VACANT
AREA (SQ. FT.)
TOTAL
VACANT RATE
(%)
DIRECT
AVAILABLE
(SQ. FT.)
SUBLET
AVAILABLE
(SQ. FT.)
TOTAL
AVAILABLE
(SQ. FT.)
TOTAL
AVAILAB
RATE (%
'00 291 27,911,705 1,244,310 25,802,038 572,334 2,137,447 7.7% 2,230,170 380,890 2,611,060
'01 300 29,425,492 1,749,040 26,320,681 518,643 3,104,811 10.6% 2,572,833 694,536 3,267,369
'02 302 29,866,873 672,905 26,018,306 -302,375 3,848,567 12.9% 3,145,382 720,216 3,865,598
'03 302 29,866,873 25,911,888 -106,418 3,954,985 13.2% 3,306,427 739,149 4,045,576
'04 304 30,079,873 353,000 26,167,343 255,455 3,912,530 13.0% 3,026,816 722,983 3,749,799
'05 306 30,208,177 437,598 26,911,668 744,325 3,296,509 10.9% 3,248,997 582,378 3,831,375
'06 307 30,271,462 63,285 26,812,486 -99,182 3,458,976 11.4% 3,373,093 518,023 3,891,116
'07 309 30,677,902 397,291 27,294,653 482,167 3,383,249 11.0% 2,985,158 487,838 3,472,996
'08 309 30,717,863 151,769 27,348,455 53,802 3,380,808 11.0% 3,274,768 615,566 3,890,334
'09 310 30,794,063 157,200 26,556,847 -791,608 4,238,416 13.8% 3,473,645 738,142 4,211,787
'10 1,077,522 10.7%
'11 170,546 118,221 9.6%
'12 30,000 -496,322 11.4%
'13 36,720 -350,945 11.6%
'14 139,648 -321,325 12.7%
GTA EAST HISTORIC OFFICE MARKET TRENDS
0.0%
2.0%
4.0%
6.0%
8.0%
10.0%
12.0%
14.0%
16.0%
-1,000
-500
0
500
1,000
1,500
2,000
'00 '01 '02 '03 '04 '05 '06 '07 '08 '09 '10 '11 '12 '13 '14
TotalAvailable/VacantRate(%)
SquareFeet(000's)
Toronto East
Historic Office Market Trends - All Classes
New Supply Change In Occupied Area Vacancy Rate Availability Rate
NUMBER OF
BLDGS
TOTAL OFFICE
AREA (SQ. FT.)
NEW SUPPLY
TOTAL
OCCUPIED
AREA (SQ. FT.)
CHANGE IN
OCCUPIED
AREA (YTD)
(SQ. FT.)
TOTAL
VACANT
AREA (SQ. FT.)
TOTAL
VACANT RATE
(%)
DIRECT
AVAILABLE
(SQ. FT.)
SUBLET
AVAILABLE
(SQ. FT.)
TOTAL
AVAILABLE
(SQ. FT.)
TOTAL
AVAILABLE
RATE (%)
'00 97 12,173,113 11,304,633 355,305 868,480 7.1% 891,484 99,453 990,937 8.1%
'01 101 12,344,337 261,224 11,257,355 -47,278 1,086,982 8.8% 1,123,255 149,194 1,272,449 10.3%
'02 100 12,284,337 11,105,144 -152,211 1,179,193 9.6% 1,098,194 158,602 1,256,796 10.2%
'03 99 12,249,337 10,798,662 -306,482 1,450,675 11.8% 1,258,352 217,244 1,475,596 12.0%
'04 102 12,901,829 752,727 11,304,865 506,203 1,596,964 12.4% 1,337,412 323,865 1,661,277 12.9%
'05 104 13,064,556 11,790,009 485,144 1,274,547 9.8% 1,066,511 144,747 1,211,258 9.3%
'06 104 13,064,556 60,000 12,285,143 495,134 779,413 6.0% 745,156 186,263 931,419 7.1%
'07 105 13,175,056 174,556 12,159,327 -125,816 1,015,729 7.7% 783,065 259,804 1,042,869 7.9%
'08 106 13,223,056 198,000 12,539,678 380,351 683,378 5.2% 671,696 193,626 865,322 6.5%
'09 109 13,359,979 102,923 12,310,743 -228,935 1,049,236 7.9% 829,908 387,571 1,217,479 9.1%
'10 0 271,768 5.9% 7.3%
'11 0 220,954 4.1% 4.8%
'12 130,428 -100,155 5.6% 6.1%
'13 230,996 -51,950 7.6% 8.0%
'14 109,873 67,610 7.8% 8.0%
GTA NORTH HISTORIC OFFICE MARKET TRENDS
0.0%
2.0%
4.0%
6.0%
8.0%
10.0%
12.0%
14.0%
-400
-200
0
200
400
600
800
1,000
'00 '01 '02 '03 '04 '05 '06 '07 '08 '09 '10 '11 '12 '13 '14
TotalAvailable/VacantRate(%)
SquareFeet(000's)
Toronto North
Historic Office Market Trends - All Classes
New Supply Change In Occupied Area Vacancy Rate Availability Rate
M A R K E T F A C T S
T O R O N T O N O R T H A N D E A S T M A R K E T S U M M A R Y
A v a i l a b i l i t y T r e n d V a c a n c y T r e n d
C h a n g e i n
O c c u p i e d A r e a
( 0 0 0 ’ s o f s f )
N e w S u p p l y
( 0 0 0 ’ s o f s f )
12 months
ago
3 months
ago
Current
Quarter
12 months
ago
3 months
ago
Current
Quarter
Current
Quarter
Year-to-
Date
Year-to-Date
Completions
Under
Construction % Pre-Leased
Toronto
North
7.9% 7.7% 8.0% 7.6% 7.6% 7.8% -27 68 110 306 51%
Toronto
East
14.1% 14.1% 13.8% 11.6% 13.3% 12.7% 147 -321 140 350 86%
T O R O N T O N O R T H A N D E A S T M A R K E T S U M M A R Y