Download as PDF, PPTX

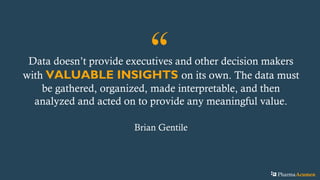

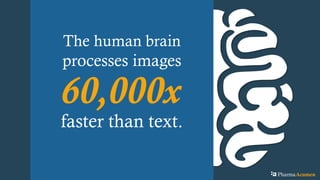


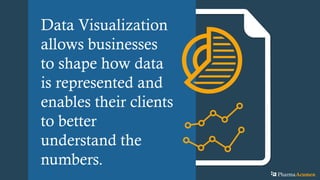


The document outlines five key ways in which data visualization enhances client projects: it helps in understanding texts faster, detects hidden features in data, creates value by enabling quick decision-making, tells impactful stories, and persuades audiences effectively. It emphasizes that visual representations of data are significantly more efficient in communication than text, leading to better insights and decision-making. The overall takeaway is that data visualization is a powerful tool for businesses to communicate and tell compelling narratives.