
Recommended
More Related Content
Similar to Daily market insight- June 6.pdf
Similar to Daily market insight- June 6.pdf (20)
More from BluechipInvestment
More from BluechipInvestment (20)
Recently uploaded
Recently uploaded (20)
Daily market insight- June 6.pdf
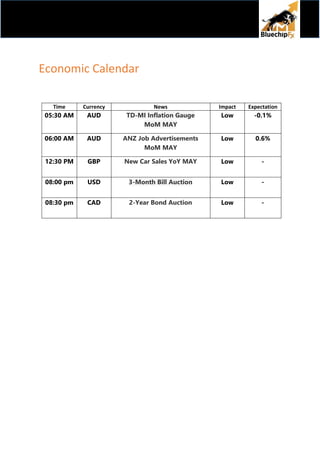
- 1. Economic Calendar Time Currency News Impact Expectation 05:30 AM AUD TD-MI Inflation Gauge MoM MAY Low -0.1% 06:00 AM AUD ANZ Job Advertisements MoM MAY Low 0.6% 12:30 PM GBP New Car Sales YoY MAY Low - 08:00 pm USD 3-Month Bill Auction Low - 08:30 pm CAD 2-Year Bond Auction Low -
- 2. AUD/USD TREND: NEUTRAL Technical Outlook: On the daily chart AUD/USD looks pressured at it trades below 0.7200 mark. Traders can sell from the current price following a strict stop loss. Indicators Daily chart Status RSI 54 Bullish STOCHASTIC 73 Bullish MACD Above midline Bullish 200 EMA 0.7265 Bearish Outlook Neutral Strategy Action Entry Target 1 Target 2 Stop Loss SELL 0.7190 0.7160 0.7130 0.7220
- 3. NZD/USD TREND: NEUTRAL Technical Outlook: On the daily chart NZD/USD is looking bearish as it trades to the downside. The price is not able to move beyond 0.6500 as the selling pressure remains intact Indicators Daily chart Status RSI 50 Bullish STOCHASTIC 73 Bullish MACD Below midline Bearish 200 EMA 0.6754 Bearish Outlook Neutral Strategy Action Entry Target 1 Target 2 Stop Loss SELL 0.6500 0.6470 0.6430 0.6530
- 4. EUR/USD TREND: NEUTRAL Technical Outlook: The bulls manage to trade above 1.0720 with strong buying momentum. A psychological level to be maintained for further gain in the spot. Indicators Daily chart Status RSI 53.87 Bullish STOCHASTIC 80.73 Bullish MACD Above midline Bullish 200 EMA 1.1144 Bearish Outlook Neutral Strategy Action Entry Target 1 Target 2 Stop Loss BUY 1.0720 1.0750 1.0780 1.0690 .
- 5. GBP/USD TREND: BEARISH Technical Outlook: The British pound gathers strength to trade higher against USD. The pair strong resistance near 1.2500. Indicators Daily chart Status RSI 46 Bearish STOCHASTIC 48 Bearish MACD Below midline Bearish 200 EMA 1.3165 Bearish Outlook Bearish Strategy Action Entry Target 1 Target 2 Stop Loss BUY 1.2650 1.2580 1.2610 1.2520
- 6. USD/JPY TREND: BULLISH Technical Outlook: On the daily Chart USD/JPY breaks below 131.00 .The spot trade with a negative bias and expected to take out 130.50 support level. Indicators Daily chart Status RSI 62 Bullish STOCHASTIC 88 Bullish MACD Above midline Bullish 200 EMA 119.21 Bullish Outlook Bullish Strategy Action Entry Target 1 Target 2 Stop Loss SELL 130.60 130.30 130.00 130.90
- 7. USD/CAD TREND: BEARISH Technical Outlook: USD/CAD hovers near the crucial support level around 1.2580. A daily close below this level would bring more losses in the spot. Indicators Daily chart Status RSI 37 Bearish STOCHASTIC 10 Bearish MACD Below midline Bearish 200 EMA 1.2676 Bearish Outlook Neutral Strategy Action Entry Target 1 Target 2 Stop Loss SELL 1.2580 1.2530 1.2500 1.2610
- 8. USD/CHF TREND: NEUTRAL Technical Outlook: USD/CHF continues to trade in a range bound manner between 0.9550-0.9650 for the past few weeks. A new directional setup will be formed beyond this range of trade. Indicators Daily chart Status RSI 44 Bearish STOCHASTIC 20 Bearish MACD Below midline Bearish 200 EMA 0.9377 Bullish Outlook Neutral Strategy Action Entry Target 1 Target 2 Stop Loss SELL 0.9620 0.9590 0.9560 0.9650
- 9. GOLD TREND: NEUTRAL Technical Outlook: On the daily chart, XAU/USD hovers in the familiar range of $1,845-$1,860. A break of this range will set the next directional bias. Indicators Daily chart Status RSI 48 Bearish STOCHASTIC 71 Bullish MACD Below midline Bearish 200 EMA $1,856.40 Bearish Outlook Neutral Strategy Action Entry Target 1 Target 2 Stop Loss BUY $1855 $1865 $1875 $1,845