SlideShare a Scribd company logo
1 of 119
Download to read offline
THE QUARTERLY JOURNAL OF THE GEMOLOGICAL INSTITUTE OF AMERICA
WINTER2007PAGES291–408VOLUME43NO.4
VOLUME XLIII WINTER 2007
GEMS&GEMOLOGY
CVD Synthetic Diamonds
Canary Tourmaline
Fluorescence Spectroscopy
Napoleon Necklace
®
Carat Points
pg. 329
VOLUME 43, NO. 4Winter 2007
291
294
332
352
314
358
366
395
392
401
REGULAR FEATURES _____________________
Lab Notes
Apatite in spessartine • Atypical photoluminescence feature in a type IIa
diamond • Diamond with “holiday” inclusions • Diamond with large etch
channels containing iron sulfides • Black diamond with an oriented etch
channel • The pareidolia of diamonds • Notable emerald carving • Gold
coated onyx • Double-star sapphire • Imitation turquoise
Gem News International
Record auction prices for diamonds • Namibian diamond mining
• Double jeopardy in amber • Andradite from Namibia • Andradite from Pakistan
• Axinite from Tanzania • Baddeleyite from Mogok, Myanmar • Chrysocolla
chalcedony from Iran/Armenia area • Clinohumite and chondrodite from
Tanzania • Transparent dumortierite and sapphirine from Tanzania • Brazilian
blue “opal” • Otolith pendant • Inclusions in quartz from Paraíba, Brazil • Sinhalite
from Myanmar • Cu-bearing tourmaline mines in Mozambique • New Cu-bearing
tourmaline from Nigeria • Synthetic beryl simulating “Paraíba” tourmaline
• YAG with a “reverse” color change • Conference reports
Book Reviews
Gemological Abstracts
2007 Subject and Author Index
LETTERS ________
FEATURE ARTICLES _____________
Latest-Generation CVD-Grown Synthetic Diamonds
from Apollo Diamond Inc.
Wuyi Wang, Matthew S. Hall, Kyaw Soe Moe, Joshua Tower, and Thomas M. Moses
Presents the gemological and spectroscopic properties of Apollo’s latest
products, which show significant improvements in size, color, and clarity.
Yellow Mn-rich Tourmaline from the Canary Mining Area, Zambia
Brendan M. Laurs, William B. Simmons, George R. Rossman, Eric A. Fritz,
John I. Koivula, Björn Anckar, and Alexander U. Falster
Explores the vivid “canary” yellow elbaite from the Lundazi District of
eastern Zambia, the most important source of this tourmaline.
Fluorescence Spectra of Colored Diamonds Using a
Rapid, Mobile Spectrometer
Sally Eaton-Magaña, Jeffrey E. Post, Peter J. Heaney, Roy A. Walters,
Christopher M. Breeding, and James E. Butler
Reports on the use of fluorescence spectroscopy to characterize colored
diamonds from the Aurora Butterfly and other collections.
NOTES AND NEW TECHNIQUES ________
An Examination of the Napoleon Diamond Necklace
Eloïse Gaillou and Jeffrey E. Post
Provides a history and gemological characterization of this historic necklace.
pg. 383
pg. 360
pg. 295
Editor-in-Chief
Alice S. Keller
akeller@gia.edu
Managing Editor
Thomas W. Overton
tom.overton@gia.edu
Technical Editor
Sally Magaña
sally.magana@gia.edu
Consulting Editor
Carol M. Stockton
Contributing Editor
James E. Shigley
Editor
Brendan M. Laurs
The Robert Mouawad Campus
5345 Armada Drive
Carlsbad, CA 92008
(760) 603-4503
blaurs@gia.edu
Associate Editor
Stuart Overlin
soverlin@gia.edu
Circulation Coordinator
Debbie Ortiz
(760) 603-4000, ext. 7142
dortiz@gia.edu
Editors, Lab Notes
Thomas M. Moses
Shane F. McClure
Editor, Gem News International
Brendan M. Laurs
Editors, Book Reviews
Susan B. Johnson
Jana E. Miyahira-Smith
Thomas W. Overton
Editors, Gemological Abstracts
Brendan M. Laurs
Thomas W. Overton
EDITORIAL
STAFF
SUBSCRIPTIONS
MANUSCRIPT
SUBMISSIONS
COPYRIGHT
AND REPRINT
PERMISSIONS
Subscriptions to addresses in the U.S. are priced as follows: $74.95 for one year (4 issues), $194.95 for three years (12 issues).
Subscriptions sent elsewhere are $85.00 for one year, $225.00 for three years. Canadian subscribers should add GST.
Special rates are available for GIA alumni and current GIA students. One year: $64.95 to addresses in the U.S., $75.00 else-
where; three years: $179.95 to addresses in the U.S., $210.00 elsewhere. Please have your student or Alumni number ready
when ordering. Go to www.gia.edu or contact the Circulation Coordinator (see above).
Single copies of this issue (print or PDF) may be purchased for $19.00 in the U.S., $22.00 elsewhere. Discounts are given for bulk
orders of 10 or more copies of any one issue. A limited number of back issues are also available for purchase. Please address all
inquiries regarding subscriptions and single copy or back issue purchases to the Circulation Coordinator or visit www.gia.edu.
To obtain a Japanese translation of Gems & Gemology, contact GIA Japan, Okachimachi Cy Bldg., 5-15-14 Ueno,
Taitoku, Tokyo 110, Japan. Our Canadian goods and service registration number is 126142892RT.
Gems & Gemology’s impact factor is 1.381 (ranking 11th out of the 26 journals in the Mineralogy category), according to
Thomson Scientific’s 2006 Journal Citation Reports (issued July 2007). Full-text electronic (PDF) versions of Gems & Gemology
issues from Spring 2005 to the present are available through EBSCO. Gems & Gemology is abstracted in Thomson Scientific
products (Current Contents: Physical, Chemical & Earth Sciences and Science Citation Index—Expanded, including the Web of
Knowledge) and other databases. For a complete list, see www.gia.edu/gemsandgemology.
Gems & Gemology welcomes the submission of articles on all aspects of the field. Please see the Guidelines for Authors on our
Website, or contact the Managing Editor. Letters on articles published in Gems & Gemology are also welcome.
Abstracting is permitted with credit to the source. Libraries are permitted to photocopy beyond the limits of U.S. copyright law
for private use of patrons. Instructors are permitted to photocopy isolated articles for noncommercial classroom use without fee.
Copying of the photographs by any means other than traditional photocopying techniques (Xerox, etc.) is prohibited without the
express permission of the photographer (where listed) or author of the article in which the photo appears (where no photographer
is listed). For other copying, reprint, or republication permission, please contact the Managing Editor.
Gems & Gemology is published quarterly by the Gemological Institute of America, a nonprofit educational organization
for the gem and jewelry industry, The Robert Mouawad Campus, 5345 Armada Drive, Carlsbad, CA 92008.
Postmaster: Return undeliverable copies of Gems & Gemology to GIA, The Robert Mouawad Campus, 5345 Armada Drive,
Carlsbad, CA 92008.
Any opinions expressed in signed articles are understood to be the opinions of the authors and not of the publisher.
Shigeru Akamatsu
Tokyo, Japan
Edward W. Boehm
Solana Beach, California
James E. Butler
Washington, DC
Alan T. Collins
London, United Kingdom
John Emmett
Brush Prairie, Washington
Emmanuel Fritsch
Nantes, France
Henry A. Hänni
Basel, Switzerland
Jaroslav Hyr`´sl
Prague, Czech Republic
A. J. A. (Bram) Janse
Perth, Australia
Alan Jobbins
Caterham, United Kingdom
Mary L. Johnson
San Diego, California
Anthony R. Kampf
Los Angeles, California
Robert E. Kane
Helena, Montana
Lore Kiefert
New York, New York
Thomas M. Moses
New York, New York
Mark Newton
Coventry, United Kingdom
George Rossman
Pasadena, California
Kenneth Scarratt
Bangkok, Thailand
James E. Shigley
Carlsbad, California
Christopher P. Smith
New York, New York
Christopher M. Welbourn
Reading, United Kingdom
PRODUCTION
STAFF
EDITORIAL
REVIEW BOARD
Art Director Production Assistant Website:
Karen Myers Allison DeLong www.gia.edu
The Napoleon Necklace was presented by Napoleon Bonaparte to his second wife, Empress Marie-Louise, in 1811 to celebrate
the birth of their son. In this issue, the article by Drs. Eloïse Gaillou and Jeffrey Post presents gemological data on a selection of
diamonds from this notable jewel. Necklace courtesy of the Smithsonian Institution, Washington, DC; photo © Harold & Erica
Van Pelt. Painting of Marie-Louise by Giovan Battista Borghesi, courtesy of Scala/Art Resource, New York.
Color separations for Gems & Gemology are by Pacific Plus, Carlsbad, California.
Printing is by Allen Press, Lawrence, Kansas.
© 2007 Gemological Institute of America All rights reserved. ISSN 0016-626X
ABOUT THE
COVER
®
DATABASE
COVERAGE
LETTERS GEMS & GEMOLOGY WINTER 2007 291
In the case of the yellow color treatment, the
authors noted the presence of the N2 center in natural
yellows and the implied absence in treated yellows
(see figure 7). I sincerely doubt that this is the general
case, as it would depend strongly on the starting mate-
rial. I consider this element of the figure somewhat
misleading.
In addition, I do not think that the authors stressed
and warned strongly enough that treated melee of this
type will surely show up in mounted goods without
disclosure, and that few if any jewelers and appraisers
will have a realistic chance of discriminating them
from untreated goods. This is a legal liability problem
for all in the trade and one that requires attention from
industry authorities, and perhaps the authors would
Letters
G&G IN THE BUSH
So there I am, out in the middle of the Tanzanian
bush at Tunduru, spitting distance from Mozam-
bique, on the Muhuwesi River. I’m haggling over a
parcel of sapphire with a miner named Joseph. He
reaches into his bag and pulls out one of the most
dog-eared documents I’ve ever laid eyes on (figure 1).
It’s one of his most treasured possessions.
I thought you and your readers might get a kick out
of this photo.
Richard W. Hughes
Fallbrook, CA
REPLY
The G&G editors indeed enjoyed the photo, and we
would dearly like to replace Mr. Mayunga’s tattered
issue. Any G&G readers who plan to travel to the
area in the near future should contact us so that we
can send a replacement (and a copy of this issue) for
him.
Figure 1. Tanzanian miner Joseph Mayunga, who
lives along the eastern side of the Muhuwesi River
near Mining Area number 8, displays a weathered
copy of the Winter 1996 Gems & Gemology. He was
given the issue by a Sri Lankan gem dealer in
thanks after closing a large deal for chrysoberyl
rough. Photo by R. W. Hughes.
MORE ON COATED
COLORED DIAMONDS
Although the Spring 2007 article by A. H. Shen et al.,
“Serenity coated colored diamonds: Detection and
durability,” imparted a vast amount of technical infor-
mation, I believe it also omitted important elements
and warnings that would be of use to G&G readers
lacking technical backgrounds.
I note that the authors did not show pre- and post-
treatment spectra of the same diamond, but rather
chose to compare arbitrary treated diamonds with their
natural counterparts, a comparison that may be mis-
leading for the vast majority of readers, as it discounts
the inevitability that natural very light fancy-colored
diamonds will be, and probably have been, color
enhanced by this or similar treatments. This important
fact was not stressed enough.
have some suggestions on how the trade could appro-
priately, and simply, handle that.
Finally, GIA has the data to present ratios of treat-
ed spectra normalized to the untreated spectra such
that the relative effects of a particular treatment can
be predicted. It would be in the best interest of educa-
tion that these data be made available on the G&G
web site. In fact, I would suggest that in the future
ASCII text spectral information (wavelength vs.
absorbance) files for all spectra presented in G&G be
made so available.
Martin D. Haske
Brookline, Massachusetts
REPLY
We appreciate Mr. Haske’s thoughtful comments. We
did, in fact, collect pre- and post-treatment spectra of the
same stones. However, we felt that the vast majority of
readers would be more interested in seeing the differ-
ence between a treated diamond and a natural diamond
with similar color. Such information, in our opinion, is
more useful in gem identification than simply compar-
ing pre- and post-treatment spectra.
Indeed, not every yellow diamond shows the N2
absorption feature in its spectra. However, the apparent
color of these treated yellow diamonds is quite close to
that of the “cape” diamonds known to the trade, and
these natural stones typically do display the N2, N3,
and cape absorption lines. Therefore, we tried to show
the difference in spectral features between these treated
stones and natural-color diamonds of similar hue.
However, we do agree that we should have pointed this
out in the figure caption.
We agree wholeheartedly that the issue of treated
melee is an important one. In fact, this is a problem
with any gemstone treatment. We know that there are
irradiated and HPHT-treated melee diamonds in the
market, but there is no easy or simple solution to this
dilemma. Once the coated stones are mounted, espe-
cially in a bezel setting, it can be very difficult to cor-
rectly identify them. We feel the best approach to this
problem is to educate the trade and the public to the
existence of such treatments, and to promote vigilance
in the trade by providing identification information.
These were the main purposes of this article.
With respect to the raw spectral data, the G&G
editors have informed us that they will be happy to
collect and post such data files in the Gems &
Gemology Data Depository, at the discretion of the
authors involved.
Andy H. Shen, Shane F. McClure, and James E. Shigley
Carlsbad, California
Wuyi Wang, Matthew S. Hall, and Thomas M. Moses
New York, New York
Steven Novak
East Windsor, New Jersey
Gems & Gemology author Masashi
Furuya passed away suddenly on
October 23 at the age of 59. Mr.
Furuya, the founder and director of the
Japan Germany Gemmological Labora-
tory in Kofu, Japan, had recently com-
pleted an article titled “Copper-bearing
Tourmalines from New Deposits in
Paraíba State, Brazil” for the journal’s
Fall 2007 issue (pp. 236–239). He was
also a co-author of “Paraíba-type
Copper-bearing Tourmaline from
Brazil, Nigeria, and Mozambique:
Chemical Fingerprinting by LA-ICP-MS” (Spring
2006), which received third place in last year’s Edward
J. Gübelin Most Valuable Article Awards.
After studying German at Reitaku University, Mr.
Furuya traveled to Idar-Oberstein and
received a Diploma in Gemmology
from the German Gemmological
Association in 1972. Four years later, he
was awarded a Diploma in Gemmology
from the Gemmological Association of
Great Britain. Throughout his career,
Mr. Furuya visited many new gem-pro-
ducing localities and introduced those
goods to the Japanese market. He estab-
lished the Japan Germany Gem-
mological Laboratory in 1994 and had
served as a delegate to the International
Gemmological Conference since 1999. Mr. Furuya is
survived by his wife, Kimiko, and son and daughter,
Masaki and Rena. His son will continue the work of
the Japan Germany Gemmological Laboratory.
292 LETTERS GEMS & GEMOLOGY WINTER 2007
IN MEMORIAM
MASASHI FURUYA (1948–2007)
cations for this material. Since then, significant
improvements in growth technique and, conse-
quently, crystal quality have been reported
(Martineau et al., 2004; Yan et al., 2004; Tallaire et
al., 2005; Wang et al., 2005; Miyatake et al., 2007).
Apollo Diamond Inc. of Boston, Massachusetts,
demonstrated its ability to grow single-crystal CVD
synthetic diamonds of moderate gem quality sever-
al years ago (Wang et al., 2003). For the most part,
the samples examined in 2003 were relatively small
and of limited thickness for faceting purposes.
Nearly all of these early crystals were predominant-
ly brown with varying degrees of saturation.
Colorless CVD-grown diamonds, both nitrogen
doped and high purity, were also synthesized by
LIMHP-CNRS in France (Achard et al., 2005; Wang
et al., 2005), but the reported crystals were usually
LATEST-GENERATION CVD-GROWN
SYNTHETIC DIAMONDS FROM
APOLLO DIAMOND INC.
Wuyi Wang, Matthew S. Hall, Kyaw Soe Moe, Joshua Tower, and Thomas M. Moses
See end of article for About the Authors and Acknowledgments.
GEMS & GEMOLOGY, Vol. 43, No. 4, pp. 294–312.
© 2007 Gemological Institute of America
Gemological and spectroscopic properties of 43 CVD synthetic diamonds from Apollo Diamond
Inc. were examined to characterize the latest generation of their CVD products. These samples,
which included both faceted gems and partially polished crystals, were provided as representa-
tive examples of Apollo’s 2006–2007 production. Relative to the Apollo CVD products examined
in 2003, the new samples showed significant improvements in size, color, and clarity. In addition
to colorless and near-colorless material, fancy orange-to-pink colors are now produced. These
high-quality CVD-grown diamonds, comparable in color and clarity to natural diamonds, can be
identified using a combination of gemological and spectroscopic properties.
294 NEW CVD-GROWN SYNTHETIC DIAMONDS FROM APOLLO GEMS & GEMOLOGY WINTER 2007
he ability to grow high-quality diamond in
the laboratory has been aggressively pursued
for several decades, due to the value that dia-
mond holds in the semiconductor, optics, and gem
industries. While the growth of gem-quality single-
crystal diamonds under high-pressure, high-temper-
ature (HPHT) conditions has been intensely studied
and well documented, the synthesis of single-crystal
diamond by the chemical vapor deposition (CVD)
technique is relatively new and has evolved rapidly
over the past few years. Before 2003, the CVD tech-
nique was primarily used to grow polycrystalline
diamonds of micrometer size. Badzian and Badzian
(1993) reported the growth of CVD single-crystal
synthetic diamond as thick as 1.2 mm; subsequent-
ly, several other groups (e.g., Doering et al., 1999;
Linares and Doering, 1999) reported the CVD
growth of undoped and boron-doped single-crystal
diamond of approximately 1 mm thickness. Yan et
al. (2004) reported the successful synthesis of
“thick” nitrogen-doped free-standing single-crystal
diamond using the microwave plasma CVD tech-
nique, a discovery that led to numerous new appli-
T
less than 1.6 mm thick. More recent CVD products
from Apollo, however, have shown substantial
improvements in quality.
Apollo Diamond began to formally introduce its
CVD-grown diamonds to the general public in 2007.
They are currently available through Bostonian
Jewelers, a Boston retailer, and via inquiries directed
through the company’s website at www.apollodia-
mond.com. Due to the potential impact that gem-
quality CVD synthetic diamonds might have in the
consumer market, the jewelry industry has shown
great interest in developing a better understanding
of these products, improvements in their quality,
and their potential use in jewelry applications, as
well as the ability of gem-testing laboratories to
identify this material and separate it from natural
diamonds. In this report, we characterize the proper-
ties of CVD synthetic diamonds produced by Apollo
from 2006 to 2007 that are representative of their
current generation of products (figure 1).
CVD GROWTH
The CVD method of growing diamond is very dif-
ferent from the well-known HPHT technique. The
CVD method involves gaseous reagents—typically
a small amount of methane (CH4 as the source of
carbon) in hydrogen (H2)—in a chamber with a sin-
gle-crystal diamond substrate usually with {100} ori-
entation. More than one substrate can be placed in
the reaction chamber to grow several synthetic dia-
mond crystals simultaneously. A reaction among
these components is initiated with a plasma, hot fil-
ament, or combustion flame. Carbon atoms, prod-
ucts of a series of chemical reactions, deposit as dia-
mond on a substrate at relatively low temperatures
(~1000°C) and low pressures (between 10 and 200
torr). The reactants, products, and reactive species
are transported throughout the chamber by diffu-
sion and convection. On the substrate surface, vari-
ous reactions (adsorption, diffusion, and desorption)
occur among the chemical species, leading to the
deposition of synthetic diamond and, ultimately,
the growth of a continuous layer of synthetic dia-
mond. Goodwin and Butler (1997) reviewed the
important features of the growth environment and
critical aspects of the growth process.
MATERIALS AND METHODS
CVD Samples. For this study, Apollo Diamond pro-
vided a total of 43 CVD synthetic diamonds to the
GIA Laboratory for examination; 31 were faceted,
and the remainder were fashioned into cylinders or
partially polished plates. The samples were segregat-
ed into three color groups: colorless to near colorless
(29), fancy orange to pink (11), and dark brown (3).
The entire suite ranged from 0.13 to 1.20 ct. See
NEW CVD-GROWN SYNTHETIC DIAMONDS FROM APOLLO GEMS & GEMOLOGY WINTER 2007 295
Figure 1. The latest-
generation CVD synthetic
diamonds produced by
Apollo Diamond Inc., which
are now available in the
gem market, showed signifi-
cant improvement in quality
compared to those reported
by Wang et al. in 2003.
These representative sam-
ples weigh 0.24–0.67 ct.
Photo by Robert Weldon.
TABLE 1. The three groups of latest-generation Apollo CVD-grown synthetic diamonds examined for this study.
Sample Weight Fluorescence to Fluorescence to
number (ct) long-wave UV short-wave UV
Near colorless
AP-01 Round brilliant Very good 0.15 E VVS2 Inert Inert
AP-02 Princess na 0.30 F VS1 Very weak orange Very weak orange
AP-03 Round brilliant Very good 0.19 F VVS2 Inert Inert
AP-04 Round brilliant Very good 0.14 G VS1 Inert Inert
AP-05 Round brilliant Excellent 0.21 F VS1 Inert Inert
AP-06 Round brilliant Very good 0.16 G VS1 Inert Inert
AP-07 Round brilliant Good 0.20 I SI2 Inert Very weak orange
AP-08 Round brilliant Very good 0.27 H VS2 Inert Inert
AP-09 Round brilliant Very good 0.23 H VVS2 Inert Very weak orange
AP-10 Round brilliant Excellent 0.27 J SI2 Inert Very weak orange
AP-12 Round brilliant Very good 0.20 H VVS2 Inert Inert
AP-13 Round brilliant Good 0.21 L VS2 Inert Inert
AP-14 Round brilliant Very good 0.25 I VS2 Inert Inert
AP-15 Round brilliant Very good 0.30 I SI1 Inert Inert
AP-16 Round brilliant Good 0.25 M VS1 Inert Inert
AP-17 Round brilliant Very good 0.20 J VVS1 Inert Inert
AP-18 Round brilliant Excellent 0.62 K I1 Inert Very weak orange
AP-19 Round brilliant Good 0.28 H VS2 Very weak orange Inert
AP-20 Round brilliant Excellent 0.26 I SI2 Very weak orange Very weak orange
AP-21 Cylinder na 0.36 na na Inert Inert
AP-22 Cylinder na 0.24 na na Inert Inert
AP-23 Cylinder na 0.19 na na Inert Inert
AP-24 Cylinder na 0.31 na na Inert Inert
AP-25 Cylinder na 0.37 na na Inert Inert
AP-26 Cylinder na 0.52 na na Inert Very weak orange
AP-27 Cylinder na 0.13 na na Inert Inert
AP-28 Cylinder na 0.52 na na Inert Inert
AP-29 Cylinder na 0.32 na na Inert Inert
AP-30 Cylinder na 0.25 na na Inert Inert
Orange to pink
AP-31 Tabular na 1.05 Brownish orangy pink na Weak orange, Very weak orange
chalky
AP-32 Tabular na 1.20 Pinkish brown na Very weak orange Very weak orange
AP-33 Rectangular na 0.71 Fancy Dark brownish SI1 Weak orange, Very weak orange
pinkish orange chalky
AP-34 Princess na 0.28 Fancy Dark pink- VS2 Weak orange, Very weak orange
brown chalky
AP-37 Round brilliant na 0.34 Fancy brown-pink VVS2 Weak-to-moderate Very weak orange
orange, chalky
AP-38 Round brilliant na 0.40 Fancy orange-brown SI2 Moderate orangy Weak orangy
yellow yellow
AP-39 Round brilliant na 0.62 Fancy brown-orange SI2 Moderate orangy Weak orangy
yellow yellow
AP-40 Round brilliant na 0.18 Fancy brown-pink VVS2 Weak orange, Weak orange
chalky
AP-41 Round brilliant na 0.16 Fancy brown-pink VVS1 Weak orange, Very weak orange
chalky
AP-42 Round brilliant na 0.58 Fancy brownish VVS1 Moderate orange, Weak orange,
orangy pink chalky chalky
AP-49 Round brilliant na 0.19 Fancy brownish pink VS2 Weak orange, Weak orange,
chalky chalky
Dark brown
AP-35 Round brilliant na 0.33 Fancy Dark yellowish SI1 Inert Inert
brown
AP-50 Round brilliant na 0.46 Fancy Dark orangy VS1 Inert Inert
brown
AP-51 Round brilliant na 0.29 Fancy Dark orangy SI2 Inert Inert
brown
aGIA’s cut grading system applies only to colorless or near-colorless round brilliant cut diamonds. For other shapes and fancy colors,
“na” (not applicable) is indicated.
296 NEW CVD-GROWN SYNTHETIC DIAMONDS FROM APOLLO GEMS & GEMOLOGY WINTER 2007
Shape Cut gradea Color Clarity
NEW CVD-GROWN SYNTHETIC DIAMONDS FROM APOLLO GEMS & GEMOLOGY WINTER 2007 297
table 1 for a full description of the individual sam-
ples. These CVD-grown diamonds are representative
of current Apollo Diamond production processes.
Gemological Examination. For the purpose of this
study, experienced GIA diamond grading staff deter-
mined color and clarity grades on all faceted sam-
ples using the standard conditions and methodology
of GIA’s clarity and color grading systems (see, e.g.,
King et al., 1994). We examined the internal fea-
tures of all the samples using both a standard gemo-
logical binocular microscope and a research micro-
scope with a variety of lighting techniques.
Reactions to ultraviolet radiation (again, see table 1)
were checked in a darkened room with a conven-
tional four-watt combination long-wave (365 nm)
and short-wave (254 nm) UV lamp. We also exam-
ined all samples for their fluorescence and phospho-
rescence properties, as well as growth characteris-
tics, using the Diamond Trading Company (DTC)
DiamondView deep-ultraviolet (<230 nm) lumines-
cence imaging system (Welbourn et al., 1996).
Spectroscopic Analysis. All samples were tested by
all of the following methods. To avoid surface con-
tamination in the spectroscopic analysis, we
cleaned the samples thoroughly in acetone using an
ultrasonic bath. Infrared absorption spectra were
recorded in the mid-infrared (6000–400 cm–1
, 1 cm–1
resolution) and near-infrared (up to 11000 cm–1
, 4
cm–1
resolution) ranges at room temperature with a
Thermo-Nicolet Nexus 670 Fourier-transform
infrared (FTIR) spectrometer equipped with KBr and
quartz beam splitters. We used a diffuse reflectance
apparatus to focus the incident beam on the sample,
and collected a total of 512 scans (per spectrum) to
improve the signal-to-noise ratio. Spectra in the
mid-infrared and near-infrared regions were normal-
ized based on the two-phonon and three-phonon
absorptions of diamond, respectively. Absorption
spectra in the ultraviolet to visible to near-infrared
(UV-Vis-NIR) range (250–850 nm) were recorded
with a Thermo-Spectronic Unicam UV500 spec-
trophotometer that used a sampling interval of 0.1
nm for all samples. The synthetic diamonds were
mounted in a cryogenic cell and cooled to liquid
nitrogen temperature (~77 K).
Raman and photoluminescence (PL) spectra were
recorded using a Renishaw InVia Raman confocal
microspectrometer with an Ar-ion laser operating at
two excitation wavelengths: 488 nm (for the
490–950 nm range) and 514.5 nm (for the 517–950
nm range). We collected PL spectra in the 640–850
nm range using a He-Ne laser (633 nm), and in the
835–1000 nm range using a NIR laser (830 nm). For
PL analysis, all samples were cooled by direct
immersion in liquid nitrogen. Three scans were
accumulated to achieve a better signal-to-noise ratio.
GEMOLOGICAL OBSERVATIONS
Shapes. Most of the 31 faceted samples were round
brilliants (two were princess cuts and one was a
rectangular cut); they ranged in size from 0.14 to
0.71 ct. All the faceted gems exhibited standard cut
dimensions. Based on the GIA cut grading system
for round brilliant diamonds (Moses et al., 2004),
most (14 of 18) of the colorless/near-colorless round
brilliants were graded as excellent or very good.
Both ends of the 10 near-colorless cylinders were
polished for quantitative spectroscopic analysis and
better examination of internal features. These cylin-
ders varied in diameter from 2.40 to 3.75 mm and in
thickness from 1.51 to 2.56 mm. All displayed dis-
tinctive groove patterns on their edges, indicating
that each was laser cut from a larger crystal; similar
grooves were seen on the girdles of many of the
faceted samples (figure 2). The two partially pol-
ished plates (1.05 and 1.20 ct) exhibited a tabular
morphology (figure 3), which is characteristic of as-
grown CVD synthetic diamonds.
Color. An outstanding feature of the 43 CVD-grown
diamonds were the colors represented (again, see
table 1). Twenty-nine samples were colorless, near
colorless (figure 4), or only very slightly colored, and
these are collectively referred to as the “near-color-
less” group in this article. Of the 19 samples in this
group given color grades (table 1; the cylinders were
not color graded), four were colorless (E to F), 12
were near colorless (G to J), and three displayed very
slight coloration (K to M). All the faceted Apollo
samples in this group, except for the colorless ones,
had a slightly brown component with no yellow
apparent. Of the 14 fancy-color CVD products, 11
had significant orange or pink (or both) components
with moderate-to-strong saturation (e.g., figure 5,
a–c), and the other three samples were dark brown
(e.g., figure 5d). Although the hue descriptions are
similar between some of the samples in the
“orange-to-pink” group and the three in the “dark
brown” group (again, see table 1), these latter three
specimens showed distinctly darker tone than the
other 11 fancy-color samples and the predominant
hue in all three was brown. Two samples in the
“orange-to-pink” group were graded Fancy Dark,
but both displayed a distinct orange-to-pink hue.
Throughout this article, gemological and spectro-
scopic features will be presented and discussed in
terms of these three color groups.
Clarity. GIA lab staff also determined clarity grades
for the 31 faceted CVD-grown diamonds. Nine were
given VVS grades (29%), 12 were VS (39%), and nine
were SI (29%). One sample fell into the I (“includ-
ed”) category. Cavities, fractures, small inclusions,
and pinpoints (figure 6) were the most common
clarity grade–setting internal features. The fractures
and cavities varied from micrometer to millimeter
scale, and most were surface reaching. Unlike what
is typically seen in natural diamonds, the fractures
in the CVD samples were usually not connected to
inclusions. In general, the small inclusions and pin-
points were randomly distributed. In rare cases,
numerous pinpoints and small inclusions occurred
together in cloud-like groups (figure 6c). Internal fea-
tures were typically light in color with only a few
small dark inclusions observed.
Reactions to UV Radiation. Observation of the sam-
ples while they were exposed to conventional short-
and long-wave UV lamps revealed a close correla-
tion between fluorescence and bodycolor (table 1).
For the near-colorless group, only eight of the 29
samples showed very weak orange fluorescence to
short- and/or long-wave UV radiation; the remain-
ing samples were inert to both wavelengths. In con-
trast, all the samples in the orange-to-pink group
showed orange fluorescence of very weak to moder-
ate intensity to long-wave UV, with obvious turbid-
ity (“chalkiness”) in eight of the 11 samples. When
exposed to short-wave UV, all of these CVD sam-
ples displayed very weak to weak orange to orangy
yellow fluorescence. No UV fluorescence was
observed in the three diamonds in the dark brown
group. None of the samples in the present study
showed phosphorescence to conventional long- or
short-wave UV radiation.
When exposed to the high-intensity ultra-short
wavelengths of the DTC DiamondView, most of
the near-colorless group of synthetic diamonds dis-
played strong pinkish orange fluorescence (figure 7a
and 7c), and a few fluoresced strong orange or
298 NEW CVD-GROWN SYNTHETIC DIAMONDS FROM APOLLO GEMS & GEMOLOGY WINTER 2007
Figure 2. Most of the partially
polished CVD-grown crystals
examined were cylindrical
with distinctive laser grooves
along the outer rims. The
diameter of this cylinder (left,
sample AP-21) is 3.46 mm.
The laser grooves were still
visible on the girdles of many
of the faceted round brilliants
(right, sample AP-10, field of
view 1.0 mm). Photomicro-
graphs by W. Wang.
Figure 3. These two par-
tially polished CVD
crystals (1.05 and 1.20
ct) had a tabular mor-
phology that is charac-
teristic of CVD synthet-
ic diamonds. Photos by
Jian Xin (Jae) Liao.
orangy red (figure 7b). An interesting feature was
the occurrence of regions with irregularly patterned
strong blue fluorescence. The size of these regions
varied significantly between samples. In some of the
samples, the blue fluorescence was concentrated
near the culet (figure 7c), and in others it was on the
table facet. In the latter case, a violetish blue fluo-
rescence was typically observed as well (figure 7d).
All samples were also checked for phosphorescence
in the DiamondView (all under the same condi-
tions). Weak-to-moderate blue phosphorescence
was seen in 15 of the 29 samples in the near-color-
NEW CVD-GROWN SYNTHETIC DIAMONDS FROM APOLLO GEMS & GEMOLOGY WINTER 2007 299
Figure 5. Some of the
CVD samples showed
attractive fancy colors:
(a) 0.71 ct, Fancy Dark
brownish pinkish
orange; (b) 0.34 ct,
Fancy brown-pink; (c)
0.28 ct, Fancy Dark
pink-brown; (d) 0.33 ct,
Fancy Dark yellowish
brown. Photos by Jian
Xin (Jae) Liao.
Figure 4. These faceted CVD samples from Apollo Diamond (0.15–0.30 ct) range from E to H on the GIA color
grading scale. Photos by Jian Xin (Jae) Liao.
a b
c d
300 NEW CVD-GROWN SYNTHETIC DIAMONDS FROM APOLLO GEMS & GEMOLOGY WINTER 2007
less group (figure 8). Within this group, we did not
observe any systematic changes in fluorescence/
phosphorescence in the DiamondView as the color
grade increased from E to M. In general, the phos-
phorescence colors appeared evenly distributed
throughout the CVD-grown diamonds, with no vari-
ations visible even in samples showing the distinct
zonations of blue and orange-to-pink fluorescence.
The orange-to-pink CVD synthetic diamonds
showed stronger reddish orange fluorescence in the
DiamondView (figure 9a-d) than was seen in the
near-colorless samples; none showed the irregularly
patterned blue fluorescence. In general, the fluores-
cence in the orange-to-pink samples was evenly dis-
tributed, with only three of the 11 samples showing
bands of weaker orange color. These bands were
uniform in thickness, oriented parallel to the table
facet, and had sharp, well-defined boundaries (figure
Figure 7. In the DTC
DiamondView, most of
the near-colorless group
of CVD synthetic dia-
monds displayed strong
pinkish orange fluores-
cence (a and c), and
some fluoresced strong
orange or orangy red (b).
Several had very irregu-
lar regions with strong
blue (c) or violetish blue
(d) fluorescence. Photos
by W. Wang.
Figure 6. Most of the faceted CVD synthetic diamonds studied had high clarity grades, in the VVS and VS
ranges. The internal features that most affected the clarity grades were: (a) surface-reaching fractures (field of
view 2.5 mm); (b) surface-reaching cavities (field of view 1.4 mm); and (c) pinpoints and clouds (field of view 0.9
mm). Photomicrographs by W. Wang and K. S. Moe.
a b
a b
c d
c
NEW CVD-GROWN SYNTHETIC DIAMONDS FROM APOLLO GEMS & GEMOLOGY WINTER 2007 301
9b). Narrow growth striations were visible in many
of the samples due to variations in fluorescence
intensity, and evenly distributed weak green fluo-
rescence (figure 9c) was also observed in five of the
11 orange-to-pink samples. Of all the fancy-color
CVD synthetic diamonds studied, only one of the
orange-to-pink samples (AP-34) showed weak blue
plus some small areas of green phosphorescence (fig-
ure 10) in the DiamondView.
The three dark brown CVD synthetic diamonds
showed orangy red fluorescence in the Diamond-
View, but with much weaker intensity than that of
the other two groups. The irregularly patterned blue
fluorescence observed in the near-colorless group
also occurred in the brown samples, but was very
limited in distribution.
Graining and Birefringence. Graining was a com-
mon feature in all the CVD synthetic diamonds
studied. In contrast to that observed in natural dia-
Figure 9. The fancy-color
CVD synthetic dia-
monds with distinct
orange-to-pink colors
showed a more intense
reddish orange fluores-
cence (a–d) than the
near-colorless group
when examined with
the DiamondView.
Three of the 11 samples
in this group showed
bands of weaker orange
fluorescence (b), possi-
bly due to variations in
crystal growth condi-
tions. Five also dis-
played distinct green flu-
orescence (c). Photos by
W. Wang and K. S. Moe.
Figure 8. The Diamond-
View revealed blue phos-
phorescence of weak
(left) to moderate (right)
intensity in about half of
the CVD-grown dia-
monds in the near-color-
less group. All the phos-
phorescence images were
collected under the same
conditions. Photos by W.
Wang and K. S. Moe.
a b
c d
302 NEW CVD-GROWN SYNTHETIC DIAMONDS FROM APOLLO GEMS & GEMOLOGY WINTER 2007
monds, the internal graining in most of the CVD
samples showed indistinct boundaries that appeared
fuzzy. Only three samples showed graining with rel-
atively well-defined edges (see, e.g., figure 11).
Strong birefringence was another important fea-
ture of these CVD samples. Under magnification
with crossed polarizers, all the samples displayed
very high-order interference colors (figure 12). The
CVD products commonly showed red, blue, green,
and even white interference colors that were in sharp
contrast to the gray colors that are typical of natural
type IIa diamonds. While bands of interference colors
occurred in a few samples, most displayed irregular
patterns. No correlation was observed between body-
color and interference color or pattern; comparable
interference features occurred in both the near-color-
less and fancy-color CVD groups.
RESULTS OF SPECTROSCOPIC ANALYSIS
Infrared Absorption Spectroscopy. Several distinct
features in the IR spectra correlated directly with
the bodycolors of the CVD synthetic diamonds. In
the mid-infrared region, samples in the near-color-
less group showed no detectable absorptions relat-
ed to nitrogen or boron impurities, indicating they
Figure 10. Only one (AP-34) of the 14 fancy-color
CVD-grown diamonds phosphoresced in the
DiamondView, showing weak blue with minor
amounts of green luminescence. Photo by W. Wang.
Figure 11. Internal graining was well developed but
“fuzzy” in most of the CVD synthetic diamonds
studied. Graining with clearly observable outlines,
as seen here in sample AP-18, was rare. Photomicro-
graph by W. Wang; field of view 2.4 mm.
Figure 12. When examined with crossed polarizers, type IIa CVD synthetic diamonds usually show much
higher-order interference colors than natural type IIa diamonds, as illustrated by the samples shown here:
(a) type IIa faceted CVD-grown diamond; (b) type IIa cylindrical CVD-grown crystal; and (c) interference
pattern of a typical natural type IIa diamond. Photomicrographs (fields of view 1.8, 3.8, and 1.4 mm, respec-
tively) by W. Wang and K. S. Moe.
a b c
NEW CVD-GROWN SYNTHETIC DIAMONDS FROM APOLLO GEMS & GEMOLOGY WINTER 2007 303
were all type IIa, and exhibited only a weak peak
at 1332.1 cm–1
(figure 13). All the fancy-color sam-
ples showed stronger absorption at 1332.1 cm–1
.
Additionally, all were classified as type IIa; howev-
er, they showed a weak absorption at 1344.5 cm–1
(~0.1 cm–1
in intensity) that was due to the pres-
ence of ~5 ppm of isolated nitrogen. In addition,
weak but distinct absorptions at 1371.0, 1362.3,
and 1352.9 cm–1
were consistently recorded in the
fancy-color CVD-grown diamonds, but did not
occur in the near-colorless group.
Differences between the near-colorless and fancy-
color samples were also noted in the region of
3200–2700 cm–1
(figure 14). In this range, CVD sam-
ples in the near-colorless group showed only the
gradual increase in absorption that is intrinsic to dia-
mond. In contrast, all the fancy-color samples exhib-
ited a sharp absorption at 3123.0 cm–1
with signifi-
cant intensity caused by a hydrogen-related lattice
defect (Fuchs et al., 1995a,b). Many other weak and
broad features also occurred in this region, including
peaks at 2901.7, 2807.5, and 2727.8 cm–1
.
The integrated intensities of the absorptions (i.e.,
the areas under the peaks) at 1371.0 and 1352.9
cm–1
, as represented in figure 13, displayed positive
linear correlations with each other (figure 15, left; a
similar correlation for the 1362.3 peak is not shown)
and with the H-related peak at 3123.0 cm–1
(figure
15, right), but no correlation was observed with the
concentration of isolated nitrogen (i.e., the 1344.5
cm–1
peak).
We also observed significant variations in the
near-infrared range (figure 16). For the near-colorless
CVD group, the samples ranging in color from F to J
showed only two very weak absorptions at 6855 and
5562 cm–1, whereas the E-color sample (AP-01) had
no detectable absorptions in the entire NIR region.
The K-to-M CVD synthetic diamonds generally
showed two additional weak absorptions at 7353 and
6425 cm–1. While all of these absorptions were <1.0
cm–2 in integrated intensity, NIR features in the K-to-
M samples appeared slightly stronger than those in
samples from the rest of the near-colorless group.
The orange-to-pink CVD samples exhibited
much stronger absorptions at 7353 (average integrat-
ed intensity 2.12 cm–2) and 6425 cm–1. However,
they did not show the peaks at 6855 and 5562 cm–1;
instead, many sharp peaks occurred in the range
9000–4200 cm–1, including the strong absorptions at
7917 and 7804 cm–1 reported by Twitchen et al.
(2007) as the 1263 and 1281 nm lines. This group of
samples showed other major NIR peaks at 7533,
6963, 6828, 6425, 6064, 5219, 4888, 4672, and 4337
cm–1 (again, see figure 16, left). All the lines were
sharp and relatively strong in intensity.
The three dark brown CVD synthetic diamonds
showed absorption features that were very similar to
those of the K-to-M colors, with two additional
sharp and strong peaks at 8752 and 7837 cm–1, and
two sharp peaks at 7225 and 7189 cm–1 (figure 16,
right). In these three dark brown diamonds, all the
peaks were very strong and linearly correlated with
Figure 13. CVD synthetic diamonds from the near-
colorless group (e.g., AP-12) showed only a weak
absorption at 1332.1 cm–1. In the fancy-color CVD
diamonds (e.g., AP-33, AP-35), more intense peaks
were observed. Spectra shifted vertically for clarity.
Figure 14. In the near-colorless group of CVD synthetic
diamonds (e.g., AP-12), no absorption at 3123.0 cm–1
was recorded. In contrast, that H-related absorption is
very strong in the fancy-color CVD diamonds (e.g., AP-
33, AP-35). Spectra shifted vertically for clarity.
304 NEW CVD-GROWN SYNTHETIC DIAMONDS FROM APOLLO GEMS & GEMOLOGY WINTER 2007
one another in integrated intensity (figure 17). For
example, the average integrated intensity of the 7353
cm–1 peak in the dark brown samples was 89.2 cm–2.
UV-Vis-NIR Absorption Spectroscopy. The E-to-J
CVD-grown diamonds in the near-colorless group
showed no specific features in the UV-Vis region
except for a very slight increase in absorption from
~500 nm to the high-energy (low-wavelength) side
(e.g., sample AP-22 in figure 18). An extremely weak
and broad band at ~270 nm was recorded in the
slightly brown samples. Sample AP-16, which had
the most brown (“M”) in the near-colorless group,
also had the highest-intensity absorption at ~270 nm
of the near-colorless samples. The broad ~270 nm
band is caused by trace amounts of isolated nitrogen.
Analysis of the samples in the orange-to-pink
group revealed some consistent absorption features,
including broad bands at ~270 nm and ~520 nm, a
gradual increase in absorption from ~450 nm to the
Figure 15. In the fancy-color CVD synthetic diamonds, the integrated intensities displayed positive linear correla-
tions between (left) absorptions at 1352.9 cm–1 and 1371.0 cm–1, and (right) those absorptions (represented here by
the peak at 1352.9 cm–1) and the H-related absorption at 3123.0 cm–1.
Figure 16. Some distinct correlations were observed between absorptions in the near-infrared region and the body-
colors of the CVD samples. Generally, the orange-to-pink samples (e.g., AP-33) showed stronger peaks than those
in the near-colorless group (e.g., AP-04 and AP-13; left). In dark brown CVD diamonds (e.g., AP-51; right), very
strong absorptions were consistently observed. Note the difference in scale between the spectra on the left and
right; also, spectra on the left have been shifted vertically for clarity.
NEW CVD-GROWN SYNTHETIC DIAMONDS FROM APOLLO GEMS & GEMOLOGY WINTER 2007 305
high-energy (low-wavelength) side, and sharp peaks
at 413.5, 419.4, 425.0, 495.3, 503.3, 637.0, 666.7,
685.3, and 712.1 nm (see spectrum of sample AP-31
in figure 18). Among the sharp absorptions, the 637.0
nm peak, the zero phonon line (ZPL) of the nitrogen-
vacancy [N-V]– center, was the strongest. In the
three dark brown samples, absorption increased
gradually from ~600 nm to the high-energy (low-
wavelength) side with a broad band centered at ~520
nm (figure 19). Only two sharp, but weak, absorp-
tions at 624.5 and 637.6 nm were recorded. A broad
shoulder centered at ~370 nm appeared in samples
AP-35 and AP-50; however, the feature is difficult to
discern in sample AP-51 due to very strong absorp-
tion in this region. All these broad features are simi-
lar to those reported in as-grown brown CVD syn-
thetic diamond by, for example, Martineau et al.
(2004, figure 11), Twitchen et al. (2004, 2007), and
Hounsome et al. (2005).
Photoluminescence and Raman Spectroscopy.
Numerous emission lines were recorded with four dif-
ferent lasers, some of which were observed with mul-
tiple excitation wavelengths. The major PL features
are summarized below on the basis of individual laser
excitation in the defect’s most sensitive region.
When blue laser (488 nm) excitation was
employed (figure 20), all the CVD synthetic dia-
monds in the near-colorless group displayed weak
and sharp peaks at 543.3 and 546.1 nm. Weak peaks
at 501.2, 534.0, 534.4, and 540.0 nm also occurred in
over 70% of the samples in this group (not shown);
in general, these weak peaks were either all present
or all absent. A weak emission at 512.2 nm (not
shown) was also observed in about half the samples
tested. An outstanding feature in the near-colorless
group was the occurrence of a weak 3H emission
(ZPL at 503.5 nm) in about 70% of the samples.
Only one sample (AP-14) showed a very weak H3
emission (ZPL at 503.1 nm). All the orange-to-pink
CVD samples showed extremely strong H3 emis-
sions as well as a cluster of weak emissions at
493.7–500.9 nm with major lines at 494.6, 498.1
(not shown), and 546.1 nm. Moderate H3 emissions
Figure 17. Six absorption peaks in the near-infrared
region of the dark brown CVD synthetic diamonds
displayed positive linear correlations.
Figure 18. In the UV-Vis region, absorption spectra
from CVD samples of the near-colorless group (e.g.,
AP-22) are generally flat. Broad bands at ~270 nm
and ~520 nm and some sharp peaks including a ZPL
at 637.0 nm were consistently recorded in CVD sam-
ples with orange-to-pink coloration (e.g., AP-31).
Figure 19. This absorption spectrum is typical of the
dark brown CVD synthetic diamonds.
306 NEW CVD-GROWN SYNTHETIC DIAMONDS FROM APOLLO GEMS & GEMOLOGY WINTER 2007
were also recorded in all three dark brown CVD
samples, together with a 512.2 nm peak (not
shown). Additional weak emissions at 540.0 (not
shown), 543.3, and 546.1 nm were present in some
of the samples of this group.
Green laser (514.5 nm) excitation revealed strong
emission systems of N-V centers in the CVD sam-
ples of all colors (575 and 637.0 nm [not shown]; fig-
ure 21). Doublet emissions at 596.5 and 597.0 nm
occurred in all samples of the near-colorless group.
The same doublet appeared in all three dark brown
samples, but with an additional weak peak at 595.3
nm. In contrast, these features were absent in the
orange-to-pink CVD synthetic diamonds. In addition,
all three dark brown samples exhibited weak peaks,
as shown in the inset to figure 21, at 555.0, 557.1, and
559.1 nm, with the strongest intensity at 559.1 nm.
These correspond to Raman shifts at 1418, 1486, and
1550 cm–1
, respectively. The last of these is due to
the presence of non-diamond carbon (Zaitsev, 2001).
The Raman shifts of these three peaks were con-
firmed based on the same energy shift (i.e., these fea-
tures appeared at different wavelengths, but with the
same Raman shift, when excited by the two different
lasers) using 488 nm laser excitation but with weaker
intensity than those obtained from 514.5 nm laser
excitation.
When excited by a red laser (633 nm), all the
samples in the near-colorless group showed weak
silicon-related emission (figure 22), which is usually
composed of two very sharp peaks at 736.6 and
736.9 nm (generally referred to as the 737 nm
defect; Vavilov et al., 1980; Clark et al., 1995;
Iakoubovskii et al., 2001). We should point out that
this emission also was present in 75% of the sam-
ples of this group when 488 or 514.5 nm laser exci-
tation was used. In addition, weak emissions at
664.0, 665.8, and 833.8 nm (not shown) were record-
ed with the red laser in about half the samples in
the near-colorless group. In all the orange-to-pink
samples, a weak emission occurred at 823.4 nm.
However, the Si-related 737 nm emission was
observed in eight of the 11 samples. While most Si-
related emissions were very weak in this group, two
samples (AP-38 [figure 22] and AP-39) displayed
extremely strong peaks. None of the orange-to-pink
samples showed Si-related emission peaks when
488 or 514.5 nm laser excitation was used. Of the
three dark brown CVD synthetic diamonds, only
one (AP-50) showed a very weak emission at the Si-
related 737 nm defect (again, see figure 22). No
emission at 737 nm was observed in the other two
dark brown samples with any laser excitation.
Infrared laser excitation at 830 nm produced
many weak and sharp emission features in the
Figure 20. When blue laser (488 nm) excitation was
used, the PL spectra showed H3 emission in the orange-
to-pink (e.g., AP-41) and dark brown (e.g., AP-35) CVD
samples. A weak 3H emission occurred in most of the
CVD samples in the near-colorless group (e.g., AP-05).
Other peaks, such as at 543.3 and 546.1 nm, were also
observed among the various color groups.
Figure 21. The PL spectra of all CVD synthetic dia-
monds examined in this study were dominated by
N-V center emission systems at 575 nm (the 637 nm
peak is not shown) when green laser (514.5 nm) exci-
tation was employed. In addition, Raman scattering
peaks at 1418, 1486, and 1550 cm–1 (555.0, 557.1,
and 559.1 nm) were observed in all three dark brown
CVD synthetic diamonds (inset) but not in any sam-
ple of other colors.
NEW CVD-GROWN SYNTHETIC DIAMONDS FROM APOLLO GEMS & GEMOLOGY WINTER 2007 307
850–880 nm region for the near-colorless group of
CVD-grown diamonds, including peaks at 851.1,
855.5, 864.0, 866.0, 867.4, 869.0, and 878.6 nm (fig-
ure 23). We also observed weak peaks at 946.1 and
951.3 nm in all samples of this group. In the orange-
to-pink CVD-grown diamonds, we recorded even
more weak emissions, including those at 847.2,
850.1, 864.8, 867.7, 869.4, 881.2, 924.7, 943.0, 945.9,
954.4, and 956.1 nm. The dark brown CVD samples
exhibited fewer emissions, among them weak peaks
at 855.2, 861.5, 878.3, 887.2, 888.0, 940.1, 947.4, and
951.3 nm.
DISCUSSION
Improvements in Gem Quality. As previously
reported (Wang et al., 2003), gem-quality synthetic
diamonds grown by Apollo Diamond Inc. represent-
ed some of the first examples of single-crystal mate-
rial grown by the CVD process that were intended
for the jewelry trade. Most of the samples produced
at the time that article was published showed limit-
ed thickness due to the tabular morphology of the
CVD crystal. For the most part, the few faceted syn-
thetic diamonds studied were a very strong brown,
relatively small (<0.30 ct), and received moderate-
to-low clarity grades (VS1–SI2). In comparison, the
2006–2007 Apollo Diamond products showed sub-
stantial improvements in color, with colorless,
near-colorless, and fancy orange-to-pink material
representative of the gem-quality CVD-grown dia-
monds that are now commercially available.
In addition to the previously documented near-
colorless and brown CVD material, Martineau et al.
(2004) reported on high-quality single-crystal CVD
synthetic diamond with blue color produced by
boron doping during crystal growth and on a 0.85 ct
round-cut as-grown fancy brownish pink CVD syn-
thetic diamond (see sample N8 in table 3 of that ref-
erence). Until the present article, little was known
about the gemological and spectroscopic features of
orange-to-pink CVD synthetic diamonds produced
by Apollo Diamond. These very attractive colors, as
shown in figures 1 and 5, are comparable to some
top-quality fancy-color natural diamonds.
Improvements in clarity were also observed. The
clarity grades of over 67% of the samples provided
from Apollo’s recent production fell in the range
VVS1–VS2. Only a few were in the SI–I range.
Improved clarity was mainly achieved by reducing
the amount of larger inclusions and pinpoints. While
most of the samples examined for this study con-
tained some pinpoints, very few contained other
inclusions that could be resolved even under magni-
fication up to 100×. However, several fractures were
observed, particularly in the samples fashioned as
cylinders. Significant internal stress was indicated
by strong birefringence in many specimens (figure
12). As with natural diamonds, internal stress in
these CVD synthetic diamonds—or the stress of the
cutting process—is likely to contribute to cracking.
Improvements in the CVD growth process have led
to larger faceted gems. Even though most of the
faceted gems in the current study were still under
Figure 23. Many weak emission lines were detected
in the infrared region of the PL spectra when 830 nm
laser excitation was used. Clear differences were
observed among the near-colorless, orange-to-pink,
and dark brown CVD samples.
Figure 22. Si-related emission peaks at 736.6 and
736.9 nm were recorded with varying intensities in
the PL spectra of most CVD synthetic diamonds.
These features were best seen when red laser excita-
tion at 633 nm was used.
308 NEW CVD-GROWN SYNTHETIC DIAMONDS FROM APOLLO GEMS & GEMOLOGY WINTER 2007
0.30 ct, the fact that many samples over half a carat
were available and that those cut as round brilliants
were well proportioned (table 1) indicates that thick-
er crystals are used to create the latest-generation
Apollo products. In brief, the overall color and clarity
of the CVD synthetic diamonds examined in this
study is similar to that of the Element Six CVD
products reported by Martineau et al. (2004).
It should be noted, though, that the CVD syn-
thetic diamonds examined by Martineau et al. are
not commercially available. Apollo products similar
in quality to those described in this report have
been introduced to the gem trade. All of these CVD-
grown products carry a distinctive inscription that
identifies them as Apollo Diamonds.
Causes of Improved Clarity and Color. Production
of top-quality CVD synthetic diamonds using a rela-
tively high growth rate continues to be a challenge,
leading to extensive testing of various combinations
of growth parameters. Achard et al. (2005) reported
that incorporating as little as 10 ppm of nitrogen in
the total gas phase could increase the crystal growth
rate by a factor of 2.5 with no degradation of the sur-
face morphology or color. However, Achard et al.’s
samples were not of gem thickness, so the color
could not be graded using accepted gemological
techniques.
According to Martineau et al. (2004), based on
growth conditions and additional treatment after
growth, CVD synthetic diamonds may be divided
into four groups, including high purity and nitrogen
doped. The nitrogen-doped product contains a
detectable amount of N-bearing lattice defects in
UV-Vis absorption and/or photoluminescence spec-
troscopy, whereas high-purity samples do not. The
occurrence of N-V centers, observed as very strong
emission systems in the PL spectra of all the Apollo
CVD samples tested for the present study (figure 21),
indicated that all the samples contained nitrogen.
Even in the colorless (E and F) CVD samples, emis-
sion from the N-V centers was readily detectable.
However, there is a strong correlation between
increasing color and greater N-V emission (normal-
ized to the Raman peak height). This is further evi-
dence that nitrogen plays a leading role in the deter-
mination of color in the CVD-grown diamonds.
The reasons for nitrogen doping in these CVD
samples were different for each color group. For the
near-colorless group, nitrogen was controlled at rel-
atively low levels to achieve high growth rates
while maintaining crystal quality (Linares and
Doering, 2003). IR absorption spectroscopy did not
detect any nitrogen impurities in samples of this
group. However, the extremely weak, broad band
seen at ~270 nm in the UV-Vis-NIR absorption
spectra of the samples with a slightly brownish hue
is due to isolated nitrogen in concentrations at the
ppm (parts per million) level. Non-diamond carbon,
deposited during CVD diamond growth, is known
to cause brown color in CVD synthetic diamonds;
however, the absence of non-diamond carbon (fig-
ure 21), and the weak correlation between the con-
centration of isolated nitrogen and the color grades,
suggests that the slight brownish hue in near-color-
less samples could be caused by a combination of
the detected defects such as isolated nitrogen and
N-V centers; additionally, non-diamond carbon
could be present, but in concentrations too low to
be detected with Raman spectroscopy.
The impact of nitrogen doping in the fancy-color
CVD synthetic diamonds is more complicated.
Higher concentrations of nitrogen were added into
the gas phase and, as a result, more nitrogen was
incorporated into the diamond lattice during growth.
Relatively high concentrations of isolated nitrogen
were revealed in the IR and UV-Vis-NIR absorption
spectra (figures 13 and 18). Only 5 ppm of isolated
nitrogen is needed to produce yellow-to-orange color
in diamond. Moderately strong absorption from the
[N-V]–
defect (ZPL at 637.0 nm; figure 18) in combi-
nation with the broad ~520 nm band likely resulted
in selective absorption of orange light, and produced
a pink color. Assignment of the ~520 nm broad band
is unclear, but in these samples it functioned very
similarly to the ~550 nm broad absorption band
known to cause the color in many natural pink dia-
monds by selectively absorbing green-to-orange
light. The ~520 nm broad band could have been the
main color contributor for this group of diamonds.
The dark brown diamonds are distinctive due to
the presence of non-diamond carbon (figure 21),
which was not detected in either of the other two
CVD groups studied. The combination of relatively
high concentrations of isolated nitrogen, a weak-to-
moderate absorption band at ~520 nm, and the pres-
ence of non-diamond carbon resulted in a gradual
increase in absorption from the low-energy to high-
energy (high-wavelength to low-wavelength) side of
the UV-Vis-NIR absorption spectra. Consequently,
brown coloration was produced in these samples.
Defect Interrelations and Their Implications.
Absorptions with varying intensities at 3123.0,
NEW CVD-GROWN SYNTHETIC DIAMONDS FROM APOLLO GEMS & GEMOLOGY WINTER 2007 309
1371.0, 1362.3, and 1352.9 cm–1 occurred in the
fancy-color CVD samples (again, see figures 13 and
14). The 3123.0 cm–1 absorption is routinely
observed in nitrogen-doped single-crystal CVD syn-
thetic diamonds (Wang et al., 2003; Martineau et al.,
2004). The absorption was studied via isotopic sub-
stitution with 2D (i.e., deuterium, isotope of hydro-
gen with mass 2 amu) and determined to be a vibra-
tion involving a single hydrogen atom (Fuchs et al.,
1995b). Recent investigation of the 3123.0 cm–1
absorption using a combination of annealing and
uniaxial-stress experiments suggested that the
NVH– defect is responsible (Cruddace et al., 2007a).
The negative nitrogen-vacancy-hydrogen com-
plex, NVH–, was first identified in single-crystal
CVD synthetic diamond using electron paramagnet-
ic resonance (EPR) spectroscopy (Glover et al.,
2003). Hydrogen is a common IR-active impurity in
natural type Ia and occasionally type IIa diamonds,
often showing a sharp absorption at 3107 cm–1
.
Chrenko et al. (1967) first found this absorption, and
Woods and Collins (1983) proposed that it originat-
ed from a C-H stretching vibration mode.
The variation in peak positions of hydrogen-
related absorption is one of the most important
spectroscopic differences between natural and CVD
synthetic diamonds. Positive correlations in intensi-
ty among all these four peaks (figure 15) indicated
that the other three peaks (1371.0, 1362.3, and
1352.9 cm–1
) could also be related to or caused by
the NVH–
defect. Meanwhile, recent studies
(Cruddace et al., 2007a,b) using uniaxial-stress
experiments revealed different symmetries of these
centers. These discrepancies are not fully under-
stood. Based on the relationship Cruddace et al.
(2007a) established, we calculated that the concen-
trations of NVH–
defect varied from 1.3 to 4.3 ppb in
these fancy-color CVD synthetic diamonds.
Many of the peaks in the near-infrared region
(8752, 7353, 6855, 6425, and 5562 cm–1; figure 16)
were reported in Wang et al. (2003). These peaks
were present in the near-colorless and dark brown
samples, but with an additional one at 7837 cm–1.
Interstitial hydrogen and hydrogen trapped at vacan-
cies are potential candidates for the absorption at
7353 cm–1 (Goss, 2003). In the dark brown samples,
these absorptions were extremely strong, which per-
mitted accurate determination of their integrated
intensities and thus allowed us to investigate their
correlations. Similar positive linear correlations also
occurred among six absorption peaks (8752, 7837,
7353, 6855, 6425, and 5562 cm–1
) in the near-infrared
region (figure 17), but none of these peaks showed
any observable correlation with the 3123.0 cm–1
absorption in intensity. All these observations indi-
cate that the six absorption peaks in the near-IR
region of the dark brown samples are very likely
related to or caused by the same defect, but not the
NVH–
defect.
An outstanding feature of the PL spectrum of the
orange-to-pink CVD-grown diamonds is the strong
H3 center (figure 20). The occurrence of H3 is rein-
forced by the green fluorescence (figure 9c). The H3
defect is in the neutral charge state (N-V-N)0
. This
defect forms in nitrogen-bearing diamonds through
combination of the nitrogen A aggregate and a
vacancy. Formation of this defect usually involves
irradiation and annealing at relatively high tempera-
tures (e.g., Collins, 1982, 2001) or is associated with
distinct plastic deformation features. While very
common in irradiated/annealed type Ia diamonds,
varying concentrations of the H3 defect also occur
in some natural-color type Ia diamonds. The H3
defect can be a major contributor to the yellow
color in some natural diamonds (King et al., 2005).
In natural type IIa diamonds, though, the H3 defect
is observed in extremely low concentrations or is
not detectable even when very sensitive PL spec-
troscopy is employed. Strong H3 emissions, as
observed in the PL spectra of the orange-to-pink
CVD samples in this study, are extremely rare in
natural type IIa diamonds, as well as in CVD syn-
thetic diamonds of other colors. The occurrence of
relatively high concentrations of the H3 defect in
this specific group indicates a possible link to the
production of orange-to-pink hues.
The 3H defect that was observed in most dia-
monds in the near-colorless group is widely believed
to be introduced by radiation and has a complicated
annealing behavior. Heating to 300–400°C may
increase the 3H center intensity considerably
depending on the concentration of nitrogen in the
diamond (Zaitsev, 2001). This defect can be stable at
temperature as high as 1000°C (Steeds et al., 1999).
Most CVD diamond growth occurs at ≥800°C and it
is more likely that the 3H center was introduced
during the crystal growth process.
Twitchen et al. (2007) first reported the develop-
ment of 7917 and 7804 cm–1
absorptions in the
near-infrared region (corresponding to the 1263 and
1281 nm peaks in the reference) in CVD synthetic
diamonds when annealed to 1400–1500°C at ambi-
ent pressure. In a recent uniaxial stress and anneal-
ing study, Cruddace et al. (2007c) further found that
310 NEW CVD-GROWN SYNTHETIC DIAMONDS FROM APOLLO GEMS & GEMOLOGY WINTER 2007
the 7354 cm–1 system annealed out in the tempera-
ture range of 1300–1600°C at ambient pressure, and
two lines at 7917 and 7804 cm–1 appeared. These
two peaks, as well as many others, were observed in
all the Apollo fancy orange-to-pink samples with
varying intensities (figure 16).
In addition, features similar to those seen in
prior research were observed in the UV-Vis-NIR
absorption spectra. Weak absorption peaks at 503.3
(due to H3 defects) and 666.7 nm (figure 18) in their
orange-to-pink CVD synthetic diamonds developed
when brown CVD synthetic diamond was annealed
(Twitchen et al., 2007). The absorption feature at
approximately 624 nm disappeared when their sam-
ple was heated in the range of 1200–1400°C
(Twitchen et al., 2007). In the present study, a fea-
ture at 624.5 nm was seen in the spectra of the dark
brown samples (figure 19) but not in those of the
orange-to-pink group. The mechanism for the
occurrence of the spectroscopic features observed
with IR/UV-Vis-NIR absorption and PL spec-
troscopy in the orange-to-pink CVD synthetic dia-
monds studied for the present report is not well
understood, and further investigation is ongoing.
Identification Features. The progress made over the
past few years toward the efficient growth of single-
crystal CVD synthetic diamond has opened a range
of possible industrial and jewelry applications (fig-
ure 24). Several other organizations and institutes
(e.g., Element Six, Carnegie Institute, LIMHP-CNRS
in France, and the National Institute for Material
Sciences in Japan) have demonstrated the capability
to grow single-crystal CVD diamond with products
of varying sizes and quality. In addition, Apollo
Diamond Inc. has begun producing and marketing
CVD-grown gems to the jewelry industry.
Identification and separation of CVD synthetic
diamonds from natural diamonds can be achieved
through careful attention to the gemological and
spectroscopic properties. While not conclusive, sev-
eral gemological observations serve as good indica-
tions of CVD material: strong internal graining with
an indistinct “fuzzy” appearance, high-order inter-
ference colors (figure 12a), occurrence of pinpoints
and occasional clouds (figure 6), and remnant laser
grooves on the girdles (figure 2b). These gemological
features do, however, appear in some natural dia-
monds (Moses et al., 1999). Crystal inclusions are
not commonly present in either CVD or natural
type IIa diamonds, but when they are present, their
appearance can be diagnostic of natural origin.
Early products from Apollo with varying satura-
tions of brown color displayed a weak orange fluo-
rescence to UV radiation that was considered a use-
ful indication of CVD synthesis (Wang et al., 2003;
Martineau et al., 2004). However, this feature is
absent from most of the new products due to
improvements in the growth technique and crystal
quality. Most of the samples in the near-colorless
and dark brown groups were inert, and only a few
near-colorless samples showed very weak orange
fluorescence under the UV lamp. The very weak to
moderate orange fluorescence observed in the
orange-to-pink samples, on the other hand, was
similar to that seen in some natural pink diamonds
(King et al., 2002), which also makes this property
problematic as an identification criterion.
Fluorescence and phosphorescence images
obtained from the DTC DiamondView continue to
be very useful for identification of CVD synthetic
diamonds. Orange fluorescence with irregularly pat-
terned areas of blue fluorescence, narrow growth
bands, and blue phosphorescence (figures 7–9)
appear to be characteristic features of CVD-grown
diamonds, if present. Most natural type IIa dia-
monds show relatively uniform blue fluorescence
and rarely show phosphorescence in the Diamond-
View. Although a few natural type IIa diamonds
show orange fluorescence, the co-existence of
orange and irregular blue fluorescent regions has not
been observed in natural stones. In addition, natural
type IIa diamonds often show characteristic internal
features (e.g., “mosaic” networks of polygonized
dislocations) that likely would not occur in CVD
synthetic diamonds. Natural diamonds with trace
amounts of isolated nitrogen rarely show any pink
hue, or dominant red-orange fluorescence in the
DiamondView.
Spectroscopic features are very important for
CVD identification. For near-colorless samples, the
occurrence of weak absorptions in the near-infrared
region (7353, 6855, 6425, 5562 cm–1
; figure 16)
and/or a very weak absorption band at ~270 nm in
the UV-Vis-NIR region are indicative of CVD
growth. Occurrence of a 3123.0 cm–1
absorption in
the mid-infrared region was considered to be an
important feature of the early CVD synthetic dia-
monds (Wang et al., 2003), but this absorption was
absent in all of the near-colorless group tested.
Important identification features from photolumi-
nescence spectroscopy (figures 20–23) include
strong emissions from N-V centers, the 596/597
doublet, and emissions at 534.0, 543.3, 546.1, 736.6,
736.9, 946.1, and 951.3 nm. These luminescence
features can be activated by lasers of various wave-
lengths. Occurrence of the 3H defect in most of the
near-colorless group of CVD samples (figure 20) is
not well understood, and this feature has also been
reported in CVD synthetic diamonds from another
producer (Wang et al., 2005).
Many of the previously listed emissions
(596/597 doublet, and emissions at 534.0, 543.3,
546.1, 736.6, 736.9, 946.1, and 951.3 nm) are specific
to CVD synthetic diamonds and have not been
detected in natural diamonds (Martineau et al.,
2004; Wang et al., 2005). However, it should be
pointed out that the Si-related 737 nm emission
was recently found in natural type IIa and low-nitro-
gen diamonds (Breeding et al., 2007). Since the Si-
related 737 nm emission is extremely rare in natu-
ral diamonds, its occurrence in photoluminescence
spectroscopy is still a very useful indicator of a CVD
synthetic diamond.
For those CVD synthetic diamonds with orange-
to-pink and dark brown colors, IR absorption spec-
troscopy proved more useful for identification than
photoluminescence. Occurrence of a sharp 3123.0
cm–1
absorption (figure 14) from an H-related defect
and the combination of absorptions at 1371.0,
1362.3, 1352.9, and 1344.5 (due to isolated nitrogen)
are specific to these fancy-color CVD synthetic dia-
monds (figure 13). Very strong absorptions at 8752,
7837, 7353, 6855, 6425, and 5562 cm–1
in dark
brown samples and numerous (7917, 7804, 7533,
7353, 6963, 6828, 6425, 6064, 5219, 4888, 4672, and
4337 cm–1
) sharp absorption peaks in the near-
infrared region of orange-to-pink samples (figure 16)
are characteristic identification features for these
two groups. The ~520 nm broad absorption band in
UV-Vis-NIR spectra (figures 18 and 19) is slightly
lower in position than the 550 nm band in natural
diamonds. The well-known 596/597 photolumines-
cence doublet emissions were entirely absent in the
orange-to-pink CVD synthetic diamonds, and the
Si-related 737 nm emission occurred in few of the
fancy-color CVD-grown diamonds.
The identification of CVD synthetic diamonds
from natural stones may be achieved based on a
combination of various gemological and spectro-
scopic features. There is no single feature that will
ensure proper identification of all CVD synthetic
diamonds, and testing in a properly equipped gemo-
logical laboratory is needed to guarantee confident
identification.
CONCLUSIONS
Compared to earlier-generation products, the CVD
synthetic diamonds submitted by Apollo Diamond
Inc. as representative of their 2006–2007 produc-
tion showed significant improvements in color
and clarity. Relatively larger, well-proportioned,
faceted CVD products have also become more
common. Colorless, near-colorless, and attractive
fancy-color material is now being produced. The
new products are comparable in quality to many
natural diamonds in the marketplace. The gem
sizes (0.14–0.71 ct) reflect the highest-volume seg-
ment of the natural diamond market. These CVD
synthetic diamonds exhibited unusual internal
graining, high birefringence, complex fluorescence
zoning, and several distinct spectroscopic features.
All of these CVD synthetic diamonds can be iden-
tified, but a combination of various gemological
and, especially, spectroscopic features is required
to do so consistently and accurately. We anticipate
that CVD diamond growth techniques will contin-
ue to improve and CVD products with even better
quality will eventually be introduced to the gem
market.
NEW CVD-GROWN SYNTHETIC DIAMONDS FROM APOLLO GEMS & GEMOLOGY WINTER 2007 311
Figure 24. CVD lab-grown diamonds are now avail-
able in fine jewelry, such as these stackable rings set
in yellow and white gold. Courtesy of Apollo
Diamond Inc.
312 NEW CVD-GROWN SYNTHETIC DIAMONDS FROM APOLLO GEMS & GEMOLOGY WINTER 2007
ABOUT THE AUTHORS
Dr. Wang (wuyi.wang@gia.edu) is manager of research projects,
Mr. Hall is manager of identification services, Mr. Moe is
research technician, and Mr. Moses is senior vice president, at
the GIA Laboratory, New York. Mr. Tower is senior scientist at
Apollo Diamond Inc., Boston, Massachusetts.
ACKNOWLEDGMENTS
The authors thank Ivana Balov, Thomas Gelb, Joshua Cohn,
Paul Johnson, Dino DeGhionno, Shane McClure, Dr. James
Shigley, Dr. Andy H. Shen, and Dr. Christopher M. Breeding
of the GIA Laboratory for their many suggestions and assis-
tance in this study. Dr. Robert Linares, Patrick Doering, and
their team at Apollo Diamond are specially thanked for their
continued cooperation with GIA and for their efforts to coop-
erate with the jewelry industry to develop a better under-
standing of CVD diamond growth technology. Constructive
reviews by Dr. John Angus, Dr. James Butler, Dr. Philip
Martineau, and Dr. Christopher Welbourn helped improve this
article substantially.
REFERENCES
Achard J., Tallaire A., Sussmann R., Silva F., Gicquel A. (2005) The control
of growth parameters in the synthesis of high-quality single crystalline
diamond by CVD. Journal of Crystal Growth, Vol. 284, No. 3/4, pp.
396–405.
Badzian A., Badzian T. (1993) Diamond homoepitaxy by chemical vapor
deposition. Diamond and Related Materials, Vol. 2, No. 2/4, pp.
147–157.
Breeding C.M., Wang W. (2007) Occurrence of the Si-V (737 nm) center in a
natural type IIa colorless gem diamond. Abstract of 18th European
Conference on Diamond, Diamond-like Materials, Carbon Nanotubes,
and Nitride. Berlin, Germany, September 9–14 , p. P1.04.04.
Chrenko R.M., McDonald R.S., Darrow K.A. (1967) Infrared spectra of dia-
mond coat. Nature, Vol. 213, No. 5075, pp. 474–476.
Clark C.D., Kanda H., Kiflawi I., Sittas G. (1995) Silicon defects in dia-
mond. Physical Review B, Vol. 51, No. 23, pp. 16681–16688.
Collins A.T. (1982) Colour centers in diamond. Journal of Gemmology,
Vol. 18, No. 1, pp. 35–75.
Collins A.T. (2001) Colour of diamond and how it may be changed.
Journal of Gemmology, Vol. 27, No. 6, pp. 341–359.
Cruddace R.C., Newton M.E., Smith H.E., Davies G., Martineau P.M.,
Twitchen D.J. (2007a) Identification of the 3123 cm−1
absorption line in
SC-CVD diamond as the NVH–
defect. Proceedings of the 58th De
Beers Diamond Conference, Coventry, England, pp. 15.1–15.3.
Cruddace R.C., Newton M.E., Smith H.E., Davies G., Fisher D., Martineau
P.M., Twitchen D.J. (2007b) Uniaxial stress and annealing measure-
ments on C-H bands in diamond. Proceedings of the 58th De Beers
Diamond Conference, Coventry, England, pp. P19.1–P19.3.
Cruddace R.C., Newton M.E., Davies G., Martineau P.M., Twitchen D.J.
(2007c) Uniaxial stress and annealing studies of the NIR 913 meV sys-
tem in SC-CVD diamond. Proceedings of the 58th De Beers Diamond
Conference, Coventry, England, pp. P20.1–P20.2.
Doering P.J., Linares R.C. (1999) Large area single crystal CVD diamond:
Properties and applications. Proceedings of Applied Diamond
Conference / Frontier Carbon Technology Joint Conference 1999,
Tsukuba, Japan, pp. 32–35.
Fuchs F., Wild C., Schwarz K., Muller-Sebert W., Koidl P. (1995a)
Hydrogen induced vibrational and electronic transitions in chemical
vapor deposited diamond, identified by isotopic substitution. Applied
Physics Letters, Vol. 66, No. 2, pp. 177–179.
Fuchs F., Wild C., Schwarz K., Koidl P. (1995b) Hydrogen-related IR absorp-
tion in chemical vapour deposited diamond. Diamond and Related
Materials, Vol. 4, No. 5/6, pp. 652–656.
Goss J.P. (2003) Theory of hydrogen in diamond. Journal of Physics:
Condensed Matter, Vol. 15, No. 17, pp. R551–R580.
Glover C., Newton M.E., Martineau P.M., Twitchen D.J., Baker L.M.
(2003) Hydrogen incorporation in diamond: The nitrogen-vacancy-
hydrogen complex. Physical Review Letters, Vol. 90, No. 18, pp.
185507–185510.
Goodwin D.G., Butler J.E. (1997) Theory of diamond chemical vapor deposi-
tion. In M.A. Prelas, G. Popovici, and L.K. Bigelow, Eds., Handbook of
Industrial Diamonds and Diamond Films, Marcel Dekker, New York,
pp. 527–581.
Hounsome L.S., Jones R., Martineau P.M., Shaw M.J., Briddon P.R., Öberg
S., Blumenau A.T., Fujita N. (2005) Optical properties of vacancy relat-
ed defects in diamond. Physica Status Solidi (a), Vol. 202, No. 11, pp.
2182–2187.
Iakoubovskii K., Adriaenssens G.J., Dogadkin N.N., Shiryaev A.A. (2001)
Optical characterization of some irradiation-induced centers in dia-
mond. Diamond and Related Materials, Vol. 10, No. 1, pp. 18–26.
King J.M., Moses T.M., Shigley J.E., Liu Y. (1994) Color grading of colored
diamonds at the GIA Gem Trade Laboratory. Gems & Gemology, Vol.
30, No. 4, pp. 220–242.
King J.M., Shigley J.E., Guhin S.S., Gelb T.H., Hall M. (2002)
Characterization and grading of natural-color pink diamonds. Gems &
Gemology, Vol. 38, No. 2, pp. 128–147.
King J.M., Shigley J.E., Gelb T.H., Guhin S.S., Hall M., Wang W. (2005)
Characterization and grading of natural-color yellow diamonds. Gems
& Gemology, Vol. 41, No. 2, pp. 88–115.
Linares R.C., Doering P.J. (1999) Properties of large single crystal diamond.
Diamond and Related Materials, Vol. 8, No. 2/5, pp. 909–915.
Linares R.C., Doering P.J. (2003) System and method for producing syn-
thetic diamond. US Patent 6,582,513.
Martineau P.M., Lawson S.C., Taylor A.J., Quinn S.J., Evans D.J.F., Crowder
M.J. (2004) Identification of synthetic diamond grown using chemical
vapor deposition (CVD). Gems & Gemology, Vol. 40, No. 1, pp. 2–25.
Miyatake H., Arima K., Maida O., Teraji T., Ito Y. (2007) Further improve-
ment in high crystalline quality of homoepitaxial CVD diamond.
Diamond and Related Materials, Vol. 16, No. 4/7, pp. 679–684.
Moses T.M., Shigley J.E., McClure S.F., Koivula J.I., Van Daele M. (1999)
Observations on GE-processed diamonds: A photographic record.
Gems & Gemology, Vol. 35, No. 3, pp. 14–22.
Moses T.M., Johnson M.L., Green B., Blodgett T., Cino K., Geurts R.H.,
Gilbertson A.M., Hemphill T.S., King J.M., Komylak L., Reinitz I.M.,
Shigley J.E. (2004) A foundation for grading the overall cut quality of
round brilliant cut diamonds. Gems & Gemology, Vol. 40, No. 3, pp.
202–228.
Steeds J.W., Davis T.J., Charles S.J., Hayes J.M., Butler J.E. (1999) 3H lumi-
nescence in electron-radiated diamond samples and its relationship to
self-interstitials. Diamond and Related Materials, Vol. 8, No. 10, pp.
1847–1852.
Tallaire A., Achard J., Sussmann R.S., Silva F., Gicquel A. (2005)
Homoepitaxial deposition of high-quality thick diamond films: Effect
of growth parameters. Diamond and Related Materials, Vol. 14, No.
3/7, pp. 249–254.
Twitchen D.J., Martineau P.M., Scarsbrook G.A., Dorn S.C., Cooper M.A.
(2004) Coloured diamond. Patent publication number US2004194690.
Twitchen D.J., Martineau P.M., Scarsbrook G.A. (2007) Coloured dia-
mond. Patent publication number US2007079752.
Vavilov V.S., Gippius A.A., Zaitsev A.M., Deryagin B.V., Spitsyn B.V.,
Aleksenko A.E. (1980) Investigation of the cathodoluminescence of
epitaxial diamond films. Soviet Physics-Semiconductors, Vol. 14, pp.
1078–1079.
Wang W., Moses T., Linares R., Shigley J.E., Hall M., Butler J.E. (2003)
Gem-quality synthetic diamonds grown by the chemical vapor deposi-
tion method. Gems & Gemology, Vol. 39, No. 4, pp. 268–283.
Wang W., Tallarie A., Hall M.S., Moses T.M., Achard J., Sussmann R.S.,
Gicquel A. (2005) Experimental CVD synthetic diamonds from LIMHP-
CNRS, France. Gems & Gemology, Vol. 41, No. 3, pp. 234–244.
Welbourn C.M., Cooper M., Spear P.M. (1996) De Beers natural versus
synthetic diamond verification instruments. Gems & Gemology, Vol.
32, No. 3, pp. 156–169.
Woods G.S., Collins A.T. (1983) Infrared absorption spectra of hydrogen
complexes in type I diamonds. Journal of Physics and Chemistry of
Solids, Vol. 44, No. 5, pp. 471–475.
Yan C.-S., Mao H.-K., Li W., Qian J., Zhao Y.S., Hemley R.J. (2004) Ultrahard
diamond single crystals from chemical vapor deposition. Physica Status
Solidi, Rapid Research Note, Vol. 201, No. 4, pp. R25–R27.
Zaitsev A.M. (2001) Optical Properties of Diamond. Springer-Verlag,
Berlin, 502 pp.
near the border with Malawi. However, there are no
gem-bearing pegmatites in the Chipata area, and the
actual locality is the Lundazi District, located ~160
km to the north (as indicated by Rossman and
Mattson, 1986). Since the location was kept secret
for many years, some more recent reports have
named the source locality as Mozambique (Wong,
2001) or Malawi (e.g., Boehm, 2001; Federman,
2002). The enriched manganese content of this
Zambian elbaite has led some authors to refer to it
as tsilaisite (Schmetzer and Bank, 1983, 1984b;
Kane, 1986).a
While in Zambia in August 2004, three of the
authors (BML, WBS, and BA) visited the most
important deposit for yellow elbaite, known as the
Canary mining area, to gather information on the
geology and production of this unusual material,
and to obtain samples for gemological characteriza-
tion and chemical analysis. Two days were spent at
YELLOW MN-RICH TOURMALINE FROM
THE CANARY MINING AREA, ZAMBIA
Brendan M. Laurs, William B. (Skip) Simmons, George R. Rossman, Eric A. Fritz,
John I. Koivula, Björn Anckar, and Alexander U. Falster
See end of article for About the Authors and Acknowledgments.
GEMS & GEMOLOGY, Vol. 43, No. 4, pp. 314–331.
© 2007 Gemological Institute of America
The most important source of yellow gem elbaite is the Canary mining area in the Lundazi
District of eastern Zambia. The tourmaline has been mined since 1983 from both pegmatite and
eluvial/alluvial deposits, in colors typically ranging from yellow-green to yellow to orange and
brown; much of the orange-to-brown material is heated to attain a “golden” or “canary” yellow
color. The tourmaline is Mn-rich (up to 9.18 wt.% MnO documented in the literature) and con-
tains traces of Ti and little or no Fe. The distinctive composition of this tourmaline is probably the
result of the crystallization of abundant schorl from an unusual B-rich, Li-poor pegmatite magma,
which depleted Fe while conserving Mn until the late-stage crystallization of gem pockets.
314 YELLOW TOURMALINE FROM ZAMBIA GEMS & GEMOLOGY WINTER 2007
ince the early 1980s, gem-quality yellow
elbaite has been intermittently mined from a
small area in eastern Zambia. Marketed as
Canary tourmaline since 2001, this material is
notable for its vivid yellow color and high Mn con-
tent—among the highest ever recorded in any tour-
maline (e.g., Shigley et al., 1986). Starting in 2002,
organized purchasing and mining initiatives
brought greater quantities of this elusive tourmaline
to the market, particularly in Japan, where it has
gained popularity and commanded high prices
(Federman, 2002; “Supplier to vertically inte-
grate…,” 2004). Although most of the cut tourma-
line available is in melee sizes (<0.20 ct), exception-
al faceted stones up to 50 ct have been cut (figure 1).
Due to its unusual color and composition, this
tourmaline attracted considerable attention in the
mineralogical literature when it first entered the
marketplace (see Nuber and Schmetzer, 1984;
Schmetzer and Bank, 1984a; Rossman and Mattson,
1986; Shigley et al., 1986). While some of these arti-
cles did not specify the locality within Zambia, oth-
ers stated “near Chipada,” which refers to the
largest town (Chipata) in eastern Zambia, located
S
the deposit with Tommy Wu (Shire Trading Ltd.,
Hong Kong), who was leasing the mine in partner-
ship with a Zambian company. Since then, Mr. Wu
has updated information on the mining and produc-
tion, and supplied additional samples for our
research.
LOCATION AND ACCESS
The Canary mining area is located at coordinates
12°23.764′ S, 32°53.471′ E, and ~1,440 m elevation.
This position lies 32 km west-southwest of Lundazi
(figure 2 inset), from which the deposit can be
reached in about one hour by car on moderately well-
maintained dirt roads. Two small villages are located
near the mining area: Muchapansala and Chanya-
lubwe. The mining camp (figure 3) is powered by a
generator and obtains drinking water from a well.
The deposit can be worked roughly 10 months of the
year, excluding the rainy season from late December
to early February. In the past, the deposit also has
been referred to as the Kaombeka or Doost-Chiwele
mine (Njamu, 2003).
HISTORY AND PRODUCTION
Initial gem discoveries in the Lundazi District proba-
bly occurred in the late 1970s through activities of
local villagers (Patney and Tether, 1988). The Canary
mining area was originally worked for electronic-
grade quartz (ca. 1982), and the brown tourmaline
was tossed into the mine dumps (Njamu, 2003).
Yellow tourmaline from eastern Zambia was first
documented by Schmetzer and Bank (1983). It is like-
ly that the material came from the Canary mining
area (known as Kaombeka at the time), which is the
most important source of this tourmaline in the area.
A survey of the literature revealed only one other yel-
low tourmaline–producing site in the Lundazi
District, which was mapped by O’Connor (1998) as
the Chamunjili mine, located 18 km northeast of the
Canary mining area. To the authors’ knowledge, this
locality has not been active for several years.
The first organized search for tourmaline in the
Canary mining area occurred in 1987 (when it was
still known as Kaombeka). At that time, the main
pegmatite was worked by the Small Mines Unit of
Zambian Consolidated Copper Mines (ZCCM).
Although Zgambo (1995) reported that ZCCM
removed 540 m3 of material from two pits, yielding
242 kg of gem rough, the total production of tour-
YELLOW TOURMALINE FROM ZAMBIA GEMS & GEMOLOGY WINTER 2007 315
Figure 1. Commercial
quantities of Mn-rich
“canary” yellow elbaite
come from just one
deposit, the Canary
mining area in eastern
Zambia. Although the
material is typically cut
in melee sizes, this
exceptional stone
weighs 50.26 ct. Cour-
tesy of Shire Trading
Ltd.; photo © Harold &
Erica Van Pelt.
a
Tsilaisite is the name proposed by Kunitz (1929) for a hypothetical
Mn-rich tourmaline end member, after the first locality where high-Mn
tourmaline was documented (Tsilaisina, Madagascar). The term
appeared in a list of new mineral names published by Dunn et al.
(1985), although it had not been approved by the Commission on
New Minerals and Mineral Names of the International Mineralogical
Association. Tsilaisite was recently included in a list of discredited
minerals (Burke, 2006), because no samples have been documented
with sufficient Mn to attain the end-member composition. Therefore,
we have placed the term in quotes when referring to the Mn-rich end-
member composition in this article.
maline (of all qualities) obtained by ZCCM was
probably several tonnes (T. Wu, pers. comm., 2004).
The largest single gem pocket was reportedly dis-
covered in the mid-1990s by a subsequent owner; it
produced approximately 3 tonnes of tourmaline, of
which 0.5 tonne was of good gem quality (T. Wu,
pers. comm., 2004). This pocket was found at a
depth of about 4 m, and two smaller cavities—
which yielded up to 100 kg of tourmaline—were
encountered at approximately the same depth as
mining proceeded to the east. As of November
1997, the deposit lay idle and the pit was filled with
water (O’Connor, 1998).
In 2001, Mr. Wu together with Rita and Arun
Mittal entered a purchasing agreement with as
many as 60 local miners working the eluvial and
alluvial deposits. They began creating a market for
yellow tourmaline in Japan (and, to a lesser extent,
in the U.S. and Europe) with gems cut from 3–4 kg
of good-quality rough material. In late 2002, Mr. Wu
and the Mittals formed a partnership to lease the
area under the name Canary Mining Ltd. By the end
of 2002, Canary Mining had amassed ~800 kg of
rough tourmaline. Most of this would cut small
stones of 3 mm or less, but a few large gems (e.g.,
30, 14, and 11 ct) also were faceted.
In February 2003, Canary Mining began working
secondary deposits near the original pegmatite, with
modest results over the next five months. From
December 2003 to August 2004, they used an exca-
vator to explore primary deposits on the property
(figure 4). However, they did not recover any tour-
maline from the new areas tested, and the main pit
appeared to be exhausted. Subsequent work has
focused on intermittently mining the secondary
deposits, typically producing 30–40 kg per month
(or ~2 kg of tourmaline per day, consisting of
500–800 g of good gem rough). The 50 ct tourma-
line in figure 1 was cut from this material (T. Wu,
pers. comm., 2006).
In July 2007, Canary Mining Ltd. was acquired
by Canary Gemstone International DMCC, a hold-
ing company formed in Dubai, with Mr. Wu and
Mrs. Mittal as major shareholders. The influx of
capital obtained through this venture will allow for
the expansion of mining activities in 2008.
316 YELLOW TOURMALINE FROM ZAMBIA GEMS & GEMOLOGY WINTER 2007
Figure 2. The Canary mining area is located in
eastern Zambia, 32 km west-southwest of Lundazi.
The mining area is covered by the Tumbuka,
Kabelubelu, and Canary concessions. Most Canary
tourmaline production has come from Kabelubelu.
The Canary concession has been a source of “dou-
ble blue” aquamarine, but not tourmaline.
GEOLOGY
Pegmatites in the Lundazi area are known for pro-
ducing mica and gem-quality aquamarine, spessar-
tine, tourmaline (green, pink, or yellow), and rose
quartz. These pegmatites and their gems have been
described by Thomas (1982), Patney and Tether
(1988), Zgambo (1995), Johnson et al. (1997),
Milisenda et al. (2000), and Njamu (2003). Patney
and Tether (1988) defined two belts of gem-bearing
pegmatites in the Lundazi District, and indicated
that they are broadly synchronous with the late
Pan-African Sinda Batholith (~489 million years old
[Ma]). Snelling et al. (1972) dated an undeformed
pegmatite near Lundazi at 485 Ma.
The Canary mining area is underlain by
Precambrian metamorphic rocks of the Irumide
Foldbelt (e.g., Johns et al., 1989). O’Connor (1998)
mapped the deposit within leucocratic gneiss (con-
taining biotite, garnet, and sillimanite) of the
Lumezi Gneiss Group. Deep soils cover the area,
and the best exposures of the basement rocks are
found in some mining pits and along the stream
that crosses the mining claims.
The main pegmatite in the Canary mining area
YELLOW TOURMALINE FROM ZAMBIA GEMS & GEMOLOGY WINTER 2007 317
Figure 3. The mining camp for Canary tourmaline, shown here in the dry season (August), is located in a remote
part of the Lundazi District. Photo by W. B. Simmons.
Figure 4. Canary Mining
Ltd. used a large excava-
tor to explore primary
deposits from December
2003 to August 2004.
The main pegmatite is
being mined down-dip
from the area that pro-
duced large amounts of
tourmaline in the mid-
1990s; Asok Napa (in
the foreground) was the
mine’s general manager
during that time. Photo
by Tommy Wu.
318 YELLOW TOURMALINE FROM ZAMBIA GEMS & GEMOLOGY WINTER 2007
is a lens-shaped body that discordantly intrudes
biotite gneiss; it strikes east-west (~100°) and dips
moderately south. At the time of the authors’ 2004
visit, a large open pit (~16 m deep) partially filled
with water marked the site where most of the peg-
matite had been removed. Based on the extent of
the workings, the pegmatite is believed to have
been at least 60 m long and perhaps 18 m at its
widest point (Njamu, 2003). Exposures of the foot-
wall showed a medium-grained border zone (~15 cm
wide) and in places a discontinuous aplitic zone that
abruptly transitioned into a coarse-grained interme-
diate zone consisting mainly of K-feldspar and sub-
ordinate sodic plagioclase (figure 5). The hydrother-
mal leaching of quartz had resulted in vugs that
contained euhedral overgrowths of albite and black
tourmaline needles. We also observed conspicuous
veins (up to 10 cm thick) of black tourmaline ± K-
feldspar + albite cross-cutting the pegmatite. The
host gneiss adjacent to the pegmatite was locally
biotized and tourmalinized near the contact, but the
minimal alteration overall indicated that the peg-
matite had little interaction with the wallrock.
The large cavity found in the mid-1990s was in
the central-northwestern part of the pit, in or near
the core of the pegmatite. This pocket also con-
tained abundant quartz crystals and “cleave-
landite” feldspar. Although remains of these miner-
als were found on the mine dump, there was no
evidence of any micas, such as the lepidolite that is
commonly associated with gem tourmaline in
granitic pegmatites.
The Canary deposit is distinctly different from
other gem-bearing pegmatites in the area in that it
lacks micas and is not a source of aquamarine.
Zgambo (1995) indicated that rose quartz, mica,
beryl, and gem-quality pink tourmaline were
encountered during mining in 1987, but no evidence
of these minerals was seen during our visit. There
was also no evidence of the allanite, magnetite, and
blue/pink/green tourmaline that were reported by
Njamu (2003). One of the present authors (BA) noted
some spessartine in the mine dumps in 2003, but no
garnet was seen in the pegmatite itself.
A reconnaissance survey of past workings in the
surrounding area during the authors’ visit revealed
two additional pegmatites with similar mineralogy,
but they were much smaller than the main peg-
matite and reportedly did not yield any gem tour-
maline in situ (T. Wu, pers. comm., 2004). In addi-
tion, pegmatites with a distinctively different min-
eralogy were seen in the area. These quartz-rich peg-
matites contained biotite (in sparse amounts, and
typically no schorl) as the mafic mineral, and
formed segregations in a granitoid rock or cross-cut-
ting dikes in biotite gneiss. They were mined for
dark blue (or “double blue”) aquamarine (Laurs,
2004), which is frozen within the pegmatites rather
than forming in cavities; therefore, the beryl rarely
yields cut stones larger than 0.5 ct. Ductile deforma-
tion (the presence of bent and deformed crystals) of
the beryl-bearing pegmatites indicated that they are
older than the undeformed feldspar- and black tour-
maline–rich type of pegmatite that contains Canary
tourmaline. In places the deformed pegmatites
underlie the eluvial deposits mined for tourmaline,
Figure 5. The contact between the footwall of the
main pegmatite and the weathered host rock is
marked by the sharp boundary to the right of the
hammer (see yellow line). The hammer is sitting
on the medium-grained border zone, which is sepa-
rated from the coarse-grained feldspar-rich inter-
mediate zone by a vein of black tourmaline +
K-feldspar. Photo by B. M. Laurs.
which has created confusion about the original
source of this gem material. O’Connor (1998) also
documented at least two phases of pegmatites in
this part of the Lundazi District, and indicated that
the magnetic signature of the area suggests it may
be underlain by a large granitic body.
According to Mr. Wu, other pegmatites located
within a few kilometers of the Canary mining area
have produced spessartine and chrysoberyl.
MINING AND PROCESSING
The Canary mining area consists of three mining
concessions, covering a total of 600 ha (6 km2
).
From west to east, these are the Tumbuka,
Kabelubelu, and Canary licenses (again, see figure
2). During the authors’ visit in 2004, 13 workings
were seen, most of which were located on the
Kabelubelu concession. These ranged from large
open pits to small exploration trenches, in both pri-
mary and secondary (alluvial and eluvial) deposits.
Most of the Canary tourmaline produced since
2000 has come from the Kabelubelu concession,
from secondary deposits located downslope of the
main pegmatite. Mining was done by hand (figure 6,
left) or with a small excavator to a depth of ~1–1.5
m (exceptionally, down to 5 m). The most favorable
soil horizon for tourmaline was marked by a con-
centration of quartz fragments or pebbles. Miners
wet-screened the material using 4 × 4 mm mesh
(figure 6, right) or processed it through a simple
washing plant (figure 7) consisting of a cement
mixer, vibrating screens with mesh from 5 cm to 1
cm, and a sorting table (Njamu, 2003). Using water
from a seasonal stream that flows through the min-
ing area, the washing plant can process about 10–12
tonnes of material per day.
Mining of the primary deposits (for both tourma-
line and aquamarine) was done using a large excava-
tor (again, see figure 4), a pneumatic hammer, and
by hand with picks, shovels, pry bars, hammers, and
chisels. To avoid breaking the gem material, Canary
YELLOW TOURMALINE FROM ZAMBIA GEMS & GEMOLOGY WINTER 2007 319
Figure 6. Secondary deposits downslope from the main Canary pegmatite are typically mined to a depth of
1–1.5 m (left). The miners recovered the gem rough by wet-screening the excavated material using water from
a flooded mining pit (right). Photos by B. Anckar, June 2003.
Figure 7. The washing plant that is also used to pro-
cess material from the secondary deposits consists of
a cement mixer followed by a series of vibrating
screens. The water tank is filled from a small reservoir
made in a seasonal stream that flows through the
mining area. Photo by B. M. Laurs.
WN07
WN07
WN07
WN07
WN07
WN07
WN07
WN07
WN07
WN07
WN07
WN07
WN07
WN07
WN07
WN07
WN07
WN07
WN07
WN07
WN07
WN07
WN07
WN07
WN07
WN07
WN07
WN07
WN07
WN07
WN07
WN07
WN07
WN07
WN07
WN07
WN07
WN07
WN07
WN07
WN07
WN07
WN07
WN07
WN07
WN07
WN07
WN07
WN07
WN07
WN07
WN07
WN07
WN07
WN07
WN07
WN07
WN07
WN07
WN07
WN07
WN07
WN07
WN07
WN07
WN07
WN07
WN07
WN07
WN07
WN07
WN07
WN07
WN07
WN07
WN07
WN07
WN07
WN07
WN07
WN07
WN07
WN07
WN07
WN07
WN07
WN07
WN07
WN07

More Related Content

Similar to WN07 (9)

jewelry presentation
jewelry presentationjewelry presentation
jewelry presentation
 
Minerals
MineralsMinerals
Minerals
 
Minerals
MineralsMinerals
Minerals
 
Geomania: Minerals & rocks
Geomania: Minerals & rocksGeomania: Minerals & rocks
Geomania: Minerals & rocks
 
English3
English3English3
English3
 
Gemmology
GemmologyGemmology
Gemmology
 
Fundamentals Of Gemstones | Drishti Gems
Fundamentals Of Gemstones | Drishti GemsFundamentals Of Gemstones | Drishti Gems
Fundamentals Of Gemstones | Drishti Gems
 
How to Choose the Perfect Gemstone
How to Choose the Perfect GemstoneHow to Choose the Perfect Gemstone
How to Choose the Perfect Gemstone
 
My Experience As Teacher - Free Essay. Online assignment writing service.
My Experience As Teacher - Free Essay. Online assignment writing service.My Experience As Teacher - Free Essay. Online assignment writing service.
My Experience As Teacher - Free Essay. Online assignment writing service.
 

WN07

  • 1. THE QUARTERLY JOURNAL OF THE GEMOLOGICAL INSTITUTE OF AMERICA WINTER2007PAGES291–408VOLUME43NO.4 VOLUME XLIII WINTER 2007 GEMS&GEMOLOGY CVD Synthetic Diamonds Canary Tourmaline Fluorescence Spectroscopy Napoleon Necklace
  • 2. ® Carat Points pg. 329 VOLUME 43, NO. 4Winter 2007 291 294 332 352 314 358 366 395 392 401 REGULAR FEATURES _____________________ Lab Notes Apatite in spessartine • Atypical photoluminescence feature in a type IIa diamond • Diamond with “holiday” inclusions • Diamond with large etch channels containing iron sulfides • Black diamond with an oriented etch channel • The pareidolia of diamonds • Notable emerald carving • Gold coated onyx • Double-star sapphire • Imitation turquoise Gem News International Record auction prices for diamonds • Namibian diamond mining • Double jeopardy in amber • Andradite from Namibia • Andradite from Pakistan • Axinite from Tanzania • Baddeleyite from Mogok, Myanmar • Chrysocolla chalcedony from Iran/Armenia area • Clinohumite and chondrodite from Tanzania • Transparent dumortierite and sapphirine from Tanzania • Brazilian blue “opal” • Otolith pendant • Inclusions in quartz from Paraíba, Brazil • Sinhalite from Myanmar • Cu-bearing tourmaline mines in Mozambique • New Cu-bearing tourmaline from Nigeria • Synthetic beryl simulating “Paraíba” tourmaline • YAG with a “reverse” color change • Conference reports Book Reviews Gemological Abstracts 2007 Subject and Author Index LETTERS ________ FEATURE ARTICLES _____________ Latest-Generation CVD-Grown Synthetic Diamonds from Apollo Diamond Inc. Wuyi Wang, Matthew S. Hall, Kyaw Soe Moe, Joshua Tower, and Thomas M. Moses Presents the gemological and spectroscopic properties of Apollo’s latest products, which show significant improvements in size, color, and clarity. Yellow Mn-rich Tourmaline from the Canary Mining Area, Zambia Brendan M. Laurs, William B. Simmons, George R. Rossman, Eric A. Fritz, John I. Koivula, Björn Anckar, and Alexander U. Falster Explores the vivid “canary” yellow elbaite from the Lundazi District of eastern Zambia, the most important source of this tourmaline. Fluorescence Spectra of Colored Diamonds Using a Rapid, Mobile Spectrometer Sally Eaton-Magaña, Jeffrey E. Post, Peter J. Heaney, Roy A. Walters, Christopher M. Breeding, and James E. Butler Reports on the use of fluorescence spectroscopy to characterize colored diamonds from the Aurora Butterfly and other collections. NOTES AND NEW TECHNIQUES ________ An Examination of the Napoleon Diamond Necklace Eloïse Gaillou and Jeffrey E. Post Provides a history and gemological characterization of this historic necklace. pg. 383 pg. 360 pg. 295
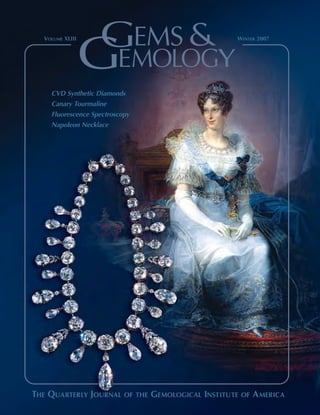
  • 3. Editor-in-Chief Alice S. Keller akeller@gia.edu Managing Editor Thomas W. Overton tom.overton@gia.edu Technical Editor Sally Magaña sally.magana@gia.edu Consulting Editor Carol M. Stockton Contributing Editor James E. Shigley Editor Brendan M. Laurs The Robert Mouawad Campus 5345 Armada Drive Carlsbad, CA 92008 (760) 603-4503 blaurs@gia.edu Associate Editor Stuart Overlin soverlin@gia.edu Circulation Coordinator Debbie Ortiz (760) 603-4000, ext. 7142 dortiz@gia.edu Editors, Lab Notes Thomas M. Moses Shane F. McClure Editor, Gem News International Brendan M. Laurs Editors, Book Reviews Susan B. Johnson Jana E. Miyahira-Smith Thomas W. Overton Editors, Gemological Abstracts Brendan M. Laurs Thomas W. Overton EDITORIAL STAFF SUBSCRIPTIONS MANUSCRIPT SUBMISSIONS COPYRIGHT AND REPRINT PERMISSIONS Subscriptions to addresses in the U.S. are priced as follows: $74.95 for one year (4 issues), $194.95 for three years (12 issues). Subscriptions sent elsewhere are $85.00 for one year, $225.00 for three years. Canadian subscribers should add GST. Special rates are available for GIA alumni and current GIA students. One year: $64.95 to addresses in the U.S., $75.00 else- where; three years: $179.95 to addresses in the U.S., $210.00 elsewhere. Please have your student or Alumni number ready when ordering. Go to www.gia.edu or contact the Circulation Coordinator (see above). Single copies of this issue (print or PDF) may be purchased for $19.00 in the U.S., $22.00 elsewhere. Discounts are given for bulk orders of 10 or more copies of any one issue. A limited number of back issues are also available for purchase. Please address all inquiries regarding subscriptions and single copy or back issue purchases to the Circulation Coordinator or visit www.gia.edu. To obtain a Japanese translation of Gems & Gemology, contact GIA Japan, Okachimachi Cy Bldg., 5-15-14 Ueno, Taitoku, Tokyo 110, Japan. Our Canadian goods and service registration number is 126142892RT. Gems & Gemology’s impact factor is 1.381 (ranking 11th out of the 26 journals in the Mineralogy category), according to Thomson Scientific’s 2006 Journal Citation Reports (issued July 2007). Full-text electronic (PDF) versions of Gems & Gemology issues from Spring 2005 to the present are available through EBSCO. Gems & Gemology is abstracted in Thomson Scientific products (Current Contents: Physical, Chemical & Earth Sciences and Science Citation Index—Expanded, including the Web of Knowledge) and other databases. For a complete list, see www.gia.edu/gemsandgemology. Gems & Gemology welcomes the submission of articles on all aspects of the field. Please see the Guidelines for Authors on our Website, or contact the Managing Editor. Letters on articles published in Gems & Gemology are also welcome. Abstracting is permitted with credit to the source. Libraries are permitted to photocopy beyond the limits of U.S. copyright law for private use of patrons. Instructors are permitted to photocopy isolated articles for noncommercial classroom use without fee. Copying of the photographs by any means other than traditional photocopying techniques (Xerox, etc.) is prohibited without the express permission of the photographer (where listed) or author of the article in which the photo appears (where no photographer is listed). For other copying, reprint, or republication permission, please contact the Managing Editor. Gems & Gemology is published quarterly by the Gemological Institute of America, a nonprofit educational organization for the gem and jewelry industry, The Robert Mouawad Campus, 5345 Armada Drive, Carlsbad, CA 92008. Postmaster: Return undeliverable copies of Gems & Gemology to GIA, The Robert Mouawad Campus, 5345 Armada Drive, Carlsbad, CA 92008. Any opinions expressed in signed articles are understood to be the opinions of the authors and not of the publisher. Shigeru Akamatsu Tokyo, Japan Edward W. Boehm Solana Beach, California James E. Butler Washington, DC Alan T. Collins London, United Kingdom John Emmett Brush Prairie, Washington Emmanuel Fritsch Nantes, France Henry A. Hänni Basel, Switzerland Jaroslav Hyr`´sl Prague, Czech Republic A. J. A. (Bram) Janse Perth, Australia Alan Jobbins Caterham, United Kingdom Mary L. Johnson San Diego, California Anthony R. Kampf Los Angeles, California Robert E. Kane Helena, Montana Lore Kiefert New York, New York Thomas M. Moses New York, New York Mark Newton Coventry, United Kingdom George Rossman Pasadena, California Kenneth Scarratt Bangkok, Thailand James E. Shigley Carlsbad, California Christopher P. Smith New York, New York Christopher M. Welbourn Reading, United Kingdom PRODUCTION STAFF EDITORIAL REVIEW BOARD Art Director Production Assistant Website: Karen Myers Allison DeLong www.gia.edu The Napoleon Necklace was presented by Napoleon Bonaparte to his second wife, Empress Marie-Louise, in 1811 to celebrate the birth of their son. In this issue, the article by Drs. Eloïse Gaillou and Jeffrey Post presents gemological data on a selection of diamonds from this notable jewel. Necklace courtesy of the Smithsonian Institution, Washington, DC; photo © Harold & Erica Van Pelt. Painting of Marie-Louise by Giovan Battista Borghesi, courtesy of Scala/Art Resource, New York. Color separations for Gems & Gemology are by Pacific Plus, Carlsbad, California. Printing is by Allen Press, Lawrence, Kansas. © 2007 Gemological Institute of America All rights reserved. ISSN 0016-626X ABOUT THE COVER ® DATABASE COVERAGE
  • 4. LETTERS GEMS & GEMOLOGY WINTER 2007 291 In the case of the yellow color treatment, the authors noted the presence of the N2 center in natural yellows and the implied absence in treated yellows (see figure 7). I sincerely doubt that this is the general case, as it would depend strongly on the starting mate- rial. I consider this element of the figure somewhat misleading. In addition, I do not think that the authors stressed and warned strongly enough that treated melee of this type will surely show up in mounted goods without disclosure, and that few if any jewelers and appraisers will have a realistic chance of discriminating them from untreated goods. This is a legal liability problem for all in the trade and one that requires attention from industry authorities, and perhaps the authors would Letters G&G IN THE BUSH So there I am, out in the middle of the Tanzanian bush at Tunduru, spitting distance from Mozam- bique, on the Muhuwesi River. I’m haggling over a parcel of sapphire with a miner named Joseph. He reaches into his bag and pulls out one of the most dog-eared documents I’ve ever laid eyes on (figure 1). It’s one of his most treasured possessions. I thought you and your readers might get a kick out of this photo. Richard W. Hughes Fallbrook, CA REPLY The G&G editors indeed enjoyed the photo, and we would dearly like to replace Mr. Mayunga’s tattered issue. Any G&G readers who plan to travel to the area in the near future should contact us so that we can send a replacement (and a copy of this issue) for him. Figure 1. Tanzanian miner Joseph Mayunga, who lives along the eastern side of the Muhuwesi River near Mining Area number 8, displays a weathered copy of the Winter 1996 Gems & Gemology. He was given the issue by a Sri Lankan gem dealer in thanks after closing a large deal for chrysoberyl rough. Photo by R. W. Hughes. MORE ON COATED COLORED DIAMONDS Although the Spring 2007 article by A. H. Shen et al., “Serenity coated colored diamonds: Detection and durability,” imparted a vast amount of technical infor- mation, I believe it also omitted important elements and warnings that would be of use to G&G readers lacking technical backgrounds. I note that the authors did not show pre- and post- treatment spectra of the same diamond, but rather chose to compare arbitrary treated diamonds with their natural counterparts, a comparison that may be mis- leading for the vast majority of readers, as it discounts the inevitability that natural very light fancy-colored diamonds will be, and probably have been, color enhanced by this or similar treatments. This important fact was not stressed enough.
  • 5. have some suggestions on how the trade could appro- priately, and simply, handle that. Finally, GIA has the data to present ratios of treat- ed spectra normalized to the untreated spectra such that the relative effects of a particular treatment can be predicted. It would be in the best interest of educa- tion that these data be made available on the G&G web site. In fact, I would suggest that in the future ASCII text spectral information (wavelength vs. absorbance) files for all spectra presented in G&G be made so available. Martin D. Haske Brookline, Massachusetts REPLY We appreciate Mr. Haske’s thoughtful comments. We did, in fact, collect pre- and post-treatment spectra of the same stones. However, we felt that the vast majority of readers would be more interested in seeing the differ- ence between a treated diamond and a natural diamond with similar color. Such information, in our opinion, is more useful in gem identification than simply compar- ing pre- and post-treatment spectra. Indeed, not every yellow diamond shows the N2 absorption feature in its spectra. However, the apparent color of these treated yellow diamonds is quite close to that of the “cape” diamonds known to the trade, and these natural stones typically do display the N2, N3, and cape absorption lines. Therefore, we tried to show the difference in spectral features between these treated stones and natural-color diamonds of similar hue. However, we do agree that we should have pointed this out in the figure caption. We agree wholeheartedly that the issue of treated melee is an important one. In fact, this is a problem with any gemstone treatment. We know that there are irradiated and HPHT-treated melee diamonds in the market, but there is no easy or simple solution to this dilemma. Once the coated stones are mounted, espe- cially in a bezel setting, it can be very difficult to cor- rectly identify them. We feel the best approach to this problem is to educate the trade and the public to the existence of such treatments, and to promote vigilance in the trade by providing identification information. These were the main purposes of this article. With respect to the raw spectral data, the G&G editors have informed us that they will be happy to collect and post such data files in the Gems & Gemology Data Depository, at the discretion of the authors involved. Andy H. Shen, Shane F. McClure, and James E. Shigley Carlsbad, California Wuyi Wang, Matthew S. Hall, and Thomas M. Moses New York, New York Steven Novak East Windsor, New Jersey Gems & Gemology author Masashi Furuya passed away suddenly on October 23 at the age of 59. Mr. Furuya, the founder and director of the Japan Germany Gemmological Labora- tory in Kofu, Japan, had recently com- pleted an article titled “Copper-bearing Tourmalines from New Deposits in Paraíba State, Brazil” for the journal’s Fall 2007 issue (pp. 236–239). He was also a co-author of “Paraíba-type Copper-bearing Tourmaline from Brazil, Nigeria, and Mozambique: Chemical Fingerprinting by LA-ICP-MS” (Spring 2006), which received third place in last year’s Edward J. Gübelin Most Valuable Article Awards. After studying German at Reitaku University, Mr. Furuya traveled to Idar-Oberstein and received a Diploma in Gemmology from the German Gemmological Association in 1972. Four years later, he was awarded a Diploma in Gemmology from the Gemmological Association of Great Britain. Throughout his career, Mr. Furuya visited many new gem-pro- ducing localities and introduced those goods to the Japanese market. He estab- lished the Japan Germany Gem- mological Laboratory in 1994 and had served as a delegate to the International Gemmological Conference since 1999. Mr. Furuya is survived by his wife, Kimiko, and son and daughter, Masaki and Rena. His son will continue the work of the Japan Germany Gemmological Laboratory. 292 LETTERS GEMS & GEMOLOGY WINTER 2007 IN MEMORIAM MASASHI FURUYA (1948–2007)
  • 6. cations for this material. Since then, significant improvements in growth technique and, conse- quently, crystal quality have been reported (Martineau et al., 2004; Yan et al., 2004; Tallaire et al., 2005; Wang et al., 2005; Miyatake et al., 2007). Apollo Diamond Inc. of Boston, Massachusetts, demonstrated its ability to grow single-crystal CVD synthetic diamonds of moderate gem quality sever- al years ago (Wang et al., 2003). For the most part, the samples examined in 2003 were relatively small and of limited thickness for faceting purposes. Nearly all of these early crystals were predominant- ly brown with varying degrees of saturation. Colorless CVD-grown diamonds, both nitrogen doped and high purity, were also synthesized by LIMHP-CNRS in France (Achard et al., 2005; Wang et al., 2005), but the reported crystals were usually LATEST-GENERATION CVD-GROWN SYNTHETIC DIAMONDS FROM APOLLO DIAMOND INC. Wuyi Wang, Matthew S. Hall, Kyaw Soe Moe, Joshua Tower, and Thomas M. Moses See end of article for About the Authors and Acknowledgments. GEMS & GEMOLOGY, Vol. 43, No. 4, pp. 294–312. © 2007 Gemological Institute of America Gemological and spectroscopic properties of 43 CVD synthetic diamonds from Apollo Diamond Inc. were examined to characterize the latest generation of their CVD products. These samples, which included both faceted gems and partially polished crystals, were provided as representa- tive examples of Apollo’s 2006–2007 production. Relative to the Apollo CVD products examined in 2003, the new samples showed significant improvements in size, color, and clarity. In addition to colorless and near-colorless material, fancy orange-to-pink colors are now produced. These high-quality CVD-grown diamonds, comparable in color and clarity to natural diamonds, can be identified using a combination of gemological and spectroscopic properties. 294 NEW CVD-GROWN SYNTHETIC DIAMONDS FROM APOLLO GEMS & GEMOLOGY WINTER 2007 he ability to grow high-quality diamond in the laboratory has been aggressively pursued for several decades, due to the value that dia- mond holds in the semiconductor, optics, and gem industries. While the growth of gem-quality single- crystal diamonds under high-pressure, high-temper- ature (HPHT) conditions has been intensely studied and well documented, the synthesis of single-crystal diamond by the chemical vapor deposition (CVD) technique is relatively new and has evolved rapidly over the past few years. Before 2003, the CVD tech- nique was primarily used to grow polycrystalline diamonds of micrometer size. Badzian and Badzian (1993) reported the growth of CVD single-crystal synthetic diamond as thick as 1.2 mm; subsequent- ly, several other groups (e.g., Doering et al., 1999; Linares and Doering, 1999) reported the CVD growth of undoped and boron-doped single-crystal diamond of approximately 1 mm thickness. Yan et al. (2004) reported the successful synthesis of “thick” nitrogen-doped free-standing single-crystal diamond using the microwave plasma CVD tech- nique, a discovery that led to numerous new appli- T
  • 7. less than 1.6 mm thick. More recent CVD products from Apollo, however, have shown substantial improvements in quality. Apollo Diamond began to formally introduce its CVD-grown diamonds to the general public in 2007. They are currently available through Bostonian Jewelers, a Boston retailer, and via inquiries directed through the company’s website at www.apollodia- mond.com. Due to the potential impact that gem- quality CVD synthetic diamonds might have in the consumer market, the jewelry industry has shown great interest in developing a better understanding of these products, improvements in their quality, and their potential use in jewelry applications, as well as the ability of gem-testing laboratories to identify this material and separate it from natural diamonds. In this report, we characterize the proper- ties of CVD synthetic diamonds produced by Apollo from 2006 to 2007 that are representative of their current generation of products (figure 1). CVD GROWTH The CVD method of growing diamond is very dif- ferent from the well-known HPHT technique. The CVD method involves gaseous reagents—typically a small amount of methane (CH4 as the source of carbon) in hydrogen (H2)—in a chamber with a sin- gle-crystal diamond substrate usually with {100} ori- entation. More than one substrate can be placed in the reaction chamber to grow several synthetic dia- mond crystals simultaneously. A reaction among these components is initiated with a plasma, hot fil- ament, or combustion flame. Carbon atoms, prod- ucts of a series of chemical reactions, deposit as dia- mond on a substrate at relatively low temperatures (~1000°C) and low pressures (between 10 and 200 torr). The reactants, products, and reactive species are transported throughout the chamber by diffu- sion and convection. On the substrate surface, vari- ous reactions (adsorption, diffusion, and desorption) occur among the chemical species, leading to the deposition of synthetic diamond and, ultimately, the growth of a continuous layer of synthetic dia- mond. Goodwin and Butler (1997) reviewed the important features of the growth environment and critical aspects of the growth process. MATERIALS AND METHODS CVD Samples. For this study, Apollo Diamond pro- vided a total of 43 CVD synthetic diamonds to the GIA Laboratory for examination; 31 were faceted, and the remainder were fashioned into cylinders or partially polished plates. The samples were segregat- ed into three color groups: colorless to near colorless (29), fancy orange to pink (11), and dark brown (3). The entire suite ranged from 0.13 to 1.20 ct. See NEW CVD-GROWN SYNTHETIC DIAMONDS FROM APOLLO GEMS & GEMOLOGY WINTER 2007 295 Figure 1. The latest- generation CVD synthetic diamonds produced by Apollo Diamond Inc., which are now available in the gem market, showed signifi- cant improvement in quality compared to those reported by Wang et al. in 2003. These representative sam- ples weigh 0.24–0.67 ct. Photo by Robert Weldon.
  • 8. TABLE 1. The three groups of latest-generation Apollo CVD-grown synthetic diamonds examined for this study. Sample Weight Fluorescence to Fluorescence to number (ct) long-wave UV short-wave UV Near colorless AP-01 Round brilliant Very good 0.15 E VVS2 Inert Inert AP-02 Princess na 0.30 F VS1 Very weak orange Very weak orange AP-03 Round brilliant Very good 0.19 F VVS2 Inert Inert AP-04 Round brilliant Very good 0.14 G VS1 Inert Inert AP-05 Round brilliant Excellent 0.21 F VS1 Inert Inert AP-06 Round brilliant Very good 0.16 G VS1 Inert Inert AP-07 Round brilliant Good 0.20 I SI2 Inert Very weak orange AP-08 Round brilliant Very good 0.27 H VS2 Inert Inert AP-09 Round brilliant Very good 0.23 H VVS2 Inert Very weak orange AP-10 Round brilliant Excellent 0.27 J SI2 Inert Very weak orange AP-12 Round brilliant Very good 0.20 H VVS2 Inert Inert AP-13 Round brilliant Good 0.21 L VS2 Inert Inert AP-14 Round brilliant Very good 0.25 I VS2 Inert Inert AP-15 Round brilliant Very good 0.30 I SI1 Inert Inert AP-16 Round brilliant Good 0.25 M VS1 Inert Inert AP-17 Round brilliant Very good 0.20 J VVS1 Inert Inert AP-18 Round brilliant Excellent 0.62 K I1 Inert Very weak orange AP-19 Round brilliant Good 0.28 H VS2 Very weak orange Inert AP-20 Round brilliant Excellent 0.26 I SI2 Very weak orange Very weak orange AP-21 Cylinder na 0.36 na na Inert Inert AP-22 Cylinder na 0.24 na na Inert Inert AP-23 Cylinder na 0.19 na na Inert Inert AP-24 Cylinder na 0.31 na na Inert Inert AP-25 Cylinder na 0.37 na na Inert Inert AP-26 Cylinder na 0.52 na na Inert Very weak orange AP-27 Cylinder na 0.13 na na Inert Inert AP-28 Cylinder na 0.52 na na Inert Inert AP-29 Cylinder na 0.32 na na Inert Inert AP-30 Cylinder na 0.25 na na Inert Inert Orange to pink AP-31 Tabular na 1.05 Brownish orangy pink na Weak orange, Very weak orange chalky AP-32 Tabular na 1.20 Pinkish brown na Very weak orange Very weak orange AP-33 Rectangular na 0.71 Fancy Dark brownish SI1 Weak orange, Very weak orange pinkish orange chalky AP-34 Princess na 0.28 Fancy Dark pink- VS2 Weak orange, Very weak orange brown chalky AP-37 Round brilliant na 0.34 Fancy brown-pink VVS2 Weak-to-moderate Very weak orange orange, chalky AP-38 Round brilliant na 0.40 Fancy orange-brown SI2 Moderate orangy Weak orangy yellow yellow AP-39 Round brilliant na 0.62 Fancy brown-orange SI2 Moderate orangy Weak orangy yellow yellow AP-40 Round brilliant na 0.18 Fancy brown-pink VVS2 Weak orange, Weak orange chalky AP-41 Round brilliant na 0.16 Fancy brown-pink VVS1 Weak orange, Very weak orange chalky AP-42 Round brilliant na 0.58 Fancy brownish VVS1 Moderate orange, Weak orange, orangy pink chalky chalky AP-49 Round brilliant na 0.19 Fancy brownish pink VS2 Weak orange, Weak orange, chalky chalky Dark brown AP-35 Round brilliant na 0.33 Fancy Dark yellowish SI1 Inert Inert brown AP-50 Round brilliant na 0.46 Fancy Dark orangy VS1 Inert Inert brown AP-51 Round brilliant na 0.29 Fancy Dark orangy SI2 Inert Inert brown aGIA’s cut grading system applies only to colorless or near-colorless round brilliant cut diamonds. For other shapes and fancy colors, “na” (not applicable) is indicated. 296 NEW CVD-GROWN SYNTHETIC DIAMONDS FROM APOLLO GEMS & GEMOLOGY WINTER 2007 Shape Cut gradea Color Clarity
  • 9. NEW CVD-GROWN SYNTHETIC DIAMONDS FROM APOLLO GEMS & GEMOLOGY WINTER 2007 297 table 1 for a full description of the individual sam- ples. These CVD-grown diamonds are representative of current Apollo Diamond production processes. Gemological Examination. For the purpose of this study, experienced GIA diamond grading staff deter- mined color and clarity grades on all faceted sam- ples using the standard conditions and methodology of GIA’s clarity and color grading systems (see, e.g., King et al., 1994). We examined the internal fea- tures of all the samples using both a standard gemo- logical binocular microscope and a research micro- scope with a variety of lighting techniques. Reactions to ultraviolet radiation (again, see table 1) were checked in a darkened room with a conven- tional four-watt combination long-wave (365 nm) and short-wave (254 nm) UV lamp. We also exam- ined all samples for their fluorescence and phospho- rescence properties, as well as growth characteris- tics, using the Diamond Trading Company (DTC) DiamondView deep-ultraviolet (<230 nm) lumines- cence imaging system (Welbourn et al., 1996). Spectroscopic Analysis. All samples were tested by all of the following methods. To avoid surface con- tamination in the spectroscopic analysis, we cleaned the samples thoroughly in acetone using an ultrasonic bath. Infrared absorption spectra were recorded in the mid-infrared (6000–400 cm–1 , 1 cm–1 resolution) and near-infrared (up to 11000 cm–1 , 4 cm–1 resolution) ranges at room temperature with a Thermo-Nicolet Nexus 670 Fourier-transform infrared (FTIR) spectrometer equipped with KBr and quartz beam splitters. We used a diffuse reflectance apparatus to focus the incident beam on the sample, and collected a total of 512 scans (per spectrum) to improve the signal-to-noise ratio. Spectra in the mid-infrared and near-infrared regions were normal- ized based on the two-phonon and three-phonon absorptions of diamond, respectively. Absorption spectra in the ultraviolet to visible to near-infrared (UV-Vis-NIR) range (250–850 nm) were recorded with a Thermo-Spectronic Unicam UV500 spec- trophotometer that used a sampling interval of 0.1 nm for all samples. The synthetic diamonds were mounted in a cryogenic cell and cooled to liquid nitrogen temperature (~77 K). Raman and photoluminescence (PL) spectra were recorded using a Renishaw InVia Raman confocal microspectrometer with an Ar-ion laser operating at two excitation wavelengths: 488 nm (for the 490–950 nm range) and 514.5 nm (for the 517–950 nm range). We collected PL spectra in the 640–850 nm range using a He-Ne laser (633 nm), and in the 835–1000 nm range using a NIR laser (830 nm). For PL analysis, all samples were cooled by direct immersion in liquid nitrogen. Three scans were accumulated to achieve a better signal-to-noise ratio. GEMOLOGICAL OBSERVATIONS Shapes. Most of the 31 faceted samples were round brilliants (two were princess cuts and one was a rectangular cut); they ranged in size from 0.14 to 0.71 ct. All the faceted gems exhibited standard cut dimensions. Based on the GIA cut grading system for round brilliant diamonds (Moses et al., 2004), most (14 of 18) of the colorless/near-colorless round brilliants were graded as excellent or very good. Both ends of the 10 near-colorless cylinders were polished for quantitative spectroscopic analysis and better examination of internal features. These cylin- ders varied in diameter from 2.40 to 3.75 mm and in thickness from 1.51 to 2.56 mm. All displayed dis- tinctive groove patterns on their edges, indicating that each was laser cut from a larger crystal; similar grooves were seen on the girdles of many of the faceted samples (figure 2). The two partially pol- ished plates (1.05 and 1.20 ct) exhibited a tabular morphology (figure 3), which is characteristic of as- grown CVD synthetic diamonds. Color. An outstanding feature of the 43 CVD-grown diamonds were the colors represented (again, see table 1). Twenty-nine samples were colorless, near colorless (figure 4), or only very slightly colored, and these are collectively referred to as the “near-color- less” group in this article. Of the 19 samples in this group given color grades (table 1; the cylinders were not color graded), four were colorless (E to F), 12 were near colorless (G to J), and three displayed very slight coloration (K to M). All the faceted Apollo samples in this group, except for the colorless ones, had a slightly brown component with no yellow apparent. Of the 14 fancy-color CVD products, 11 had significant orange or pink (or both) components with moderate-to-strong saturation (e.g., figure 5, a–c), and the other three samples were dark brown (e.g., figure 5d). Although the hue descriptions are similar between some of the samples in the “orange-to-pink” group and the three in the “dark brown” group (again, see table 1), these latter three specimens showed distinctly darker tone than the other 11 fancy-color samples and the predominant
  • 10. hue in all three was brown. Two samples in the “orange-to-pink” group were graded Fancy Dark, but both displayed a distinct orange-to-pink hue. Throughout this article, gemological and spectro- scopic features will be presented and discussed in terms of these three color groups. Clarity. GIA lab staff also determined clarity grades for the 31 faceted CVD-grown diamonds. Nine were given VVS grades (29%), 12 were VS (39%), and nine were SI (29%). One sample fell into the I (“includ- ed”) category. Cavities, fractures, small inclusions, and pinpoints (figure 6) were the most common clarity grade–setting internal features. The fractures and cavities varied from micrometer to millimeter scale, and most were surface reaching. Unlike what is typically seen in natural diamonds, the fractures in the CVD samples were usually not connected to inclusions. In general, the small inclusions and pin- points were randomly distributed. In rare cases, numerous pinpoints and small inclusions occurred together in cloud-like groups (figure 6c). Internal fea- tures were typically light in color with only a few small dark inclusions observed. Reactions to UV Radiation. Observation of the sam- ples while they were exposed to conventional short- and long-wave UV lamps revealed a close correla- tion between fluorescence and bodycolor (table 1). For the near-colorless group, only eight of the 29 samples showed very weak orange fluorescence to short- and/or long-wave UV radiation; the remain- ing samples were inert to both wavelengths. In con- trast, all the samples in the orange-to-pink group showed orange fluorescence of very weak to moder- ate intensity to long-wave UV, with obvious turbid- ity (“chalkiness”) in eight of the 11 samples. When exposed to short-wave UV, all of these CVD sam- ples displayed very weak to weak orange to orangy yellow fluorescence. No UV fluorescence was observed in the three diamonds in the dark brown group. None of the samples in the present study showed phosphorescence to conventional long- or short-wave UV radiation. When exposed to the high-intensity ultra-short wavelengths of the DTC DiamondView, most of the near-colorless group of synthetic diamonds dis- played strong pinkish orange fluorescence (figure 7a and 7c), and a few fluoresced strong orange or 298 NEW CVD-GROWN SYNTHETIC DIAMONDS FROM APOLLO GEMS & GEMOLOGY WINTER 2007 Figure 2. Most of the partially polished CVD-grown crystals examined were cylindrical with distinctive laser grooves along the outer rims. The diameter of this cylinder (left, sample AP-21) is 3.46 mm. The laser grooves were still visible on the girdles of many of the faceted round brilliants (right, sample AP-10, field of view 1.0 mm). Photomicro- graphs by W. Wang. Figure 3. These two par- tially polished CVD crystals (1.05 and 1.20 ct) had a tabular mor- phology that is charac- teristic of CVD synthet- ic diamonds. Photos by Jian Xin (Jae) Liao.
  • 11. orangy red (figure 7b). An interesting feature was the occurrence of regions with irregularly patterned strong blue fluorescence. The size of these regions varied significantly between samples. In some of the samples, the blue fluorescence was concentrated near the culet (figure 7c), and in others it was on the table facet. In the latter case, a violetish blue fluo- rescence was typically observed as well (figure 7d). All samples were also checked for phosphorescence in the DiamondView (all under the same condi- tions). Weak-to-moderate blue phosphorescence was seen in 15 of the 29 samples in the near-color- NEW CVD-GROWN SYNTHETIC DIAMONDS FROM APOLLO GEMS & GEMOLOGY WINTER 2007 299 Figure 5. Some of the CVD samples showed attractive fancy colors: (a) 0.71 ct, Fancy Dark brownish pinkish orange; (b) 0.34 ct, Fancy brown-pink; (c) 0.28 ct, Fancy Dark pink-brown; (d) 0.33 ct, Fancy Dark yellowish brown. Photos by Jian Xin (Jae) Liao. Figure 4. These faceted CVD samples from Apollo Diamond (0.15–0.30 ct) range from E to H on the GIA color grading scale. Photos by Jian Xin (Jae) Liao. a b c d
  • 12. 300 NEW CVD-GROWN SYNTHETIC DIAMONDS FROM APOLLO GEMS & GEMOLOGY WINTER 2007 less group (figure 8). Within this group, we did not observe any systematic changes in fluorescence/ phosphorescence in the DiamondView as the color grade increased from E to M. In general, the phos- phorescence colors appeared evenly distributed throughout the CVD-grown diamonds, with no vari- ations visible even in samples showing the distinct zonations of blue and orange-to-pink fluorescence. The orange-to-pink CVD synthetic diamonds showed stronger reddish orange fluorescence in the DiamondView (figure 9a-d) than was seen in the near-colorless samples; none showed the irregularly patterned blue fluorescence. In general, the fluores- cence in the orange-to-pink samples was evenly dis- tributed, with only three of the 11 samples showing bands of weaker orange color. These bands were uniform in thickness, oriented parallel to the table facet, and had sharp, well-defined boundaries (figure Figure 7. In the DTC DiamondView, most of the near-colorless group of CVD synthetic dia- monds displayed strong pinkish orange fluores- cence (a and c), and some fluoresced strong orange or orangy red (b). Several had very irregu- lar regions with strong blue (c) or violetish blue (d) fluorescence. Photos by W. Wang. Figure 6. Most of the faceted CVD synthetic diamonds studied had high clarity grades, in the VVS and VS ranges. The internal features that most affected the clarity grades were: (a) surface-reaching fractures (field of view 2.5 mm); (b) surface-reaching cavities (field of view 1.4 mm); and (c) pinpoints and clouds (field of view 0.9 mm). Photomicrographs by W. Wang and K. S. Moe. a b a b c d c
  • 13. NEW CVD-GROWN SYNTHETIC DIAMONDS FROM APOLLO GEMS & GEMOLOGY WINTER 2007 301 9b). Narrow growth striations were visible in many of the samples due to variations in fluorescence intensity, and evenly distributed weak green fluo- rescence (figure 9c) was also observed in five of the 11 orange-to-pink samples. Of all the fancy-color CVD synthetic diamonds studied, only one of the orange-to-pink samples (AP-34) showed weak blue plus some small areas of green phosphorescence (fig- ure 10) in the DiamondView. The three dark brown CVD synthetic diamonds showed orangy red fluorescence in the Diamond- View, but with much weaker intensity than that of the other two groups. The irregularly patterned blue fluorescence observed in the near-colorless group also occurred in the brown samples, but was very limited in distribution. Graining and Birefringence. Graining was a com- mon feature in all the CVD synthetic diamonds studied. In contrast to that observed in natural dia- Figure 9. The fancy-color CVD synthetic dia- monds with distinct orange-to-pink colors showed a more intense reddish orange fluores- cence (a–d) than the near-colorless group when examined with the DiamondView. Three of the 11 samples in this group showed bands of weaker orange fluorescence (b), possi- bly due to variations in crystal growth condi- tions. Five also dis- played distinct green flu- orescence (c). Photos by W. Wang and K. S. Moe. Figure 8. The Diamond- View revealed blue phos- phorescence of weak (left) to moderate (right) intensity in about half of the CVD-grown dia- monds in the near-color- less group. All the phos- phorescence images were collected under the same conditions. Photos by W. Wang and K. S. Moe. a b c d
  • 14. 302 NEW CVD-GROWN SYNTHETIC DIAMONDS FROM APOLLO GEMS & GEMOLOGY WINTER 2007 monds, the internal graining in most of the CVD samples showed indistinct boundaries that appeared fuzzy. Only three samples showed graining with rel- atively well-defined edges (see, e.g., figure 11). Strong birefringence was another important fea- ture of these CVD samples. Under magnification with crossed polarizers, all the samples displayed very high-order interference colors (figure 12). The CVD products commonly showed red, blue, green, and even white interference colors that were in sharp contrast to the gray colors that are typical of natural type IIa diamonds. While bands of interference colors occurred in a few samples, most displayed irregular patterns. No correlation was observed between body- color and interference color or pattern; comparable interference features occurred in both the near-color- less and fancy-color CVD groups. RESULTS OF SPECTROSCOPIC ANALYSIS Infrared Absorption Spectroscopy. Several distinct features in the IR spectra correlated directly with the bodycolors of the CVD synthetic diamonds. In the mid-infrared region, samples in the near-color- less group showed no detectable absorptions relat- ed to nitrogen or boron impurities, indicating they Figure 10. Only one (AP-34) of the 14 fancy-color CVD-grown diamonds phosphoresced in the DiamondView, showing weak blue with minor amounts of green luminescence. Photo by W. Wang. Figure 11. Internal graining was well developed but “fuzzy” in most of the CVD synthetic diamonds studied. Graining with clearly observable outlines, as seen here in sample AP-18, was rare. Photomicro- graph by W. Wang; field of view 2.4 mm. Figure 12. When examined with crossed polarizers, type IIa CVD synthetic diamonds usually show much higher-order interference colors than natural type IIa diamonds, as illustrated by the samples shown here: (a) type IIa faceted CVD-grown diamond; (b) type IIa cylindrical CVD-grown crystal; and (c) interference pattern of a typical natural type IIa diamond. Photomicrographs (fields of view 1.8, 3.8, and 1.4 mm, respec- tively) by W. Wang and K. S. Moe. a b c
  • 15. NEW CVD-GROWN SYNTHETIC DIAMONDS FROM APOLLO GEMS & GEMOLOGY WINTER 2007 303 were all type IIa, and exhibited only a weak peak at 1332.1 cm–1 (figure 13). All the fancy-color sam- ples showed stronger absorption at 1332.1 cm–1 . Additionally, all were classified as type IIa; howev- er, they showed a weak absorption at 1344.5 cm–1 (~0.1 cm–1 in intensity) that was due to the pres- ence of ~5 ppm of isolated nitrogen. In addition, weak but distinct absorptions at 1371.0, 1362.3, and 1352.9 cm–1 were consistently recorded in the fancy-color CVD-grown diamonds, but did not occur in the near-colorless group. Differences between the near-colorless and fancy- color samples were also noted in the region of 3200–2700 cm–1 (figure 14). In this range, CVD sam- ples in the near-colorless group showed only the gradual increase in absorption that is intrinsic to dia- mond. In contrast, all the fancy-color samples exhib- ited a sharp absorption at 3123.0 cm–1 with signifi- cant intensity caused by a hydrogen-related lattice defect (Fuchs et al., 1995a,b). Many other weak and broad features also occurred in this region, including peaks at 2901.7, 2807.5, and 2727.8 cm–1 . The integrated intensities of the absorptions (i.e., the areas under the peaks) at 1371.0 and 1352.9 cm–1 , as represented in figure 13, displayed positive linear correlations with each other (figure 15, left; a similar correlation for the 1362.3 peak is not shown) and with the H-related peak at 3123.0 cm–1 (figure 15, right), but no correlation was observed with the concentration of isolated nitrogen (i.e., the 1344.5 cm–1 peak). We also observed significant variations in the near-infrared range (figure 16). For the near-colorless CVD group, the samples ranging in color from F to J showed only two very weak absorptions at 6855 and 5562 cm–1, whereas the E-color sample (AP-01) had no detectable absorptions in the entire NIR region. The K-to-M CVD synthetic diamonds generally showed two additional weak absorptions at 7353 and 6425 cm–1. While all of these absorptions were <1.0 cm–2 in integrated intensity, NIR features in the K-to- M samples appeared slightly stronger than those in samples from the rest of the near-colorless group. The orange-to-pink CVD samples exhibited much stronger absorptions at 7353 (average integrat- ed intensity 2.12 cm–2) and 6425 cm–1. However, they did not show the peaks at 6855 and 5562 cm–1; instead, many sharp peaks occurred in the range 9000–4200 cm–1, including the strong absorptions at 7917 and 7804 cm–1 reported by Twitchen et al. (2007) as the 1263 and 1281 nm lines. This group of samples showed other major NIR peaks at 7533, 6963, 6828, 6425, 6064, 5219, 4888, 4672, and 4337 cm–1 (again, see figure 16, left). All the lines were sharp and relatively strong in intensity. The three dark brown CVD synthetic diamonds showed absorption features that were very similar to those of the K-to-M colors, with two additional sharp and strong peaks at 8752 and 7837 cm–1, and two sharp peaks at 7225 and 7189 cm–1 (figure 16, right). In these three dark brown diamonds, all the peaks were very strong and linearly correlated with Figure 13. CVD synthetic diamonds from the near- colorless group (e.g., AP-12) showed only a weak absorption at 1332.1 cm–1. In the fancy-color CVD diamonds (e.g., AP-33, AP-35), more intense peaks were observed. Spectra shifted vertically for clarity. Figure 14. In the near-colorless group of CVD synthetic diamonds (e.g., AP-12), no absorption at 3123.0 cm–1 was recorded. In contrast, that H-related absorption is very strong in the fancy-color CVD diamonds (e.g., AP- 33, AP-35). Spectra shifted vertically for clarity.
  • 16. 304 NEW CVD-GROWN SYNTHETIC DIAMONDS FROM APOLLO GEMS & GEMOLOGY WINTER 2007 one another in integrated intensity (figure 17). For example, the average integrated intensity of the 7353 cm–1 peak in the dark brown samples was 89.2 cm–2. UV-Vis-NIR Absorption Spectroscopy. The E-to-J CVD-grown diamonds in the near-colorless group showed no specific features in the UV-Vis region except for a very slight increase in absorption from ~500 nm to the high-energy (low-wavelength) side (e.g., sample AP-22 in figure 18). An extremely weak and broad band at ~270 nm was recorded in the slightly brown samples. Sample AP-16, which had the most brown (“M”) in the near-colorless group, also had the highest-intensity absorption at ~270 nm of the near-colorless samples. The broad ~270 nm band is caused by trace amounts of isolated nitrogen. Analysis of the samples in the orange-to-pink group revealed some consistent absorption features, including broad bands at ~270 nm and ~520 nm, a gradual increase in absorption from ~450 nm to the Figure 15. In the fancy-color CVD synthetic diamonds, the integrated intensities displayed positive linear correla- tions between (left) absorptions at 1352.9 cm–1 and 1371.0 cm–1, and (right) those absorptions (represented here by the peak at 1352.9 cm–1) and the H-related absorption at 3123.0 cm–1. Figure 16. Some distinct correlations were observed between absorptions in the near-infrared region and the body- colors of the CVD samples. Generally, the orange-to-pink samples (e.g., AP-33) showed stronger peaks than those in the near-colorless group (e.g., AP-04 and AP-13; left). In dark brown CVD diamonds (e.g., AP-51; right), very strong absorptions were consistently observed. Note the difference in scale between the spectra on the left and right; also, spectra on the left have been shifted vertically for clarity.
  • 17. NEW CVD-GROWN SYNTHETIC DIAMONDS FROM APOLLO GEMS & GEMOLOGY WINTER 2007 305 high-energy (low-wavelength) side, and sharp peaks at 413.5, 419.4, 425.0, 495.3, 503.3, 637.0, 666.7, 685.3, and 712.1 nm (see spectrum of sample AP-31 in figure 18). Among the sharp absorptions, the 637.0 nm peak, the zero phonon line (ZPL) of the nitrogen- vacancy [N-V]– center, was the strongest. In the three dark brown samples, absorption increased gradually from ~600 nm to the high-energy (low- wavelength) side with a broad band centered at ~520 nm (figure 19). Only two sharp, but weak, absorp- tions at 624.5 and 637.6 nm were recorded. A broad shoulder centered at ~370 nm appeared in samples AP-35 and AP-50; however, the feature is difficult to discern in sample AP-51 due to very strong absorp- tion in this region. All these broad features are simi- lar to those reported in as-grown brown CVD syn- thetic diamond by, for example, Martineau et al. (2004, figure 11), Twitchen et al. (2004, 2007), and Hounsome et al. (2005). Photoluminescence and Raman Spectroscopy. Numerous emission lines were recorded with four dif- ferent lasers, some of which were observed with mul- tiple excitation wavelengths. The major PL features are summarized below on the basis of individual laser excitation in the defect’s most sensitive region. When blue laser (488 nm) excitation was employed (figure 20), all the CVD synthetic dia- monds in the near-colorless group displayed weak and sharp peaks at 543.3 and 546.1 nm. Weak peaks at 501.2, 534.0, 534.4, and 540.0 nm also occurred in over 70% of the samples in this group (not shown); in general, these weak peaks were either all present or all absent. A weak emission at 512.2 nm (not shown) was also observed in about half the samples tested. An outstanding feature in the near-colorless group was the occurrence of a weak 3H emission (ZPL at 503.5 nm) in about 70% of the samples. Only one sample (AP-14) showed a very weak H3 emission (ZPL at 503.1 nm). All the orange-to-pink CVD samples showed extremely strong H3 emis- sions as well as a cluster of weak emissions at 493.7–500.9 nm with major lines at 494.6, 498.1 (not shown), and 546.1 nm. Moderate H3 emissions Figure 17. Six absorption peaks in the near-infrared region of the dark brown CVD synthetic diamonds displayed positive linear correlations. Figure 18. In the UV-Vis region, absorption spectra from CVD samples of the near-colorless group (e.g., AP-22) are generally flat. Broad bands at ~270 nm and ~520 nm and some sharp peaks including a ZPL at 637.0 nm were consistently recorded in CVD sam- ples with orange-to-pink coloration (e.g., AP-31). Figure 19. This absorption spectrum is typical of the dark brown CVD synthetic diamonds.
  • 18. 306 NEW CVD-GROWN SYNTHETIC DIAMONDS FROM APOLLO GEMS & GEMOLOGY WINTER 2007 were also recorded in all three dark brown CVD samples, together with a 512.2 nm peak (not shown). Additional weak emissions at 540.0 (not shown), 543.3, and 546.1 nm were present in some of the samples of this group. Green laser (514.5 nm) excitation revealed strong emission systems of N-V centers in the CVD sam- ples of all colors (575 and 637.0 nm [not shown]; fig- ure 21). Doublet emissions at 596.5 and 597.0 nm occurred in all samples of the near-colorless group. The same doublet appeared in all three dark brown samples, but with an additional weak peak at 595.3 nm. In contrast, these features were absent in the orange-to-pink CVD synthetic diamonds. In addition, all three dark brown samples exhibited weak peaks, as shown in the inset to figure 21, at 555.0, 557.1, and 559.1 nm, with the strongest intensity at 559.1 nm. These correspond to Raman shifts at 1418, 1486, and 1550 cm–1 , respectively. The last of these is due to the presence of non-diamond carbon (Zaitsev, 2001). The Raman shifts of these three peaks were con- firmed based on the same energy shift (i.e., these fea- tures appeared at different wavelengths, but with the same Raman shift, when excited by the two different lasers) using 488 nm laser excitation but with weaker intensity than those obtained from 514.5 nm laser excitation. When excited by a red laser (633 nm), all the samples in the near-colorless group showed weak silicon-related emission (figure 22), which is usually composed of two very sharp peaks at 736.6 and 736.9 nm (generally referred to as the 737 nm defect; Vavilov et al., 1980; Clark et al., 1995; Iakoubovskii et al., 2001). We should point out that this emission also was present in 75% of the sam- ples of this group when 488 or 514.5 nm laser exci- tation was used. In addition, weak emissions at 664.0, 665.8, and 833.8 nm (not shown) were record- ed with the red laser in about half the samples in the near-colorless group. In all the orange-to-pink samples, a weak emission occurred at 823.4 nm. However, the Si-related 737 nm emission was observed in eight of the 11 samples. While most Si- related emissions were very weak in this group, two samples (AP-38 [figure 22] and AP-39) displayed extremely strong peaks. None of the orange-to-pink samples showed Si-related emission peaks when 488 or 514.5 nm laser excitation was used. Of the three dark brown CVD synthetic diamonds, only one (AP-50) showed a very weak emission at the Si- related 737 nm defect (again, see figure 22). No emission at 737 nm was observed in the other two dark brown samples with any laser excitation. Infrared laser excitation at 830 nm produced many weak and sharp emission features in the Figure 20. When blue laser (488 nm) excitation was used, the PL spectra showed H3 emission in the orange- to-pink (e.g., AP-41) and dark brown (e.g., AP-35) CVD samples. A weak 3H emission occurred in most of the CVD samples in the near-colorless group (e.g., AP-05). Other peaks, such as at 543.3 and 546.1 nm, were also observed among the various color groups. Figure 21. The PL spectra of all CVD synthetic dia- monds examined in this study were dominated by N-V center emission systems at 575 nm (the 637 nm peak is not shown) when green laser (514.5 nm) exci- tation was employed. In addition, Raman scattering peaks at 1418, 1486, and 1550 cm–1 (555.0, 557.1, and 559.1 nm) were observed in all three dark brown CVD synthetic diamonds (inset) but not in any sam- ple of other colors.
  • 19. NEW CVD-GROWN SYNTHETIC DIAMONDS FROM APOLLO GEMS & GEMOLOGY WINTER 2007 307 850–880 nm region for the near-colorless group of CVD-grown diamonds, including peaks at 851.1, 855.5, 864.0, 866.0, 867.4, 869.0, and 878.6 nm (fig- ure 23). We also observed weak peaks at 946.1 and 951.3 nm in all samples of this group. In the orange- to-pink CVD-grown diamonds, we recorded even more weak emissions, including those at 847.2, 850.1, 864.8, 867.7, 869.4, 881.2, 924.7, 943.0, 945.9, 954.4, and 956.1 nm. The dark brown CVD samples exhibited fewer emissions, among them weak peaks at 855.2, 861.5, 878.3, 887.2, 888.0, 940.1, 947.4, and 951.3 nm. DISCUSSION Improvements in Gem Quality. As previously reported (Wang et al., 2003), gem-quality synthetic diamonds grown by Apollo Diamond Inc. represent- ed some of the first examples of single-crystal mate- rial grown by the CVD process that were intended for the jewelry trade. Most of the samples produced at the time that article was published showed limit- ed thickness due to the tabular morphology of the CVD crystal. For the most part, the few faceted syn- thetic diamonds studied were a very strong brown, relatively small (<0.30 ct), and received moderate- to-low clarity grades (VS1–SI2). In comparison, the 2006–2007 Apollo Diamond products showed sub- stantial improvements in color, with colorless, near-colorless, and fancy orange-to-pink material representative of the gem-quality CVD-grown dia- monds that are now commercially available. In addition to the previously documented near- colorless and brown CVD material, Martineau et al. (2004) reported on high-quality single-crystal CVD synthetic diamond with blue color produced by boron doping during crystal growth and on a 0.85 ct round-cut as-grown fancy brownish pink CVD syn- thetic diamond (see sample N8 in table 3 of that ref- erence). Until the present article, little was known about the gemological and spectroscopic features of orange-to-pink CVD synthetic diamonds produced by Apollo Diamond. These very attractive colors, as shown in figures 1 and 5, are comparable to some top-quality fancy-color natural diamonds. Improvements in clarity were also observed. The clarity grades of over 67% of the samples provided from Apollo’s recent production fell in the range VVS1–VS2. Only a few were in the SI–I range. Improved clarity was mainly achieved by reducing the amount of larger inclusions and pinpoints. While most of the samples examined for this study con- tained some pinpoints, very few contained other inclusions that could be resolved even under magni- fication up to 100×. However, several fractures were observed, particularly in the samples fashioned as cylinders. Significant internal stress was indicated by strong birefringence in many specimens (figure 12). As with natural diamonds, internal stress in these CVD synthetic diamonds—or the stress of the cutting process—is likely to contribute to cracking. Improvements in the CVD growth process have led to larger faceted gems. Even though most of the faceted gems in the current study were still under Figure 23. Many weak emission lines were detected in the infrared region of the PL spectra when 830 nm laser excitation was used. Clear differences were observed among the near-colorless, orange-to-pink, and dark brown CVD samples. Figure 22. Si-related emission peaks at 736.6 and 736.9 nm were recorded with varying intensities in the PL spectra of most CVD synthetic diamonds. These features were best seen when red laser excita- tion at 633 nm was used.
  • 20. 308 NEW CVD-GROWN SYNTHETIC DIAMONDS FROM APOLLO GEMS & GEMOLOGY WINTER 2007 0.30 ct, the fact that many samples over half a carat were available and that those cut as round brilliants were well proportioned (table 1) indicates that thick- er crystals are used to create the latest-generation Apollo products. In brief, the overall color and clarity of the CVD synthetic diamonds examined in this study is similar to that of the Element Six CVD products reported by Martineau et al. (2004). It should be noted, though, that the CVD syn- thetic diamonds examined by Martineau et al. are not commercially available. Apollo products similar in quality to those described in this report have been introduced to the gem trade. All of these CVD- grown products carry a distinctive inscription that identifies them as Apollo Diamonds. Causes of Improved Clarity and Color. Production of top-quality CVD synthetic diamonds using a rela- tively high growth rate continues to be a challenge, leading to extensive testing of various combinations of growth parameters. Achard et al. (2005) reported that incorporating as little as 10 ppm of nitrogen in the total gas phase could increase the crystal growth rate by a factor of 2.5 with no degradation of the sur- face morphology or color. However, Achard et al.’s samples were not of gem thickness, so the color could not be graded using accepted gemological techniques. According to Martineau et al. (2004), based on growth conditions and additional treatment after growth, CVD synthetic diamonds may be divided into four groups, including high purity and nitrogen doped. The nitrogen-doped product contains a detectable amount of N-bearing lattice defects in UV-Vis absorption and/or photoluminescence spec- troscopy, whereas high-purity samples do not. The occurrence of N-V centers, observed as very strong emission systems in the PL spectra of all the Apollo CVD samples tested for the present study (figure 21), indicated that all the samples contained nitrogen. Even in the colorless (E and F) CVD samples, emis- sion from the N-V centers was readily detectable. However, there is a strong correlation between increasing color and greater N-V emission (normal- ized to the Raman peak height). This is further evi- dence that nitrogen plays a leading role in the deter- mination of color in the CVD-grown diamonds. The reasons for nitrogen doping in these CVD samples were different for each color group. For the near-colorless group, nitrogen was controlled at rel- atively low levels to achieve high growth rates while maintaining crystal quality (Linares and Doering, 2003). IR absorption spectroscopy did not detect any nitrogen impurities in samples of this group. However, the extremely weak, broad band seen at ~270 nm in the UV-Vis-NIR absorption spectra of the samples with a slightly brownish hue is due to isolated nitrogen in concentrations at the ppm (parts per million) level. Non-diamond carbon, deposited during CVD diamond growth, is known to cause brown color in CVD synthetic diamonds; however, the absence of non-diamond carbon (fig- ure 21), and the weak correlation between the con- centration of isolated nitrogen and the color grades, suggests that the slight brownish hue in near-color- less samples could be caused by a combination of the detected defects such as isolated nitrogen and N-V centers; additionally, non-diamond carbon could be present, but in concentrations too low to be detected with Raman spectroscopy. The impact of nitrogen doping in the fancy-color CVD synthetic diamonds is more complicated. Higher concentrations of nitrogen were added into the gas phase and, as a result, more nitrogen was incorporated into the diamond lattice during growth. Relatively high concentrations of isolated nitrogen were revealed in the IR and UV-Vis-NIR absorption spectra (figures 13 and 18). Only 5 ppm of isolated nitrogen is needed to produce yellow-to-orange color in diamond. Moderately strong absorption from the [N-V]– defect (ZPL at 637.0 nm; figure 18) in combi- nation with the broad ~520 nm band likely resulted in selective absorption of orange light, and produced a pink color. Assignment of the ~520 nm broad band is unclear, but in these samples it functioned very similarly to the ~550 nm broad absorption band known to cause the color in many natural pink dia- monds by selectively absorbing green-to-orange light. The ~520 nm broad band could have been the main color contributor for this group of diamonds. The dark brown diamonds are distinctive due to the presence of non-diamond carbon (figure 21), which was not detected in either of the other two CVD groups studied. The combination of relatively high concentrations of isolated nitrogen, a weak-to- moderate absorption band at ~520 nm, and the pres- ence of non-diamond carbon resulted in a gradual increase in absorption from the low-energy to high- energy (high-wavelength to low-wavelength) side of the UV-Vis-NIR absorption spectra. Consequently, brown coloration was produced in these samples. Defect Interrelations and Their Implications. Absorptions with varying intensities at 3123.0,
  • 21. NEW CVD-GROWN SYNTHETIC DIAMONDS FROM APOLLO GEMS & GEMOLOGY WINTER 2007 309 1371.0, 1362.3, and 1352.9 cm–1 occurred in the fancy-color CVD samples (again, see figures 13 and 14). The 3123.0 cm–1 absorption is routinely observed in nitrogen-doped single-crystal CVD syn- thetic diamonds (Wang et al., 2003; Martineau et al., 2004). The absorption was studied via isotopic sub- stitution with 2D (i.e., deuterium, isotope of hydro- gen with mass 2 amu) and determined to be a vibra- tion involving a single hydrogen atom (Fuchs et al., 1995b). Recent investigation of the 3123.0 cm–1 absorption using a combination of annealing and uniaxial-stress experiments suggested that the NVH– defect is responsible (Cruddace et al., 2007a). The negative nitrogen-vacancy-hydrogen com- plex, NVH–, was first identified in single-crystal CVD synthetic diamond using electron paramagnet- ic resonance (EPR) spectroscopy (Glover et al., 2003). Hydrogen is a common IR-active impurity in natural type Ia and occasionally type IIa diamonds, often showing a sharp absorption at 3107 cm–1 . Chrenko et al. (1967) first found this absorption, and Woods and Collins (1983) proposed that it originat- ed from a C-H stretching vibration mode. The variation in peak positions of hydrogen- related absorption is one of the most important spectroscopic differences between natural and CVD synthetic diamonds. Positive correlations in intensi- ty among all these four peaks (figure 15) indicated that the other three peaks (1371.0, 1362.3, and 1352.9 cm–1 ) could also be related to or caused by the NVH– defect. Meanwhile, recent studies (Cruddace et al., 2007a,b) using uniaxial-stress experiments revealed different symmetries of these centers. These discrepancies are not fully under- stood. Based on the relationship Cruddace et al. (2007a) established, we calculated that the concen- trations of NVH– defect varied from 1.3 to 4.3 ppb in these fancy-color CVD synthetic diamonds. Many of the peaks in the near-infrared region (8752, 7353, 6855, 6425, and 5562 cm–1; figure 16) were reported in Wang et al. (2003). These peaks were present in the near-colorless and dark brown samples, but with an additional one at 7837 cm–1. Interstitial hydrogen and hydrogen trapped at vacan- cies are potential candidates for the absorption at 7353 cm–1 (Goss, 2003). In the dark brown samples, these absorptions were extremely strong, which per- mitted accurate determination of their integrated intensities and thus allowed us to investigate their correlations. Similar positive linear correlations also occurred among six absorption peaks (8752, 7837, 7353, 6855, 6425, and 5562 cm–1 ) in the near-infrared region (figure 17), but none of these peaks showed any observable correlation with the 3123.0 cm–1 absorption in intensity. All these observations indi- cate that the six absorption peaks in the near-IR region of the dark brown samples are very likely related to or caused by the same defect, but not the NVH– defect. An outstanding feature of the PL spectrum of the orange-to-pink CVD-grown diamonds is the strong H3 center (figure 20). The occurrence of H3 is rein- forced by the green fluorescence (figure 9c). The H3 defect is in the neutral charge state (N-V-N)0 . This defect forms in nitrogen-bearing diamonds through combination of the nitrogen A aggregate and a vacancy. Formation of this defect usually involves irradiation and annealing at relatively high tempera- tures (e.g., Collins, 1982, 2001) or is associated with distinct plastic deformation features. While very common in irradiated/annealed type Ia diamonds, varying concentrations of the H3 defect also occur in some natural-color type Ia diamonds. The H3 defect can be a major contributor to the yellow color in some natural diamonds (King et al., 2005). In natural type IIa diamonds, though, the H3 defect is observed in extremely low concentrations or is not detectable even when very sensitive PL spec- troscopy is employed. Strong H3 emissions, as observed in the PL spectra of the orange-to-pink CVD samples in this study, are extremely rare in natural type IIa diamonds, as well as in CVD syn- thetic diamonds of other colors. The occurrence of relatively high concentrations of the H3 defect in this specific group indicates a possible link to the production of orange-to-pink hues. The 3H defect that was observed in most dia- monds in the near-colorless group is widely believed to be introduced by radiation and has a complicated annealing behavior. Heating to 300–400°C may increase the 3H center intensity considerably depending on the concentration of nitrogen in the diamond (Zaitsev, 2001). This defect can be stable at temperature as high as 1000°C (Steeds et al., 1999). Most CVD diamond growth occurs at ≥800°C and it is more likely that the 3H center was introduced during the crystal growth process. Twitchen et al. (2007) first reported the develop- ment of 7917 and 7804 cm–1 absorptions in the near-infrared region (corresponding to the 1263 and 1281 nm peaks in the reference) in CVD synthetic diamonds when annealed to 1400–1500°C at ambi- ent pressure. In a recent uniaxial stress and anneal- ing study, Cruddace et al. (2007c) further found that
  • 22. 310 NEW CVD-GROWN SYNTHETIC DIAMONDS FROM APOLLO GEMS & GEMOLOGY WINTER 2007 the 7354 cm–1 system annealed out in the tempera- ture range of 1300–1600°C at ambient pressure, and two lines at 7917 and 7804 cm–1 appeared. These two peaks, as well as many others, were observed in all the Apollo fancy orange-to-pink samples with varying intensities (figure 16). In addition, features similar to those seen in prior research were observed in the UV-Vis-NIR absorption spectra. Weak absorption peaks at 503.3 (due to H3 defects) and 666.7 nm (figure 18) in their orange-to-pink CVD synthetic diamonds developed when brown CVD synthetic diamond was annealed (Twitchen et al., 2007). The absorption feature at approximately 624 nm disappeared when their sam- ple was heated in the range of 1200–1400°C (Twitchen et al., 2007). In the present study, a fea- ture at 624.5 nm was seen in the spectra of the dark brown samples (figure 19) but not in those of the orange-to-pink group. The mechanism for the occurrence of the spectroscopic features observed with IR/UV-Vis-NIR absorption and PL spec- troscopy in the orange-to-pink CVD synthetic dia- monds studied for the present report is not well understood, and further investigation is ongoing. Identification Features. The progress made over the past few years toward the efficient growth of single- crystal CVD synthetic diamond has opened a range of possible industrial and jewelry applications (fig- ure 24). Several other organizations and institutes (e.g., Element Six, Carnegie Institute, LIMHP-CNRS in France, and the National Institute for Material Sciences in Japan) have demonstrated the capability to grow single-crystal CVD diamond with products of varying sizes and quality. In addition, Apollo Diamond Inc. has begun producing and marketing CVD-grown gems to the jewelry industry. Identification and separation of CVD synthetic diamonds from natural diamonds can be achieved through careful attention to the gemological and spectroscopic properties. While not conclusive, sev- eral gemological observations serve as good indica- tions of CVD material: strong internal graining with an indistinct “fuzzy” appearance, high-order inter- ference colors (figure 12a), occurrence of pinpoints and occasional clouds (figure 6), and remnant laser grooves on the girdles (figure 2b). These gemological features do, however, appear in some natural dia- monds (Moses et al., 1999). Crystal inclusions are not commonly present in either CVD or natural type IIa diamonds, but when they are present, their appearance can be diagnostic of natural origin. Early products from Apollo with varying satura- tions of brown color displayed a weak orange fluo- rescence to UV radiation that was considered a use- ful indication of CVD synthesis (Wang et al., 2003; Martineau et al., 2004). However, this feature is absent from most of the new products due to improvements in the growth technique and crystal quality. Most of the samples in the near-colorless and dark brown groups were inert, and only a few near-colorless samples showed very weak orange fluorescence under the UV lamp. The very weak to moderate orange fluorescence observed in the orange-to-pink samples, on the other hand, was similar to that seen in some natural pink diamonds (King et al., 2002), which also makes this property problematic as an identification criterion. Fluorescence and phosphorescence images obtained from the DTC DiamondView continue to be very useful for identification of CVD synthetic diamonds. Orange fluorescence with irregularly pat- terned areas of blue fluorescence, narrow growth bands, and blue phosphorescence (figures 7–9) appear to be characteristic features of CVD-grown diamonds, if present. Most natural type IIa dia- monds show relatively uniform blue fluorescence and rarely show phosphorescence in the Diamond- View. Although a few natural type IIa diamonds show orange fluorescence, the co-existence of orange and irregular blue fluorescent regions has not been observed in natural stones. In addition, natural type IIa diamonds often show characteristic internal features (e.g., “mosaic” networks of polygonized dislocations) that likely would not occur in CVD synthetic diamonds. Natural diamonds with trace amounts of isolated nitrogen rarely show any pink hue, or dominant red-orange fluorescence in the DiamondView. Spectroscopic features are very important for CVD identification. For near-colorless samples, the occurrence of weak absorptions in the near-infrared region (7353, 6855, 6425, 5562 cm–1 ; figure 16) and/or a very weak absorption band at ~270 nm in the UV-Vis-NIR region are indicative of CVD growth. Occurrence of a 3123.0 cm–1 absorption in the mid-infrared region was considered to be an important feature of the early CVD synthetic dia- monds (Wang et al., 2003), but this absorption was absent in all of the near-colorless group tested. Important identification features from photolumi- nescence spectroscopy (figures 20–23) include strong emissions from N-V centers, the 596/597 doublet, and emissions at 534.0, 543.3, 546.1, 736.6,
  • 23. 736.9, 946.1, and 951.3 nm. These luminescence features can be activated by lasers of various wave- lengths. Occurrence of the 3H defect in most of the near-colorless group of CVD samples (figure 20) is not well understood, and this feature has also been reported in CVD synthetic diamonds from another producer (Wang et al., 2005). Many of the previously listed emissions (596/597 doublet, and emissions at 534.0, 543.3, 546.1, 736.6, 736.9, 946.1, and 951.3 nm) are specific to CVD synthetic diamonds and have not been detected in natural diamonds (Martineau et al., 2004; Wang et al., 2005). However, it should be pointed out that the Si-related 737 nm emission was recently found in natural type IIa and low-nitro- gen diamonds (Breeding et al., 2007). Since the Si- related 737 nm emission is extremely rare in natu- ral diamonds, its occurrence in photoluminescence spectroscopy is still a very useful indicator of a CVD synthetic diamond. For those CVD synthetic diamonds with orange- to-pink and dark brown colors, IR absorption spec- troscopy proved more useful for identification than photoluminescence. Occurrence of a sharp 3123.0 cm–1 absorption (figure 14) from an H-related defect and the combination of absorptions at 1371.0, 1362.3, 1352.9, and 1344.5 (due to isolated nitrogen) are specific to these fancy-color CVD synthetic dia- monds (figure 13). Very strong absorptions at 8752, 7837, 7353, 6855, 6425, and 5562 cm–1 in dark brown samples and numerous (7917, 7804, 7533, 7353, 6963, 6828, 6425, 6064, 5219, 4888, 4672, and 4337 cm–1 ) sharp absorption peaks in the near- infrared region of orange-to-pink samples (figure 16) are characteristic identification features for these two groups. The ~520 nm broad absorption band in UV-Vis-NIR spectra (figures 18 and 19) is slightly lower in position than the 550 nm band in natural diamonds. The well-known 596/597 photolumines- cence doublet emissions were entirely absent in the orange-to-pink CVD synthetic diamonds, and the Si-related 737 nm emission occurred in few of the fancy-color CVD-grown diamonds. The identification of CVD synthetic diamonds from natural stones may be achieved based on a combination of various gemological and spectro- scopic features. There is no single feature that will ensure proper identification of all CVD synthetic diamonds, and testing in a properly equipped gemo- logical laboratory is needed to guarantee confident identification. CONCLUSIONS Compared to earlier-generation products, the CVD synthetic diamonds submitted by Apollo Diamond Inc. as representative of their 2006–2007 produc- tion showed significant improvements in color and clarity. Relatively larger, well-proportioned, faceted CVD products have also become more common. Colorless, near-colorless, and attractive fancy-color material is now being produced. The new products are comparable in quality to many natural diamonds in the marketplace. The gem sizes (0.14–0.71 ct) reflect the highest-volume seg- ment of the natural diamond market. These CVD synthetic diamonds exhibited unusual internal graining, high birefringence, complex fluorescence zoning, and several distinct spectroscopic features. All of these CVD synthetic diamonds can be iden- tified, but a combination of various gemological and, especially, spectroscopic features is required to do so consistently and accurately. We anticipate that CVD diamond growth techniques will contin- ue to improve and CVD products with even better quality will eventually be introduced to the gem market. NEW CVD-GROWN SYNTHETIC DIAMONDS FROM APOLLO GEMS & GEMOLOGY WINTER 2007 311 Figure 24. CVD lab-grown diamonds are now avail- able in fine jewelry, such as these stackable rings set in yellow and white gold. Courtesy of Apollo Diamond Inc.
  • 24. 312 NEW CVD-GROWN SYNTHETIC DIAMONDS FROM APOLLO GEMS & GEMOLOGY WINTER 2007 ABOUT THE AUTHORS Dr. Wang (wuyi.wang@gia.edu) is manager of research projects, Mr. Hall is manager of identification services, Mr. Moe is research technician, and Mr. Moses is senior vice president, at the GIA Laboratory, New York. Mr. Tower is senior scientist at Apollo Diamond Inc., Boston, Massachusetts. ACKNOWLEDGMENTS The authors thank Ivana Balov, Thomas Gelb, Joshua Cohn, Paul Johnson, Dino DeGhionno, Shane McClure, Dr. James Shigley, Dr. Andy H. Shen, and Dr. Christopher M. Breeding of the GIA Laboratory for their many suggestions and assis- tance in this study. Dr. Robert Linares, Patrick Doering, and their team at Apollo Diamond are specially thanked for their continued cooperation with GIA and for their efforts to coop- erate with the jewelry industry to develop a better under- standing of CVD diamond growth technology. Constructive reviews by Dr. John Angus, Dr. James Butler, Dr. Philip Martineau, and Dr. Christopher Welbourn helped improve this article substantially. REFERENCES Achard J., Tallaire A., Sussmann R., Silva F., Gicquel A. (2005) The control of growth parameters in the synthesis of high-quality single crystalline diamond by CVD. Journal of Crystal Growth, Vol. 284, No. 3/4, pp. 396–405. Badzian A., Badzian T. (1993) Diamond homoepitaxy by chemical vapor deposition. Diamond and Related Materials, Vol. 2, No. 2/4, pp. 147–157. Breeding C.M., Wang W. (2007) Occurrence of the Si-V (737 nm) center in a natural type IIa colorless gem diamond. Abstract of 18th European Conference on Diamond, Diamond-like Materials, Carbon Nanotubes, and Nitride. Berlin, Germany, September 9–14 , p. P1.04.04. Chrenko R.M., McDonald R.S., Darrow K.A. (1967) Infrared spectra of dia- mond coat. Nature, Vol. 213, No. 5075, pp. 474–476. Clark C.D., Kanda H., Kiflawi I., Sittas G. (1995) Silicon defects in dia- mond. Physical Review B, Vol. 51, No. 23, pp. 16681–16688. Collins A.T. (1982) Colour centers in diamond. Journal of Gemmology, Vol. 18, No. 1, pp. 35–75. Collins A.T. (2001) Colour of diamond and how it may be changed. Journal of Gemmology, Vol. 27, No. 6, pp. 341–359. Cruddace R.C., Newton M.E., Smith H.E., Davies G., Martineau P.M., Twitchen D.J. (2007a) Identification of the 3123 cm−1 absorption line in SC-CVD diamond as the NVH– defect. Proceedings of the 58th De Beers Diamond Conference, Coventry, England, pp. 15.1–15.3. Cruddace R.C., Newton M.E., Smith H.E., Davies G., Fisher D., Martineau P.M., Twitchen D.J. (2007b) Uniaxial stress and annealing measure- ments on C-H bands in diamond. Proceedings of the 58th De Beers Diamond Conference, Coventry, England, pp. P19.1–P19.3. Cruddace R.C., Newton M.E., Davies G., Martineau P.M., Twitchen D.J. (2007c) Uniaxial stress and annealing studies of the NIR 913 meV sys- tem in SC-CVD diamond. Proceedings of the 58th De Beers Diamond Conference, Coventry, England, pp. P20.1–P20.2. Doering P.J., Linares R.C. (1999) Large area single crystal CVD diamond: Properties and applications. Proceedings of Applied Diamond Conference / Frontier Carbon Technology Joint Conference 1999, Tsukuba, Japan, pp. 32–35. Fuchs F., Wild C., Schwarz K., Muller-Sebert W., Koidl P. (1995a) Hydrogen induced vibrational and electronic transitions in chemical vapor deposited diamond, identified by isotopic substitution. Applied Physics Letters, Vol. 66, No. 2, pp. 177–179. Fuchs F., Wild C., Schwarz K., Koidl P. (1995b) Hydrogen-related IR absorp- tion in chemical vapour deposited diamond. Diamond and Related Materials, Vol. 4, No. 5/6, pp. 652–656. Goss J.P. (2003) Theory of hydrogen in diamond. Journal of Physics: Condensed Matter, Vol. 15, No. 17, pp. R551–R580. Glover C., Newton M.E., Martineau P.M., Twitchen D.J., Baker L.M. (2003) Hydrogen incorporation in diamond: The nitrogen-vacancy- hydrogen complex. Physical Review Letters, Vol. 90, No. 18, pp. 185507–185510. Goodwin D.G., Butler J.E. (1997) Theory of diamond chemical vapor deposi- tion. In M.A. Prelas, G. Popovici, and L.K. Bigelow, Eds., Handbook of Industrial Diamonds and Diamond Films, Marcel Dekker, New York, pp. 527–581. Hounsome L.S., Jones R., Martineau P.M., Shaw M.J., Briddon P.R., Öberg S., Blumenau A.T., Fujita N. (2005) Optical properties of vacancy relat- ed defects in diamond. Physica Status Solidi (a), Vol. 202, No. 11, pp. 2182–2187. Iakoubovskii K., Adriaenssens G.J., Dogadkin N.N., Shiryaev A.A. (2001) Optical characterization of some irradiation-induced centers in dia- mond. Diamond and Related Materials, Vol. 10, No. 1, pp. 18–26. King J.M., Moses T.M., Shigley J.E., Liu Y. (1994) Color grading of colored diamonds at the GIA Gem Trade Laboratory. Gems & Gemology, Vol. 30, No. 4, pp. 220–242. King J.M., Shigley J.E., Guhin S.S., Gelb T.H., Hall M. (2002) Characterization and grading of natural-color pink diamonds. Gems & Gemology, Vol. 38, No. 2, pp. 128–147. King J.M., Shigley J.E., Gelb T.H., Guhin S.S., Hall M., Wang W. (2005) Characterization and grading of natural-color yellow diamonds. Gems & Gemology, Vol. 41, No. 2, pp. 88–115. Linares R.C., Doering P.J. (1999) Properties of large single crystal diamond. Diamond and Related Materials, Vol. 8, No. 2/5, pp. 909–915. Linares R.C., Doering P.J. (2003) System and method for producing syn- thetic diamond. US Patent 6,582,513. Martineau P.M., Lawson S.C., Taylor A.J., Quinn S.J., Evans D.J.F., Crowder M.J. (2004) Identification of synthetic diamond grown using chemical vapor deposition (CVD). Gems & Gemology, Vol. 40, No. 1, pp. 2–25. Miyatake H., Arima K., Maida O., Teraji T., Ito Y. (2007) Further improve- ment in high crystalline quality of homoepitaxial CVD diamond. Diamond and Related Materials, Vol. 16, No. 4/7, pp. 679–684. Moses T.M., Shigley J.E., McClure S.F., Koivula J.I., Van Daele M. (1999) Observations on GE-processed diamonds: A photographic record. Gems & Gemology, Vol. 35, No. 3, pp. 14–22. Moses T.M., Johnson M.L., Green B., Blodgett T., Cino K., Geurts R.H., Gilbertson A.M., Hemphill T.S., King J.M., Komylak L., Reinitz I.M., Shigley J.E. (2004) A foundation for grading the overall cut quality of round brilliant cut diamonds. Gems & Gemology, Vol. 40, No. 3, pp. 202–228. Steeds J.W., Davis T.J., Charles S.J., Hayes J.M., Butler J.E. (1999) 3H lumi- nescence in electron-radiated diamond samples and its relationship to self-interstitials. Diamond and Related Materials, Vol. 8, No. 10, pp. 1847–1852. Tallaire A., Achard J., Sussmann R.S., Silva F., Gicquel A. (2005) Homoepitaxial deposition of high-quality thick diamond films: Effect of growth parameters. Diamond and Related Materials, Vol. 14, No. 3/7, pp. 249–254. Twitchen D.J., Martineau P.M., Scarsbrook G.A., Dorn S.C., Cooper M.A. (2004) Coloured diamond. Patent publication number US2004194690. Twitchen D.J., Martineau P.M., Scarsbrook G.A. (2007) Coloured dia- mond. Patent publication number US2007079752. Vavilov V.S., Gippius A.A., Zaitsev A.M., Deryagin B.V., Spitsyn B.V., Aleksenko A.E. (1980) Investigation of the cathodoluminescence of epitaxial diamond films. Soviet Physics-Semiconductors, Vol. 14, pp. 1078–1079. Wang W., Moses T., Linares R., Shigley J.E., Hall M., Butler J.E. (2003) Gem-quality synthetic diamonds grown by the chemical vapor deposi- tion method. Gems & Gemology, Vol. 39, No. 4, pp. 268–283. Wang W., Tallarie A., Hall M.S., Moses T.M., Achard J., Sussmann R.S., Gicquel A. (2005) Experimental CVD synthetic diamonds from LIMHP- CNRS, France. Gems & Gemology, Vol. 41, No. 3, pp. 234–244. Welbourn C.M., Cooper M., Spear P.M. (1996) De Beers natural versus synthetic diamond verification instruments. Gems & Gemology, Vol. 32, No. 3, pp. 156–169. Woods G.S., Collins A.T. (1983) Infrared absorption spectra of hydrogen complexes in type I diamonds. Journal of Physics and Chemistry of Solids, Vol. 44, No. 5, pp. 471–475. Yan C.-S., Mao H.-K., Li W., Qian J., Zhao Y.S., Hemley R.J. (2004) Ultrahard diamond single crystals from chemical vapor deposition. Physica Status Solidi, Rapid Research Note, Vol. 201, No. 4, pp. R25–R27. Zaitsev A.M. (2001) Optical Properties of Diamond. Springer-Verlag, Berlin, 502 pp.
  • 25. near the border with Malawi. However, there are no gem-bearing pegmatites in the Chipata area, and the actual locality is the Lundazi District, located ~160 km to the north (as indicated by Rossman and Mattson, 1986). Since the location was kept secret for many years, some more recent reports have named the source locality as Mozambique (Wong, 2001) or Malawi (e.g., Boehm, 2001; Federman, 2002). The enriched manganese content of this Zambian elbaite has led some authors to refer to it as tsilaisite (Schmetzer and Bank, 1983, 1984b; Kane, 1986).a While in Zambia in August 2004, three of the authors (BML, WBS, and BA) visited the most important deposit for yellow elbaite, known as the Canary mining area, to gather information on the geology and production of this unusual material, and to obtain samples for gemological characteriza- tion and chemical analysis. Two days were spent at YELLOW MN-RICH TOURMALINE FROM THE CANARY MINING AREA, ZAMBIA Brendan M. Laurs, William B. (Skip) Simmons, George R. Rossman, Eric A. Fritz, John I. Koivula, Björn Anckar, and Alexander U. Falster See end of article for About the Authors and Acknowledgments. GEMS & GEMOLOGY, Vol. 43, No. 4, pp. 314–331. © 2007 Gemological Institute of America The most important source of yellow gem elbaite is the Canary mining area in the Lundazi District of eastern Zambia. The tourmaline has been mined since 1983 from both pegmatite and eluvial/alluvial deposits, in colors typically ranging from yellow-green to yellow to orange and brown; much of the orange-to-brown material is heated to attain a “golden” or “canary” yellow color. The tourmaline is Mn-rich (up to 9.18 wt.% MnO documented in the literature) and con- tains traces of Ti and little or no Fe. The distinctive composition of this tourmaline is probably the result of the crystallization of abundant schorl from an unusual B-rich, Li-poor pegmatite magma, which depleted Fe while conserving Mn until the late-stage crystallization of gem pockets. 314 YELLOW TOURMALINE FROM ZAMBIA GEMS & GEMOLOGY WINTER 2007 ince the early 1980s, gem-quality yellow elbaite has been intermittently mined from a small area in eastern Zambia. Marketed as Canary tourmaline since 2001, this material is notable for its vivid yellow color and high Mn con- tent—among the highest ever recorded in any tour- maline (e.g., Shigley et al., 1986). Starting in 2002, organized purchasing and mining initiatives brought greater quantities of this elusive tourmaline to the market, particularly in Japan, where it has gained popularity and commanded high prices (Federman, 2002; “Supplier to vertically inte- grate…,” 2004). Although most of the cut tourma- line available is in melee sizes (<0.20 ct), exception- al faceted stones up to 50 ct have been cut (figure 1). Due to its unusual color and composition, this tourmaline attracted considerable attention in the mineralogical literature when it first entered the marketplace (see Nuber and Schmetzer, 1984; Schmetzer and Bank, 1984a; Rossman and Mattson, 1986; Shigley et al., 1986). While some of these arti- cles did not specify the locality within Zambia, oth- ers stated “near Chipada,” which refers to the largest town (Chipata) in eastern Zambia, located S
  • 26. the deposit with Tommy Wu (Shire Trading Ltd., Hong Kong), who was leasing the mine in partner- ship with a Zambian company. Since then, Mr. Wu has updated information on the mining and produc- tion, and supplied additional samples for our research. LOCATION AND ACCESS The Canary mining area is located at coordinates 12°23.764′ S, 32°53.471′ E, and ~1,440 m elevation. This position lies 32 km west-southwest of Lundazi (figure 2 inset), from which the deposit can be reached in about one hour by car on moderately well- maintained dirt roads. Two small villages are located near the mining area: Muchapansala and Chanya- lubwe. The mining camp (figure 3) is powered by a generator and obtains drinking water from a well. The deposit can be worked roughly 10 months of the year, excluding the rainy season from late December to early February. In the past, the deposit also has been referred to as the Kaombeka or Doost-Chiwele mine (Njamu, 2003). HISTORY AND PRODUCTION Initial gem discoveries in the Lundazi District proba- bly occurred in the late 1970s through activities of local villagers (Patney and Tether, 1988). The Canary mining area was originally worked for electronic- grade quartz (ca. 1982), and the brown tourmaline was tossed into the mine dumps (Njamu, 2003). Yellow tourmaline from eastern Zambia was first documented by Schmetzer and Bank (1983). It is like- ly that the material came from the Canary mining area (known as Kaombeka at the time), which is the most important source of this tourmaline in the area. A survey of the literature revealed only one other yel- low tourmaline–producing site in the Lundazi District, which was mapped by O’Connor (1998) as the Chamunjili mine, located 18 km northeast of the Canary mining area. To the authors’ knowledge, this locality has not been active for several years. The first organized search for tourmaline in the Canary mining area occurred in 1987 (when it was still known as Kaombeka). At that time, the main pegmatite was worked by the Small Mines Unit of Zambian Consolidated Copper Mines (ZCCM). Although Zgambo (1995) reported that ZCCM removed 540 m3 of material from two pits, yielding 242 kg of gem rough, the total production of tour- YELLOW TOURMALINE FROM ZAMBIA GEMS & GEMOLOGY WINTER 2007 315 Figure 1. Commercial quantities of Mn-rich “canary” yellow elbaite come from just one deposit, the Canary mining area in eastern Zambia. Although the material is typically cut in melee sizes, this exceptional stone weighs 50.26 ct. Cour- tesy of Shire Trading Ltd.; photo © Harold & Erica Van Pelt. a Tsilaisite is the name proposed by Kunitz (1929) for a hypothetical Mn-rich tourmaline end member, after the first locality where high-Mn tourmaline was documented (Tsilaisina, Madagascar). The term appeared in a list of new mineral names published by Dunn et al. (1985), although it had not been approved by the Commission on New Minerals and Mineral Names of the International Mineralogical Association. Tsilaisite was recently included in a list of discredited minerals (Burke, 2006), because no samples have been documented with sufficient Mn to attain the end-member composition. Therefore, we have placed the term in quotes when referring to the Mn-rich end- member composition in this article.
  • 27. maline (of all qualities) obtained by ZCCM was probably several tonnes (T. Wu, pers. comm., 2004). The largest single gem pocket was reportedly dis- covered in the mid-1990s by a subsequent owner; it produced approximately 3 tonnes of tourmaline, of which 0.5 tonne was of good gem quality (T. Wu, pers. comm., 2004). This pocket was found at a depth of about 4 m, and two smaller cavities— which yielded up to 100 kg of tourmaline—were encountered at approximately the same depth as mining proceeded to the east. As of November 1997, the deposit lay idle and the pit was filled with water (O’Connor, 1998). In 2001, Mr. Wu together with Rita and Arun Mittal entered a purchasing agreement with as many as 60 local miners working the eluvial and alluvial deposits. They began creating a market for yellow tourmaline in Japan (and, to a lesser extent, in the U.S. and Europe) with gems cut from 3–4 kg of good-quality rough material. In late 2002, Mr. Wu and the Mittals formed a partnership to lease the area under the name Canary Mining Ltd. By the end of 2002, Canary Mining had amassed ~800 kg of rough tourmaline. Most of this would cut small stones of 3 mm or less, but a few large gems (e.g., 30, 14, and 11 ct) also were faceted. In February 2003, Canary Mining began working secondary deposits near the original pegmatite, with modest results over the next five months. From December 2003 to August 2004, they used an exca- vator to explore primary deposits on the property (figure 4). However, they did not recover any tour- maline from the new areas tested, and the main pit appeared to be exhausted. Subsequent work has focused on intermittently mining the secondary deposits, typically producing 30–40 kg per month (or ~2 kg of tourmaline per day, consisting of 500–800 g of good gem rough). The 50 ct tourma- line in figure 1 was cut from this material (T. Wu, pers. comm., 2006). In July 2007, Canary Mining Ltd. was acquired by Canary Gemstone International DMCC, a hold- ing company formed in Dubai, with Mr. Wu and Mrs. Mittal as major shareholders. The influx of capital obtained through this venture will allow for the expansion of mining activities in 2008. 316 YELLOW TOURMALINE FROM ZAMBIA GEMS & GEMOLOGY WINTER 2007 Figure 2. The Canary mining area is located in eastern Zambia, 32 km west-southwest of Lundazi. The mining area is covered by the Tumbuka, Kabelubelu, and Canary concessions. Most Canary tourmaline production has come from Kabelubelu. The Canary concession has been a source of “dou- ble blue” aquamarine, but not tourmaline.
  • 28. GEOLOGY Pegmatites in the Lundazi area are known for pro- ducing mica and gem-quality aquamarine, spessar- tine, tourmaline (green, pink, or yellow), and rose quartz. These pegmatites and their gems have been described by Thomas (1982), Patney and Tether (1988), Zgambo (1995), Johnson et al. (1997), Milisenda et al. (2000), and Njamu (2003). Patney and Tether (1988) defined two belts of gem-bearing pegmatites in the Lundazi District, and indicated that they are broadly synchronous with the late Pan-African Sinda Batholith (~489 million years old [Ma]). Snelling et al. (1972) dated an undeformed pegmatite near Lundazi at 485 Ma. The Canary mining area is underlain by Precambrian metamorphic rocks of the Irumide Foldbelt (e.g., Johns et al., 1989). O’Connor (1998) mapped the deposit within leucocratic gneiss (con- taining biotite, garnet, and sillimanite) of the Lumezi Gneiss Group. Deep soils cover the area, and the best exposures of the basement rocks are found in some mining pits and along the stream that crosses the mining claims. The main pegmatite in the Canary mining area YELLOW TOURMALINE FROM ZAMBIA GEMS & GEMOLOGY WINTER 2007 317 Figure 3. The mining camp for Canary tourmaline, shown here in the dry season (August), is located in a remote part of the Lundazi District. Photo by W. B. Simmons. Figure 4. Canary Mining Ltd. used a large excava- tor to explore primary deposits from December 2003 to August 2004. The main pegmatite is being mined down-dip from the area that pro- duced large amounts of tourmaline in the mid- 1990s; Asok Napa (in the foreground) was the mine’s general manager during that time. Photo by Tommy Wu.
  • 29. 318 YELLOW TOURMALINE FROM ZAMBIA GEMS & GEMOLOGY WINTER 2007 is a lens-shaped body that discordantly intrudes biotite gneiss; it strikes east-west (~100°) and dips moderately south. At the time of the authors’ 2004 visit, a large open pit (~16 m deep) partially filled with water marked the site where most of the peg- matite had been removed. Based on the extent of the workings, the pegmatite is believed to have been at least 60 m long and perhaps 18 m at its widest point (Njamu, 2003). Exposures of the foot- wall showed a medium-grained border zone (~15 cm wide) and in places a discontinuous aplitic zone that abruptly transitioned into a coarse-grained interme- diate zone consisting mainly of K-feldspar and sub- ordinate sodic plagioclase (figure 5). The hydrother- mal leaching of quartz had resulted in vugs that contained euhedral overgrowths of albite and black tourmaline needles. We also observed conspicuous veins (up to 10 cm thick) of black tourmaline ± K- feldspar + albite cross-cutting the pegmatite. The host gneiss adjacent to the pegmatite was locally biotized and tourmalinized near the contact, but the minimal alteration overall indicated that the peg- matite had little interaction with the wallrock. The large cavity found in the mid-1990s was in the central-northwestern part of the pit, in or near the core of the pegmatite. This pocket also con- tained abundant quartz crystals and “cleave- landite” feldspar. Although remains of these miner- als were found on the mine dump, there was no evidence of any micas, such as the lepidolite that is commonly associated with gem tourmaline in granitic pegmatites. The Canary deposit is distinctly different from other gem-bearing pegmatites in the area in that it lacks micas and is not a source of aquamarine. Zgambo (1995) indicated that rose quartz, mica, beryl, and gem-quality pink tourmaline were encountered during mining in 1987, but no evidence of these minerals was seen during our visit. There was also no evidence of the allanite, magnetite, and blue/pink/green tourmaline that were reported by Njamu (2003). One of the present authors (BA) noted some spessartine in the mine dumps in 2003, but no garnet was seen in the pegmatite itself. A reconnaissance survey of past workings in the surrounding area during the authors’ visit revealed two additional pegmatites with similar mineralogy, but they were much smaller than the main peg- matite and reportedly did not yield any gem tour- maline in situ (T. Wu, pers. comm., 2004). In addi- tion, pegmatites with a distinctively different min- eralogy were seen in the area. These quartz-rich peg- matites contained biotite (in sparse amounts, and typically no schorl) as the mafic mineral, and formed segregations in a granitoid rock or cross-cut- ting dikes in biotite gneiss. They were mined for dark blue (or “double blue”) aquamarine (Laurs, 2004), which is frozen within the pegmatites rather than forming in cavities; therefore, the beryl rarely yields cut stones larger than 0.5 ct. Ductile deforma- tion (the presence of bent and deformed crystals) of the beryl-bearing pegmatites indicated that they are older than the undeformed feldspar- and black tour- maline–rich type of pegmatite that contains Canary tourmaline. In places the deformed pegmatites underlie the eluvial deposits mined for tourmaline, Figure 5. The contact between the footwall of the main pegmatite and the weathered host rock is marked by the sharp boundary to the right of the hammer (see yellow line). The hammer is sitting on the medium-grained border zone, which is sepa- rated from the coarse-grained feldspar-rich inter- mediate zone by a vein of black tourmaline + K-feldspar. Photo by B. M. Laurs.
  • 30. which has created confusion about the original source of this gem material. O’Connor (1998) also documented at least two phases of pegmatites in this part of the Lundazi District, and indicated that the magnetic signature of the area suggests it may be underlain by a large granitic body. According to Mr. Wu, other pegmatites located within a few kilometers of the Canary mining area have produced spessartine and chrysoberyl. MINING AND PROCESSING The Canary mining area consists of three mining concessions, covering a total of 600 ha (6 km2 ). From west to east, these are the Tumbuka, Kabelubelu, and Canary licenses (again, see figure 2). During the authors’ visit in 2004, 13 workings were seen, most of which were located on the Kabelubelu concession. These ranged from large open pits to small exploration trenches, in both pri- mary and secondary (alluvial and eluvial) deposits. Most of the Canary tourmaline produced since 2000 has come from the Kabelubelu concession, from secondary deposits located downslope of the main pegmatite. Mining was done by hand (figure 6, left) or with a small excavator to a depth of ~1–1.5 m (exceptionally, down to 5 m). The most favorable soil horizon for tourmaline was marked by a con- centration of quartz fragments or pebbles. Miners wet-screened the material using 4 × 4 mm mesh (figure 6, right) or processed it through a simple washing plant (figure 7) consisting of a cement mixer, vibrating screens with mesh from 5 cm to 1 cm, and a sorting table (Njamu, 2003). Using water from a seasonal stream that flows through the min- ing area, the washing plant can process about 10–12 tonnes of material per day. Mining of the primary deposits (for both tourma- line and aquamarine) was done using a large excava- tor (again, see figure 4), a pneumatic hammer, and by hand with picks, shovels, pry bars, hammers, and chisels. To avoid breaking the gem material, Canary YELLOW TOURMALINE FROM ZAMBIA GEMS & GEMOLOGY WINTER 2007 319 Figure 6. Secondary deposits downslope from the main Canary pegmatite are typically mined to a depth of 1–1.5 m (left). The miners recovered the gem rough by wet-screening the excavated material using water from a flooded mining pit (right). Photos by B. Anckar, June 2003. Figure 7. The washing plant that is also used to pro- cess material from the secondary deposits consists of a cement mixer followed by a series of vibrating screens. The water tank is filled from a small reservoir made in a seasonal stream that flows through the mining area. Photo by B. M. Laurs.